This document describes how to create a page performance monitoring task to get the webpage experience data by ISP, region, browser version, operating system, or device, so that you can comprehensively know the page performance.
3. Click Create task at the top of the Tasks page.
4. Configure the basic information as follows:
Configuration Item
Description
Test mode
Select Regular test.
Task type
Select Page performance on the PC or mobile.
Test address
Enter the target web application address starting with http:// or https://.
For example:
1. Domain: http://www.tencent.com
2. Domain and port: http://www.tencent.com:80
Note: You need to enter the port when using TCP or UDP in Ping monitoring.
Test task name
Enter a custom test task name.
Test frequency
It can be 1 minute, 5 minutes, 10 minutes, 15 minutes, 30 minutes, 60 minutes, or 120 minutes. For example, if you select 5 minutes, each testing node will be tested once every five minutes.
Execution time
The task is performed every day by default. You can also customize an execution plan as needed. For example, you can set to execute a test task between 8:00 AM and 9:00 AM on any specified day of the week.
Task tag
CAT can be used with the Tencent Cloud resource tag feature to perform tag-based sub-account authorization and cost allocation.
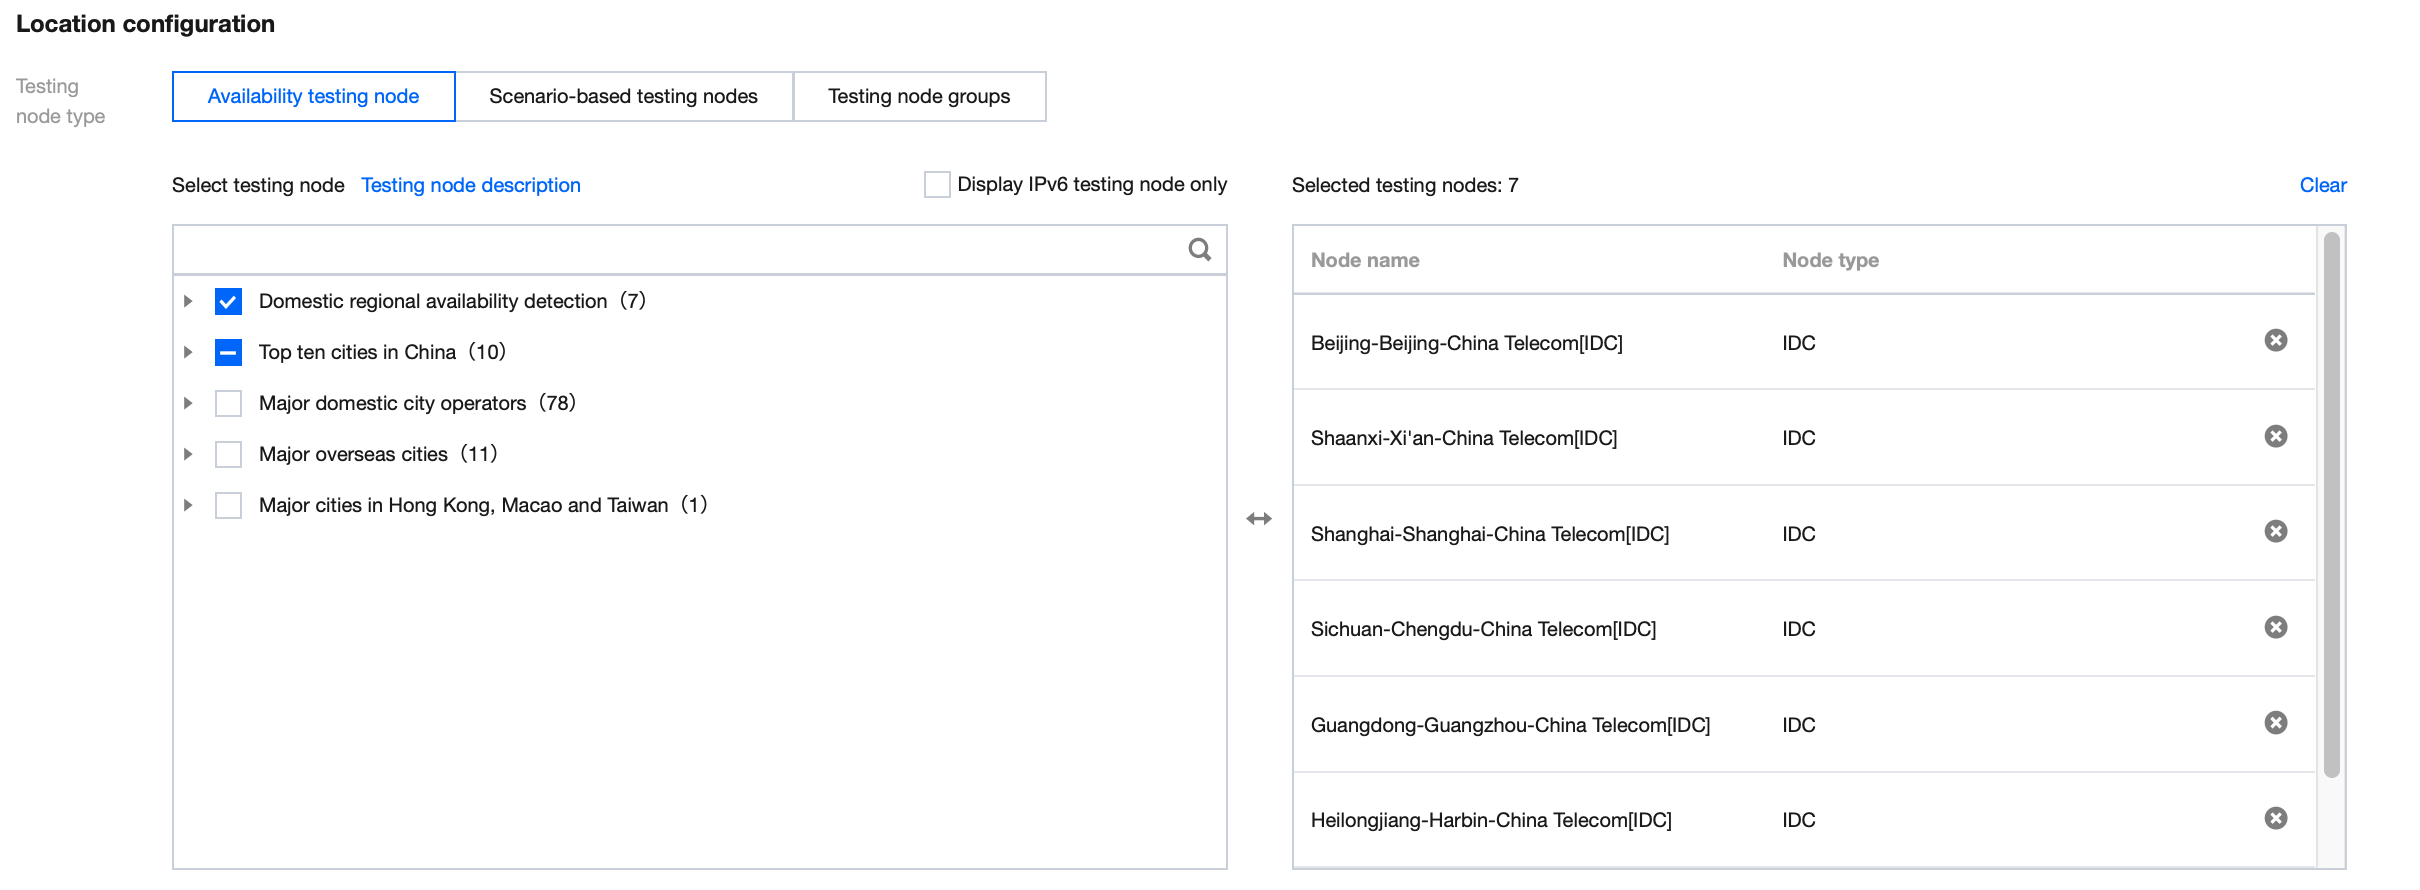
5. Configure the testing node as follows:
i. Select the method: You can select Recommended testing node group or Custom testing node group (the former contains common nodes).
ii. Select the testing node:
Availability testing nodes: Only network quality and API monitoring tasks are supported. This option is suitable for network quality monitoring, API availability monitoring, and hijacking and blocking detection.
Scenario-based testing nodes: This option is suitable for page user experience and streaming lag monitoring, availability testing under poor network conditions, CDN selection, and path optimization. It covers global IDC, PC, and mobile testing nodes.
Recommended testing node group: Commonly used and recommended testing nodes.
Custom testing node group: Select the region, node type, and testing node on the right box. Node types are as detailed below:
Testing node Type
Description
PC
IDC
It is the testing node deployed on the PC to test the PC user experience.
LastMile
It is the testing node deployed on the end user's PC to test the end user's experience on the PC.
Mobile
It is the testing node deployed on the mobile phone to test the mobile user experience.
It is the location deployed on the mobile phone to test the mobile user experience.
My testing node group: You can select a common testing node group in Scenario-based testing nodes and click Create testing node group in the bottom-right corner. Then, you can directly select a common testing node you created from My testing node group when creating a task.
Suggestions for selection
IDC and LastMile have different network environments, and the former is more stable than the latter.
To test the business availability, you can select the more stable IDC.
To check the access experience and network conditions of end users, we recommend you select LastMile or Mobile to simulate the user access to an application.
6. Configure the test parameters (optional). By default, the system configures common test parameters. You can also customize test rules as follows:
Configuration Item
Description
Default Value
IP type
It can be Auto, IPv4, or IPv6.
Auto
Custom host
It supports polling by IP or random monitoring. Separate IP addresses by comma.
When a 302 redirect from the page occurs, if the number of elements on the new page exceeds the set value, the page is hijacked. The hijacking details can be selected and viewed on the Test Statistics page.
-
Traffic hijacking (hijacking flag)
Set the key information of the match. The traffic hijacking monitoring collects data when the browsed page reported the 302 error code. The prerequisites are that the page has the 302 element and the monitored basic document reported the 302 error code.
-
Page tampering
A page is considered tampered with when elements that are not configured in the domain settings appear, such as pop-up ads, floating ads, and redirects.
-
DNS hijacking allowlist
If the IP from the DNS query is not in the allowlist, hijacking occurred, and the hijacking result can be selected and viewed in the details of the testing statistics. For more information, see Hijacking Monitoring Parameter Description.
-
DNS hijacking blocklist
If the IP from the DNS query is in the blocklist, hijacking occurred, and the hijacking result can be selected and viewed in the details of the testing statistics. For more information, see Hijacking Monitoring Parameter Description.