This document describes how to create an audio/video experience test task to test video playback on streaming media websites and in applications and get data such as the lag rate, lag duration, and time to first frame, so as to help you improve the video watch experience.
3. Click Create task at the top of the Tasks page.
4. Configure the basic information as follows:
Configuration Item
Description
Test mode
Select Regular test.
Task type
Select Audio/Video experience on the PC or mobile.
Test address
Enter the target web application address starting with http:// or https://. For MP4 RTMP streams, indicate mp4.
For example:
1. http://www.tencent.com
2. RTMP stream: rtmp://host/server/mp4:res
Test task name
Enter a custom test task name.
Test frequency
It can be 1 minute, 5 minutes, 10 minutes, 15 minutes, 30 minutes, 60 minutes, or 120 minutes. For example, if you select 5 minutes, each testing node will be tested once every five minutes.
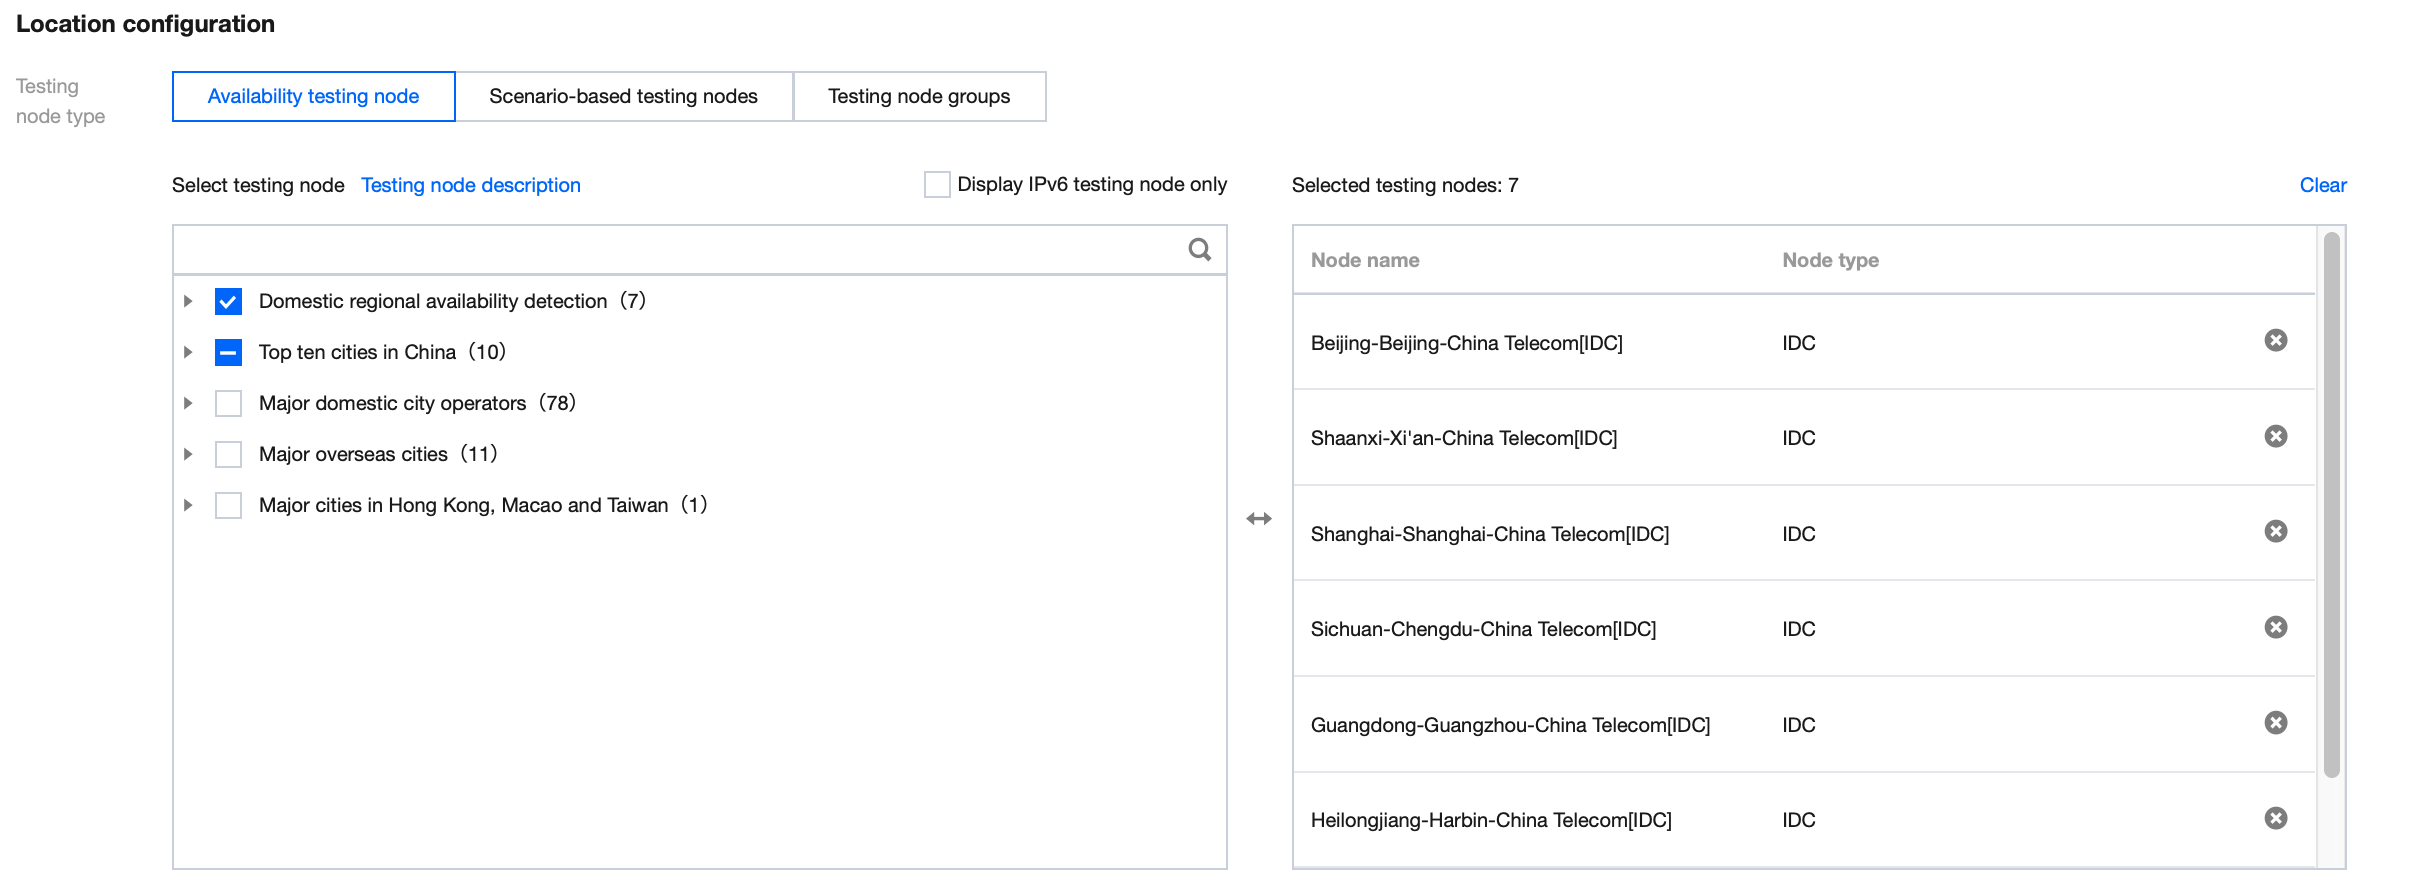
5. Configure the testing node as follows:
i. Select the method: You can select Recommended testing node group or Custom testing node group (the former contains common nodes).
ii. Select testing nodes
Availability testing nodes: Only network quality and API monitoring tasks are supported. This option is suitable for network quality monitoring, API availability monitoring, and hijacking and blocking detection.
Scenario-based testing nodes: This option is suitable for page user experience and streaming lag monitoring, availability testing under poor network conditions, CDN selection, and path optimization. It covers global IDC, PC, and mobile testing nodes.
Recommended testing node group: Commonly used and recommended testing nodes.
Custom testing node group: Select the region, node type, and testing node on the right box. Node types are as detailed below:
Testing node Type
Description
IDC
It is the testing node deployed on the PC to test the PC user experience.
LastMile
It is the testing node deployed on the end user's PC to test the end user's experience on the PC.
My testing node group: You can select a common testing node group in Scenario-based testing nodes and click Create testing node group in the bottom-right corner. Then, you can directly select a common testing node you created from My testing node group when creating a task.
Suggestions for selection
IDC and LastMile have different network environments, and the former is more stable than the latter.
To test the business availability, you can select the more stable IDC.
To check the access experience and network conditions of end users, we recommend you select LastMile or Mobile to simulate the user access to an application.
6. Configure the test parameters (optional). By default, the system configures common test parameters. You can also customize test rules as follows:
Configuration Item
Description
Default Value
IP type
It can be Auto, IPv4, or IPv6.
Auto
Media type
It can be Video or Audio.
Video
Test duration (sec)
Customize the duration of each test. Value range: 0-60.
30s
Address type
Resource address: The actual address of the streaming media to be monitored.
Page address: The page address of the streaming media to be monitored.
Page address
Custom host
It supports polling by IP or random monitoring. Separate IP addresses by comma.
Allow a DNS IP. If the IP from the DNS query is not in the allowlist, hijacking occurred, and the hijacking result can be selected and viewed in the details of the testing statistics. For more information, see Hijacking Monitoring Parameter Description.
-
Resource hijacking blocklist
Block a DNS IP. If the IP from the DNS query is in the blocklist, hijacking occurred, and the hijacking result can be selected and viewed in the details of the testing statistics. For more information, see Hijacking Monitoring Parameter Description.