This document introduces how to use PTS in script mode to quickly initiate performance testing through JavaScript scripts, helping you understand the basic usage of PTS.
Performance Testing Scenario
Description
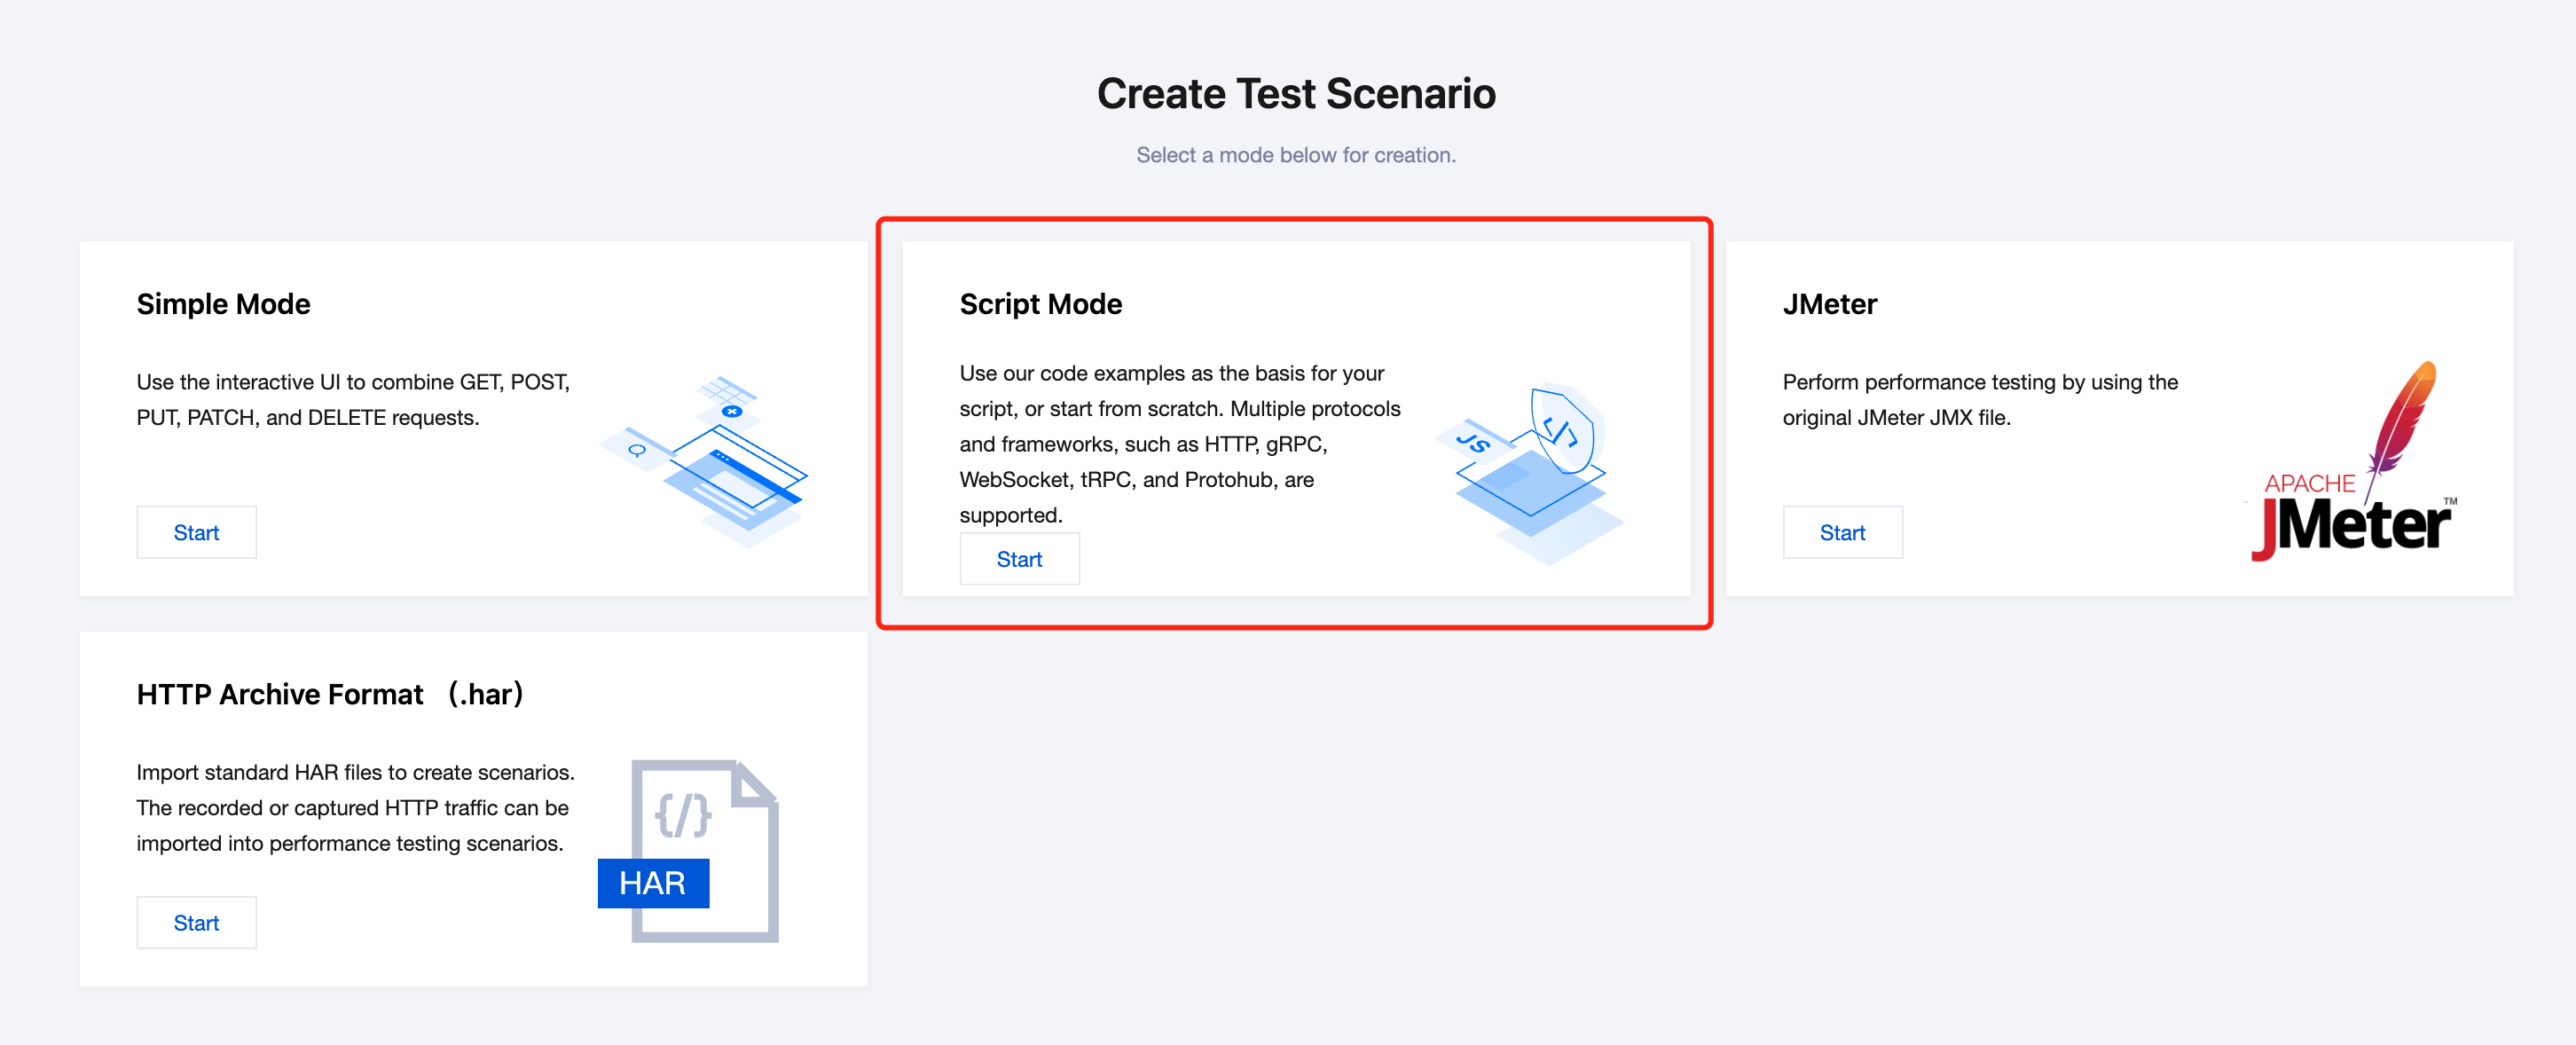
Script mode
Use our JavaScript code examples as the foundation for scripts, or start from scratch. Supports protocols such as HTTP, WebSocket, and gRPC.
Simple mode
Use our interactive UI to combine different user requests.
JMeter
Conduct performance testing using native JMeter JMX files.
Test plan import
Automatically generate testing scenarios by importing APIs such as HAR.
Traffic recording
Record browser traffic and automatically generate testing scenarios.
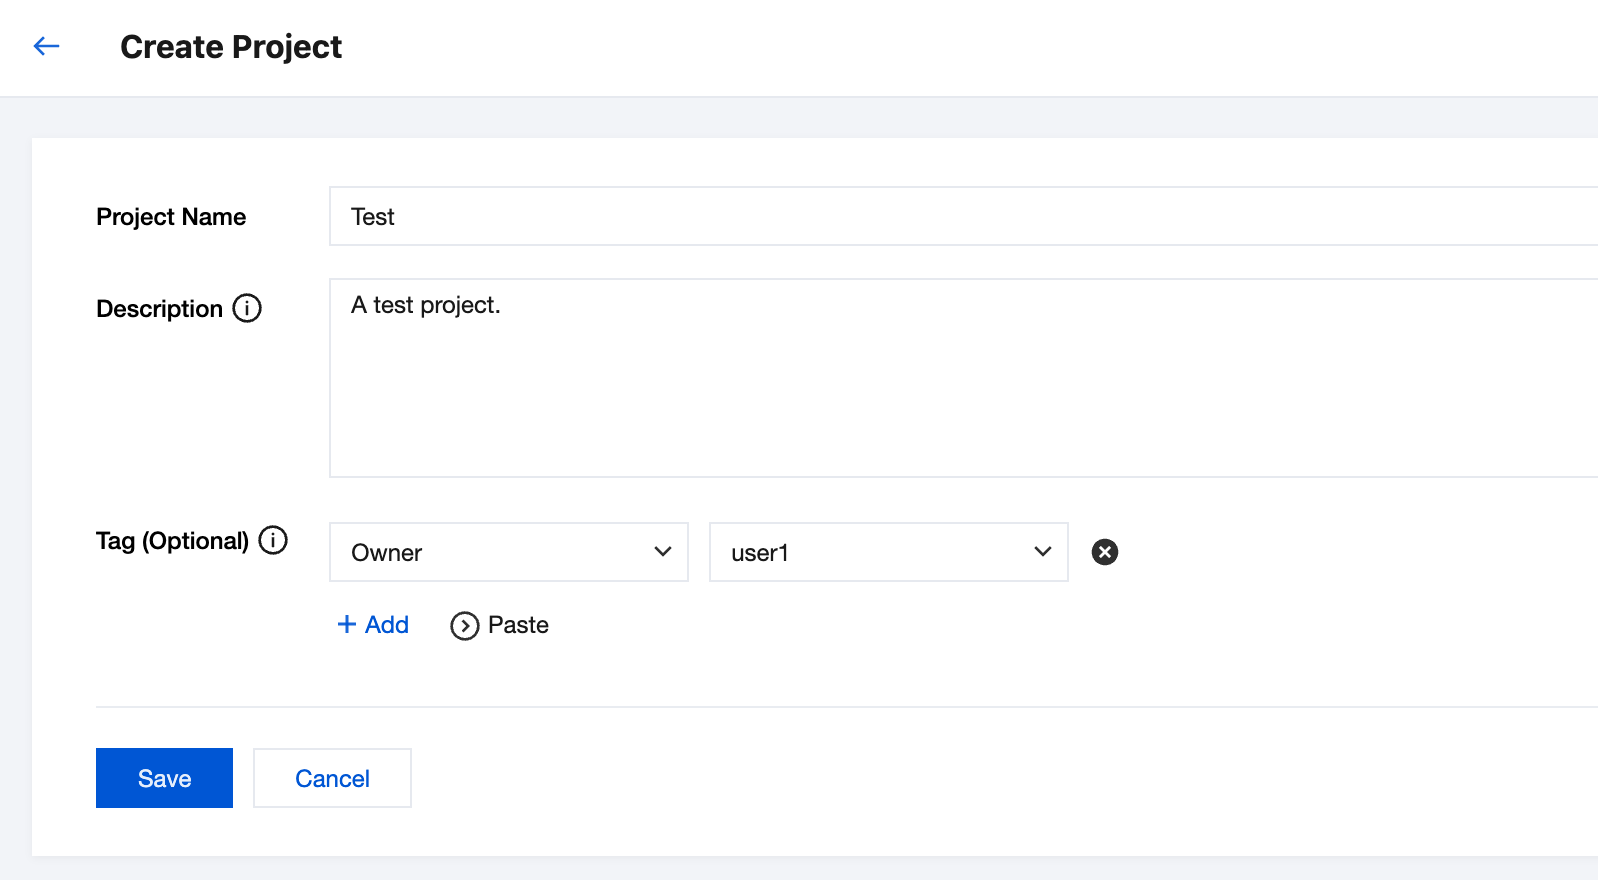
3. On the Project List page, click Create Project.
4. Fill in the Project Name, Description, and Tag. After completion, click Save.
Step 2: Creating a Testing Scenario
1. Enter the create testing scenarios page, select Script Mode.
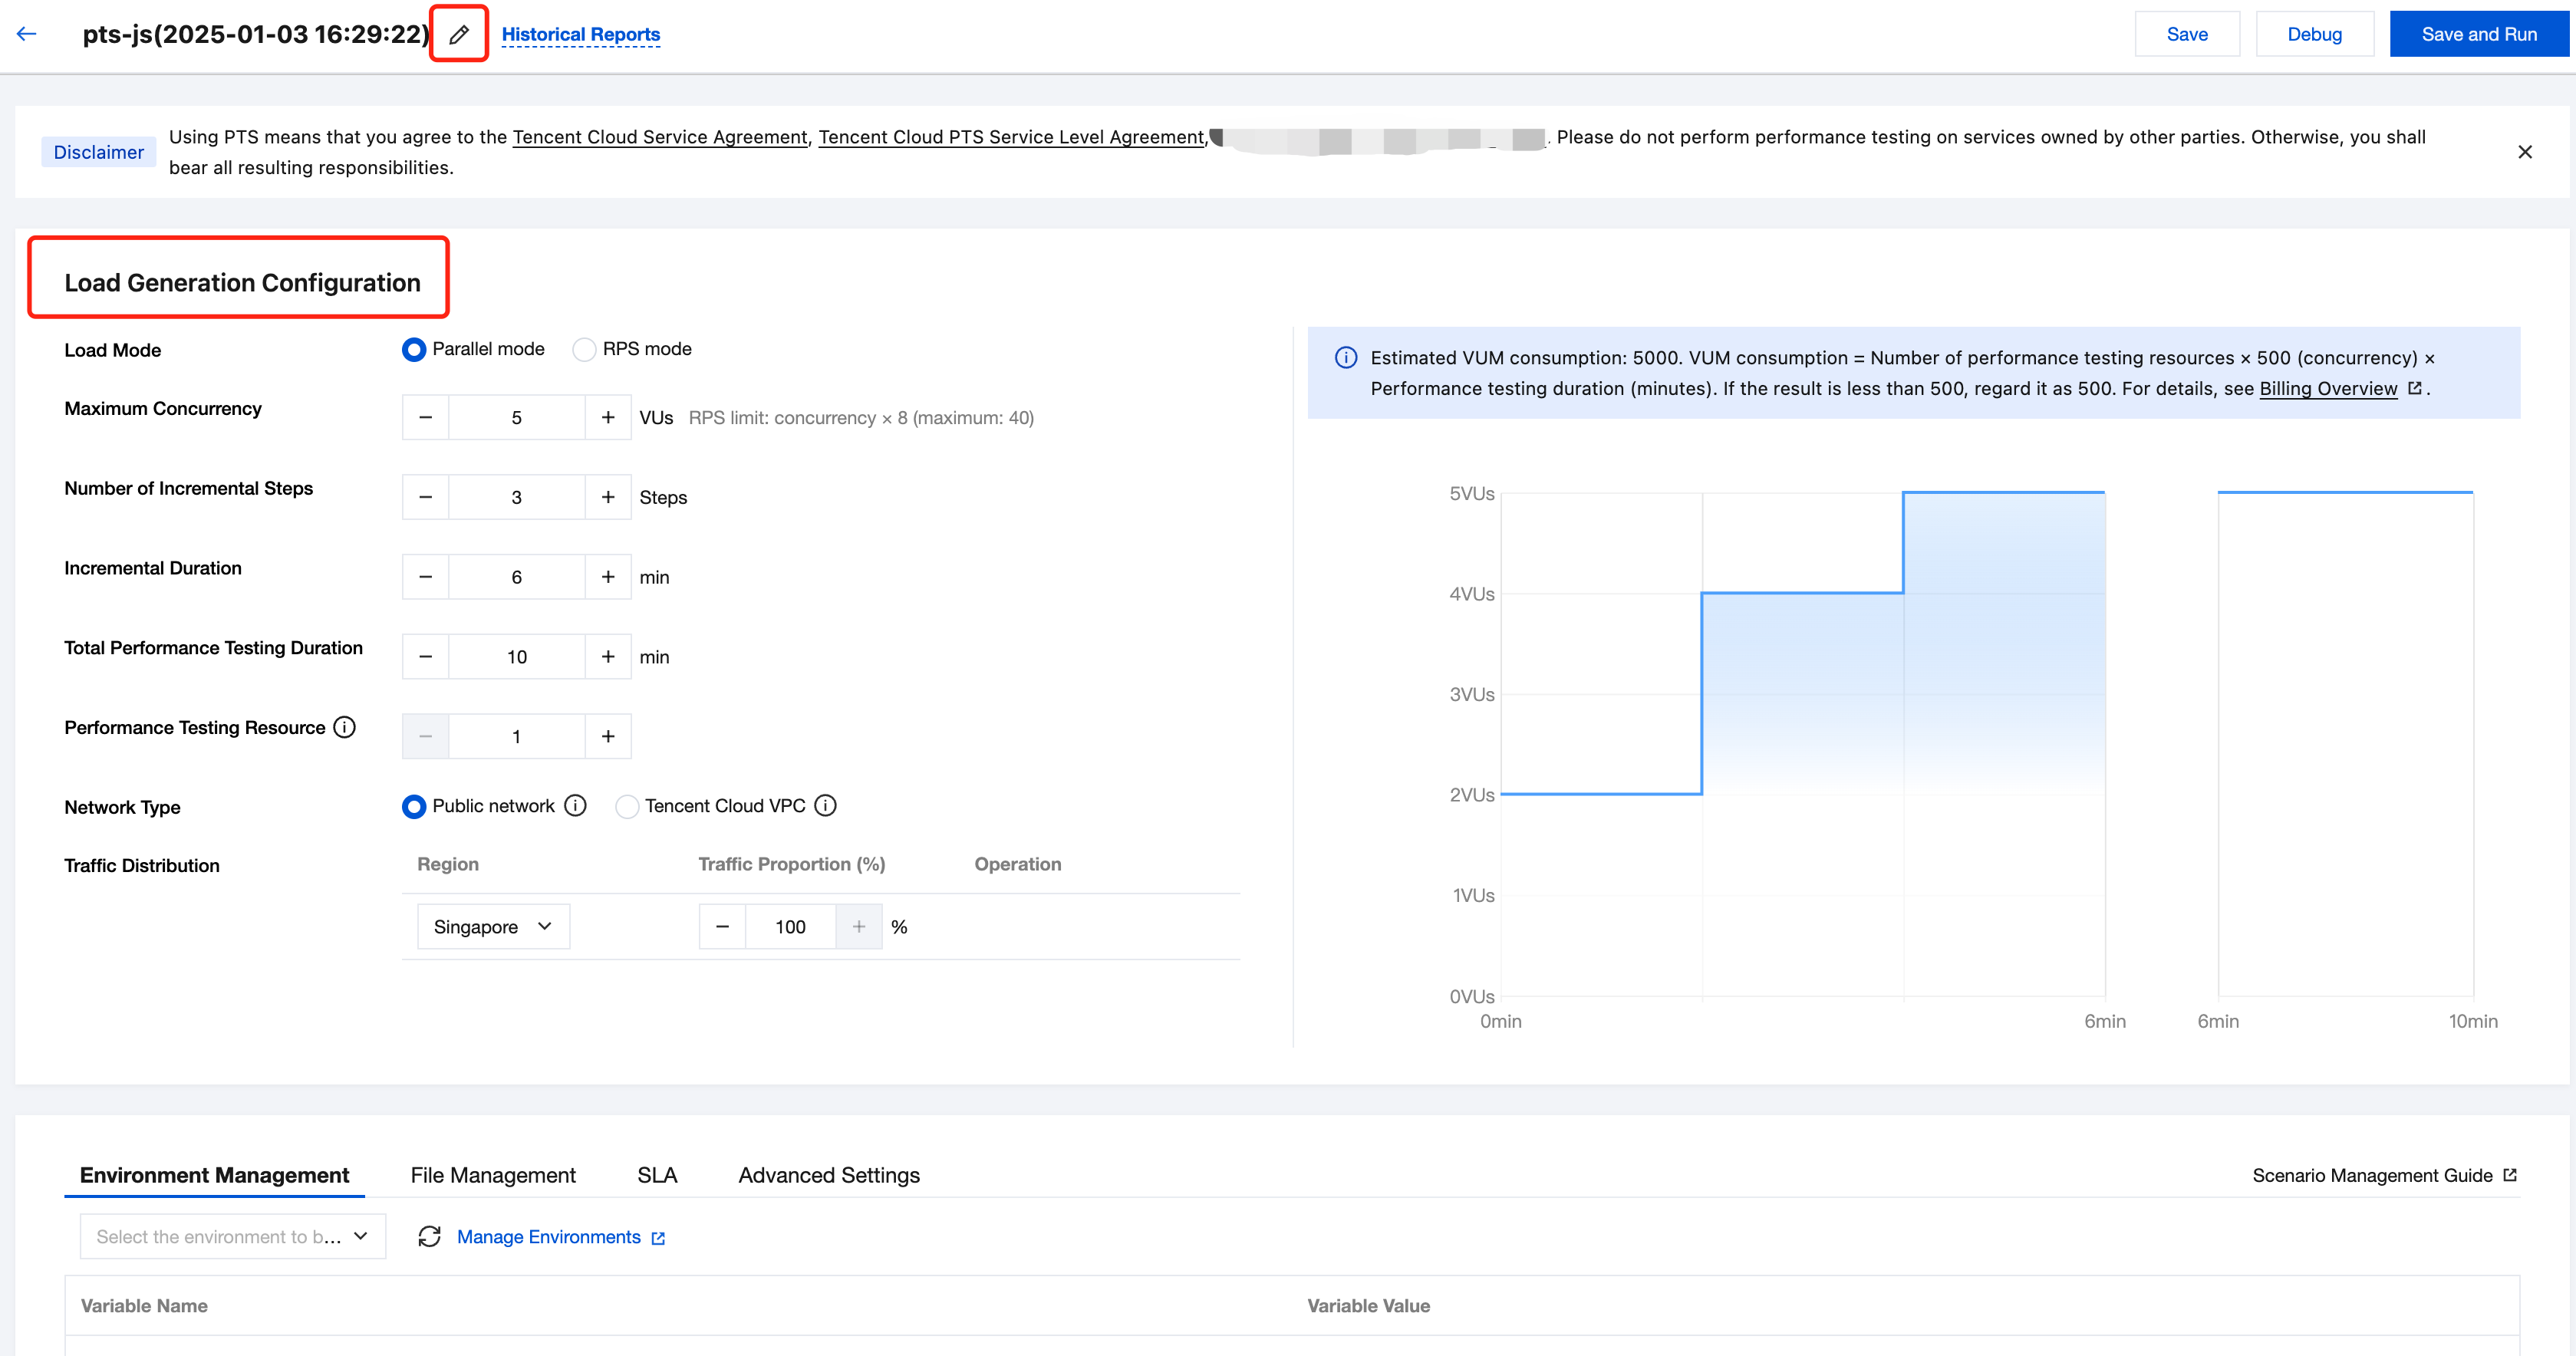
2. Orchestrate the testing scenario, complete the following settings, and then click Save and Run. The created testing scenario is ready to run by default.
The functional modules are described in the following table:
Functional Module
Description
Scenario name
Update the scenario name to facilitate identifying its purpose later.
Load Generation Configuration
The currently supported pressure models: Concurrent pressure mode (virtual user mode) and RPS pressure mode.
Parallel mode (virtual user mode): Concurrent refers to the number of virtual concurrent users. From a business perspective, it can also be understood as the number of users online simultaneously.
RPS mode: Requests per second (RPS), used to measure the throughput of the server. This mode eliminates the complexity of converting concurrent users to RPS, helping users better identify performance bottlenecks.
Concurrent Mode Configuration
Maximum Concurrency: Represents the number of users online simultaneously for the service under pressure.
Number of Incremental Steps: The number of stages by which concurrent pressure increases.
Incremental Duration: The duration for which the pressure increases.
Total Performance Testing Duration: The overall duration of the performance test.
Performance Testing Resource:
A performance testing resource provides 500 concurrent users by default, along with the corresponding underlying resources;
If CPU, memory, or inbound/outbound bandwidth reaches its upper limit, additional performance testing resources can be allocated to increase the CPU, memory, and inbound/outbound bandwidth available for the task;
An increase in the number of performance testing resources will result in higher billing. Billing concurrency = Number of performance testing resources x 500.
Network Type: The general network supports public network access.
Traffic Distribution: Select the pressure traffic ratio for different regions.
RPS Mode Configuration
Maximum RPS: The upper limit of RPS for the performance testing, used to determine the target throughput of the business system. PTS allocates appropriate pressure resources for the performance testing task based on the maximum RPS.
Start RPS: The initial RPS for the performance testing. Users can manually adjust the RPS during the testing process and observe changes in report metrics.
Total Performance Testing Duration: The total duration of a performance test.
Performance Testing Resource: PTS allocates resources from the testing resource pool based on the maximum RPS set by the user. If your requests have slower response times, you can expand the resource pool to ensure the target throughput is achieved.
Traffic Distribution: Distribute the total performance testing traffic across multiple regions by a certain percentage to simulate real-world scenarios with traffic generated by users from different regions.
Scenario Orchestration
Provides common script template examples.
Supports features such as syntax highlighting, intelligent prompts, function references, and code formatting.
Right-click within the JS orchestration area for additional features. For more JS syntax and code examples, see Script Mode Performance Testing.
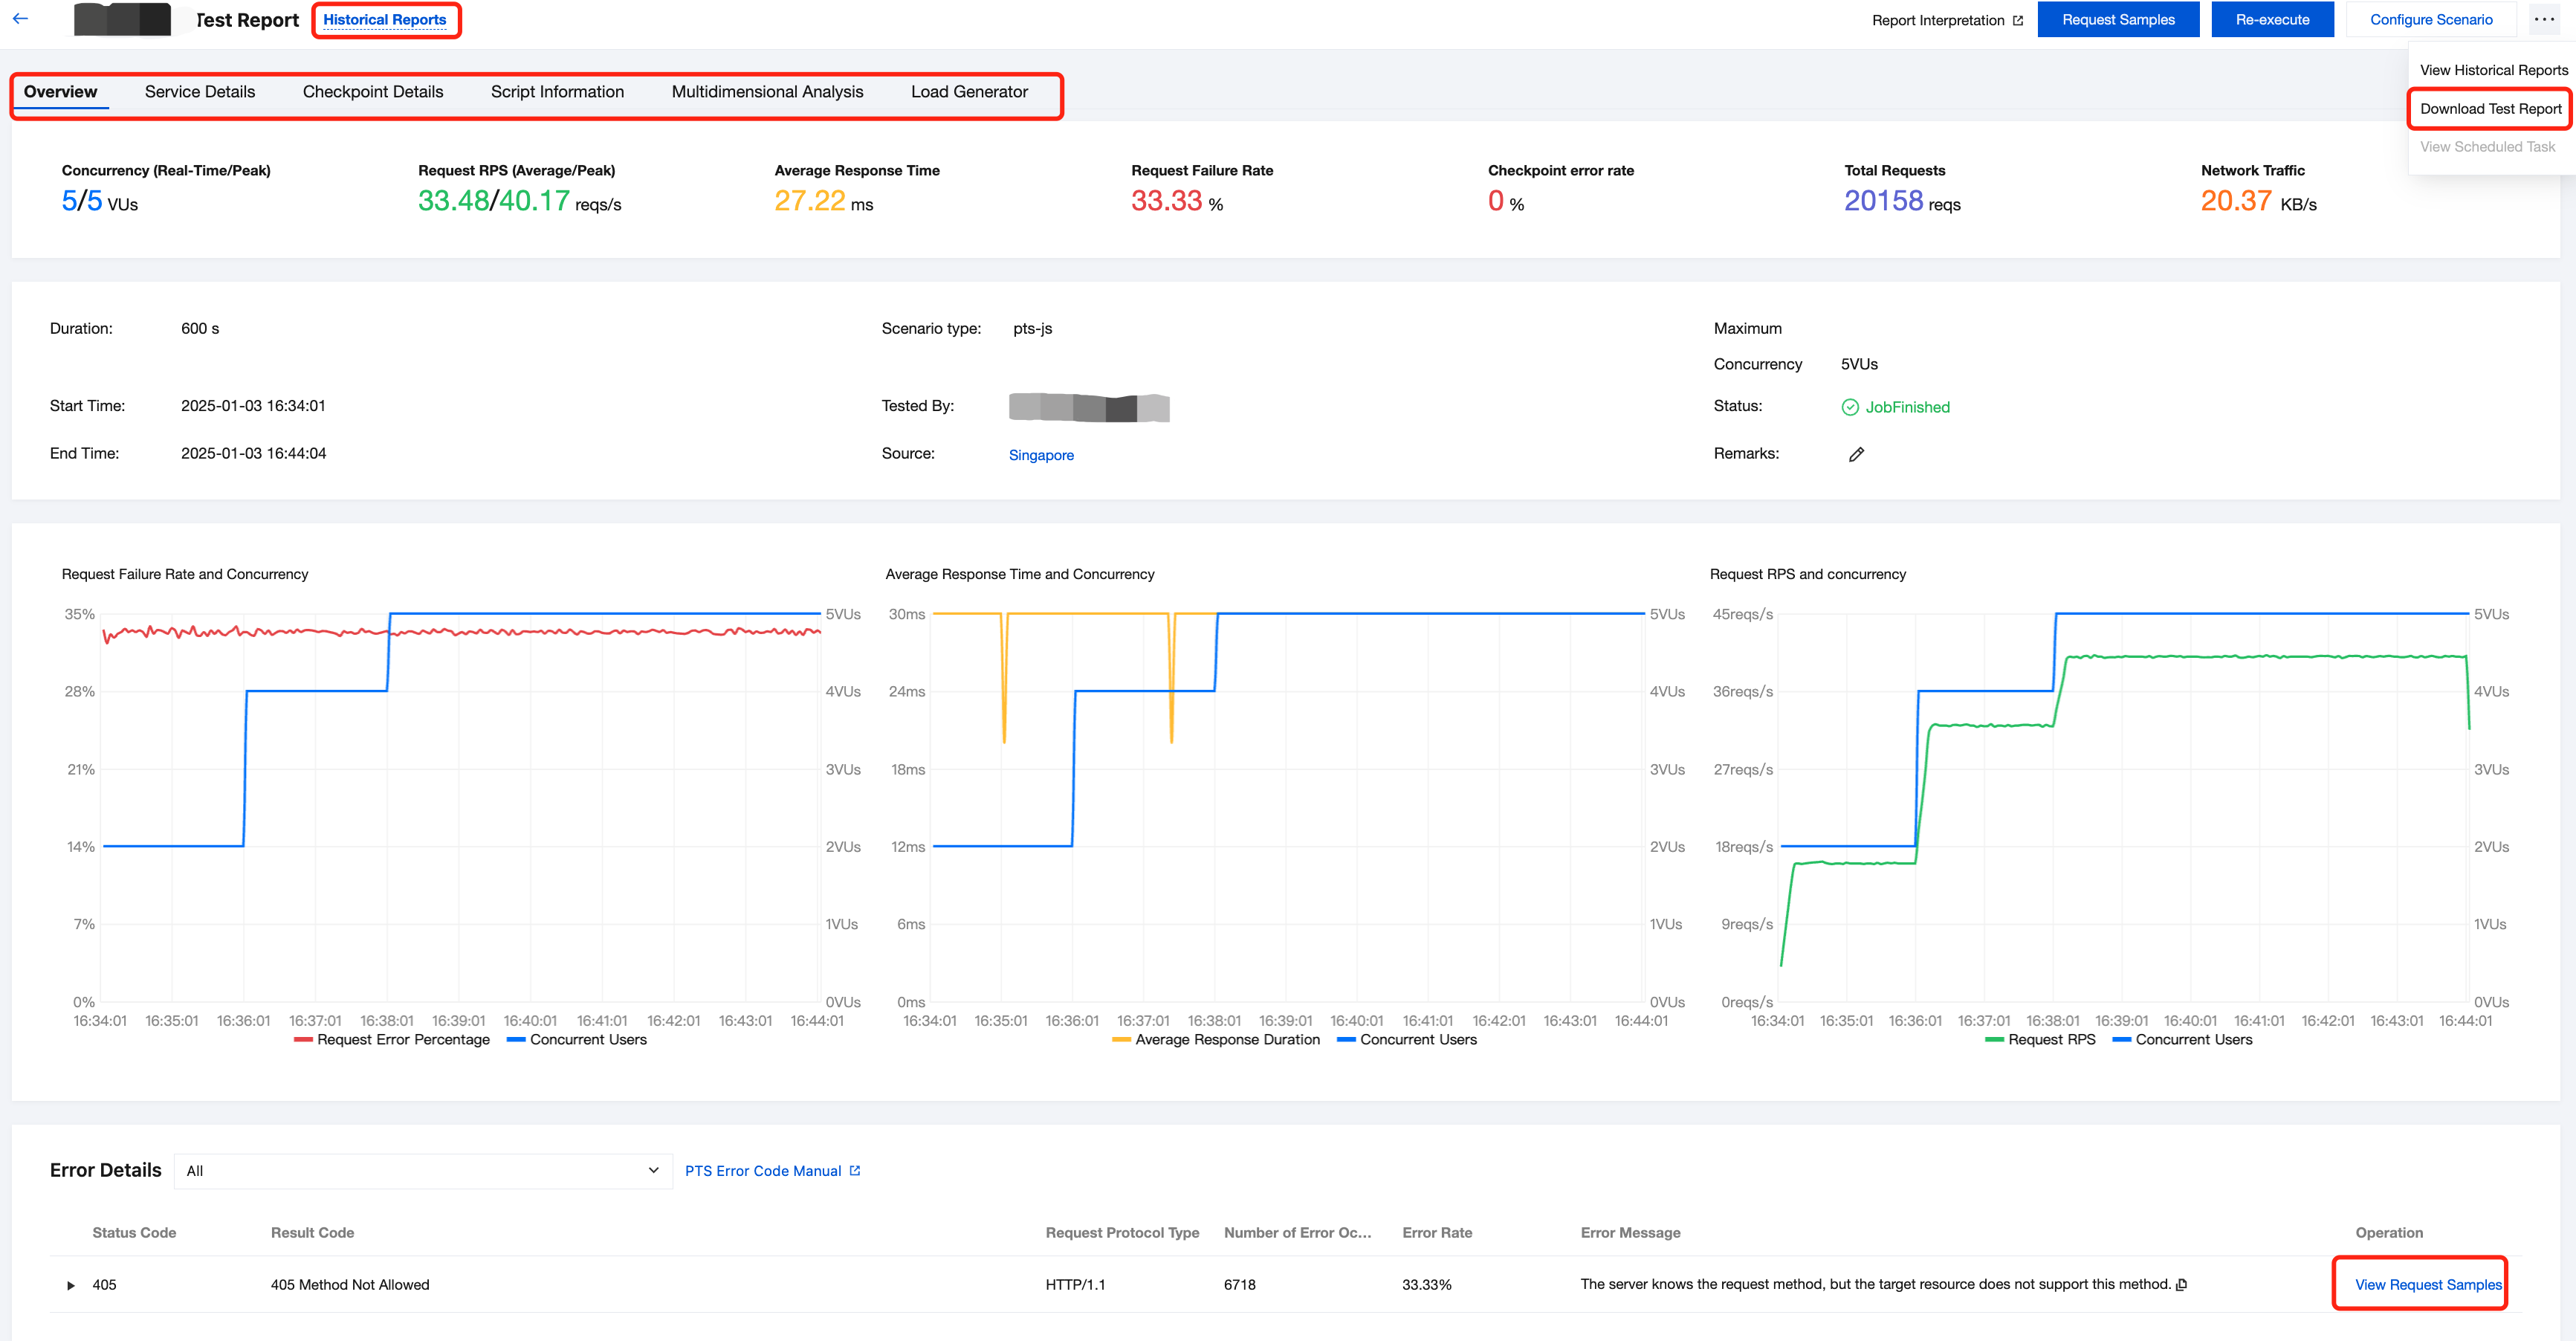
Step 3: Viewing Performance Testing Report
After you click Save and Run, PTS will initiate the performance testing engine. The console will redirect to the pressure report interface.
Once the performance testing report is generated, you can click the test scenario name in the sidebar to view or download historical reports. In the error details list, you can also click Request Samples to check the sampled information for error requests.