tencent cloud

Tencent Cloud Observability Platform

Release Notes and Announcements
Release Notes
Product Introduction
Overview
Strengths
Basic Features
Basic Concepts
Use Cases
Use Limits
Purchase Guide
Tencent Cloud Product Monitoring
Application Performance Management
Mobile App Performance Monitoring
Real User Monitoring
Cloud Automated Testing
Prometheus Monitoring
Grafana
EventBridge
PTS
Quick Start
Monitoring Overview
Instance Group
Tencent Cloud Product Monitoring
Application Performance Management
Real User Monitoring
Cloud Automated Testing
Performance Testing Service
Prometheus Getting Started
Grafana
Dashboard Creation
EventBridge
Alarm Service
Cloud Product Monitoring
Tencent Cloud Service Metrics
Operation Guide
CVM Agents
Cloud Product Monitoring Integration with Grafana
Troubleshooting
Practical Tutorial
Application Performance Management
Product Introduction
Access Guide
Operation Guide
Practical Tutorial
Parameter Information
FAQs
Mobile App Performance Monitoring
Overview
Operation Guide
Access Guide
Practical Tutorial
Tencent Cloud Real User Monitoring
Product Introduction
Operation Guide
Connection Guide
FAQs
Cloud Automated Testing
Product Introduction
Operation Guide
FAQs
Performance Testing Service
Overview
Operation Guide
Practice Tutorial
JavaScript API List
FAQs
Prometheus Monitoring
Product Introduction
Access Guide
Operation Guide
Practical Tutorial
Terraform
FAQs
Grafana
Product Introduction
Operation Guide
Guide on Grafana Common Features
FAQs
Dashboard
Overview
Operation Guide
Alarm Management
Console Operation Guide
Troubleshooting
FAQs
EventBridge
Product Introduction
Operation Guide
Practical Tutorial
FAQs
Report Management
FAQs
General
Alarm Service
Concepts
Monitoring Charts
CVM Agents
Dynamic Alarm Threshold
CM Connection to Grafana
Documentation Guide
Related Agreements
Application Performance Management Service Level Agreement
APM Privacy Policy
APM Data Processing And Security Agreement
RUM Service Level Agreement
Mobile Performance Monitoring Service Level Agreement
Cloud Automated Testing Service Level Agreement
Prometheus Service Level Agreement
TCMG Service Level Agreements
PTS Service Level Agreement
PTS Use Limits
Cloud Monitor Service Level Agreement
API Documentation
History
Introduction
API Category
Making API Requests
Monitoring Data Query APIs
Alarm APIs
Legacy Alert APIs
Notification Template APIs
TMP APIs
Grafana Service APIs
Event Center APIs
TencentCloud Managed Service for Prometheus APIs
Monitoring APIs
Data Types
Error Codes
Glossary

Report Management

PDF
フォーカスモード
フォントサイズ
最終更新日: 2025-03-28 16:11:38

Fee Description

The reporting feature is under public beta and free during the public beta period. Fees will be charged after the public beta period ends. The specific billing mode and billing time will be notified to you one month in advance via channels such as SMS, mail, and message center.
After creating a report task, you can receive reports via email, SMS, message center, etc. within a specific time.

Create Report Task

1. Log in to TCOP, and select Report Management in the left sidebar.
2. On the Report Task page, click Creating Report Task.
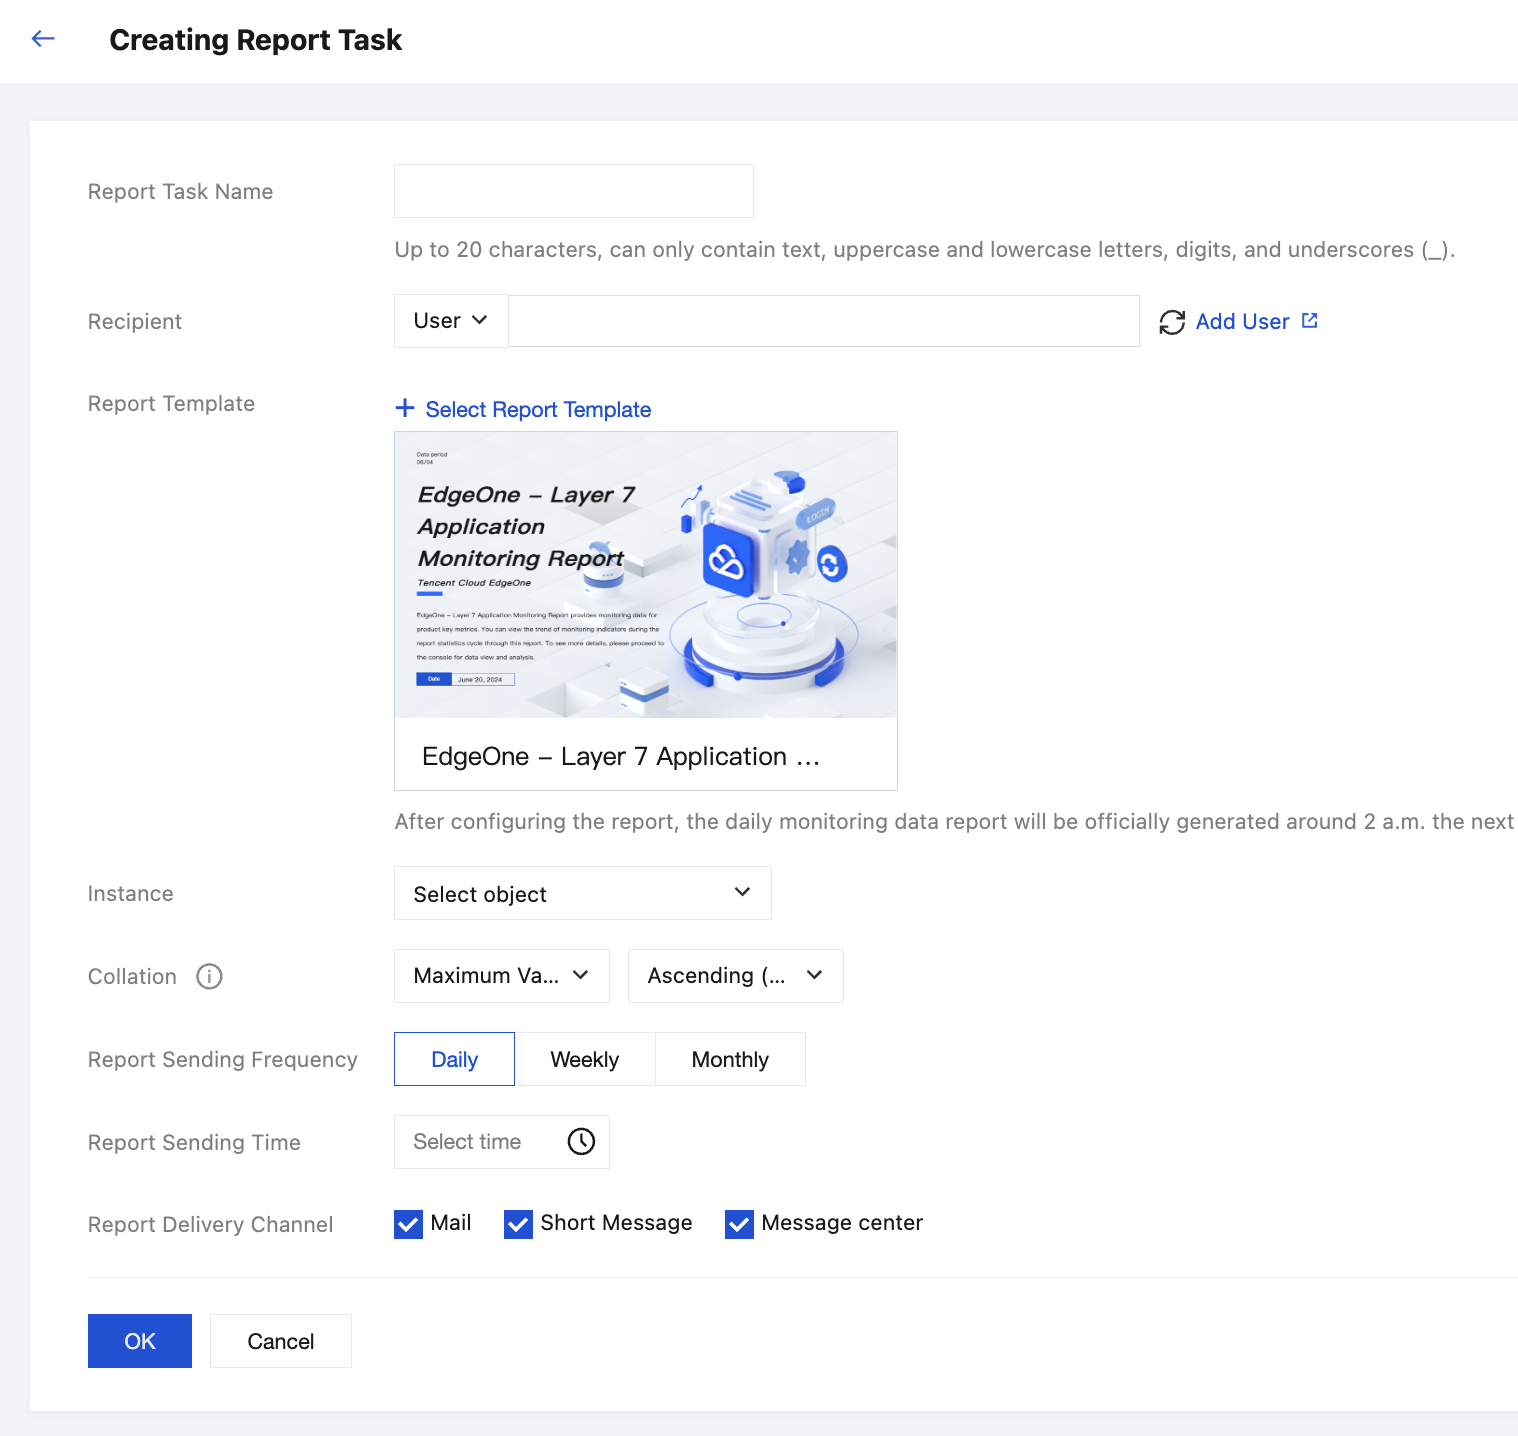
3. On the report task creation page, see the following instructions to configure the information of the report task.
Report Task Name: 20 characters at most, can only contain text, upper- and lower-case letters, digits, and underline ("_").
Recipient: Select user/user group. Need to pay attention to whether the receiving method information of the recipient is complete. If not complete, it will impact the report reception via related channels.
Report Template: After selecting a report template, you need to continue selecting the content sent corresponding to the template below. For example: After selecting an EdgeOne report template, you need to select an EdgeOne instance.
Report Sending Frequency: If weekly is selected, the report will be sent every Monday.
Report Sending Time: There may be a delay in generating daily/weekly reports. They will be generated around 2 am every day/every Monday. To avoid report sending failures, it is recommended to choose a sending time after 2 am.
Report Delivery Channel: To ensure that the reports can be normally received via the report delivery channels you selected, you check whether the recipient's channel information is complete.
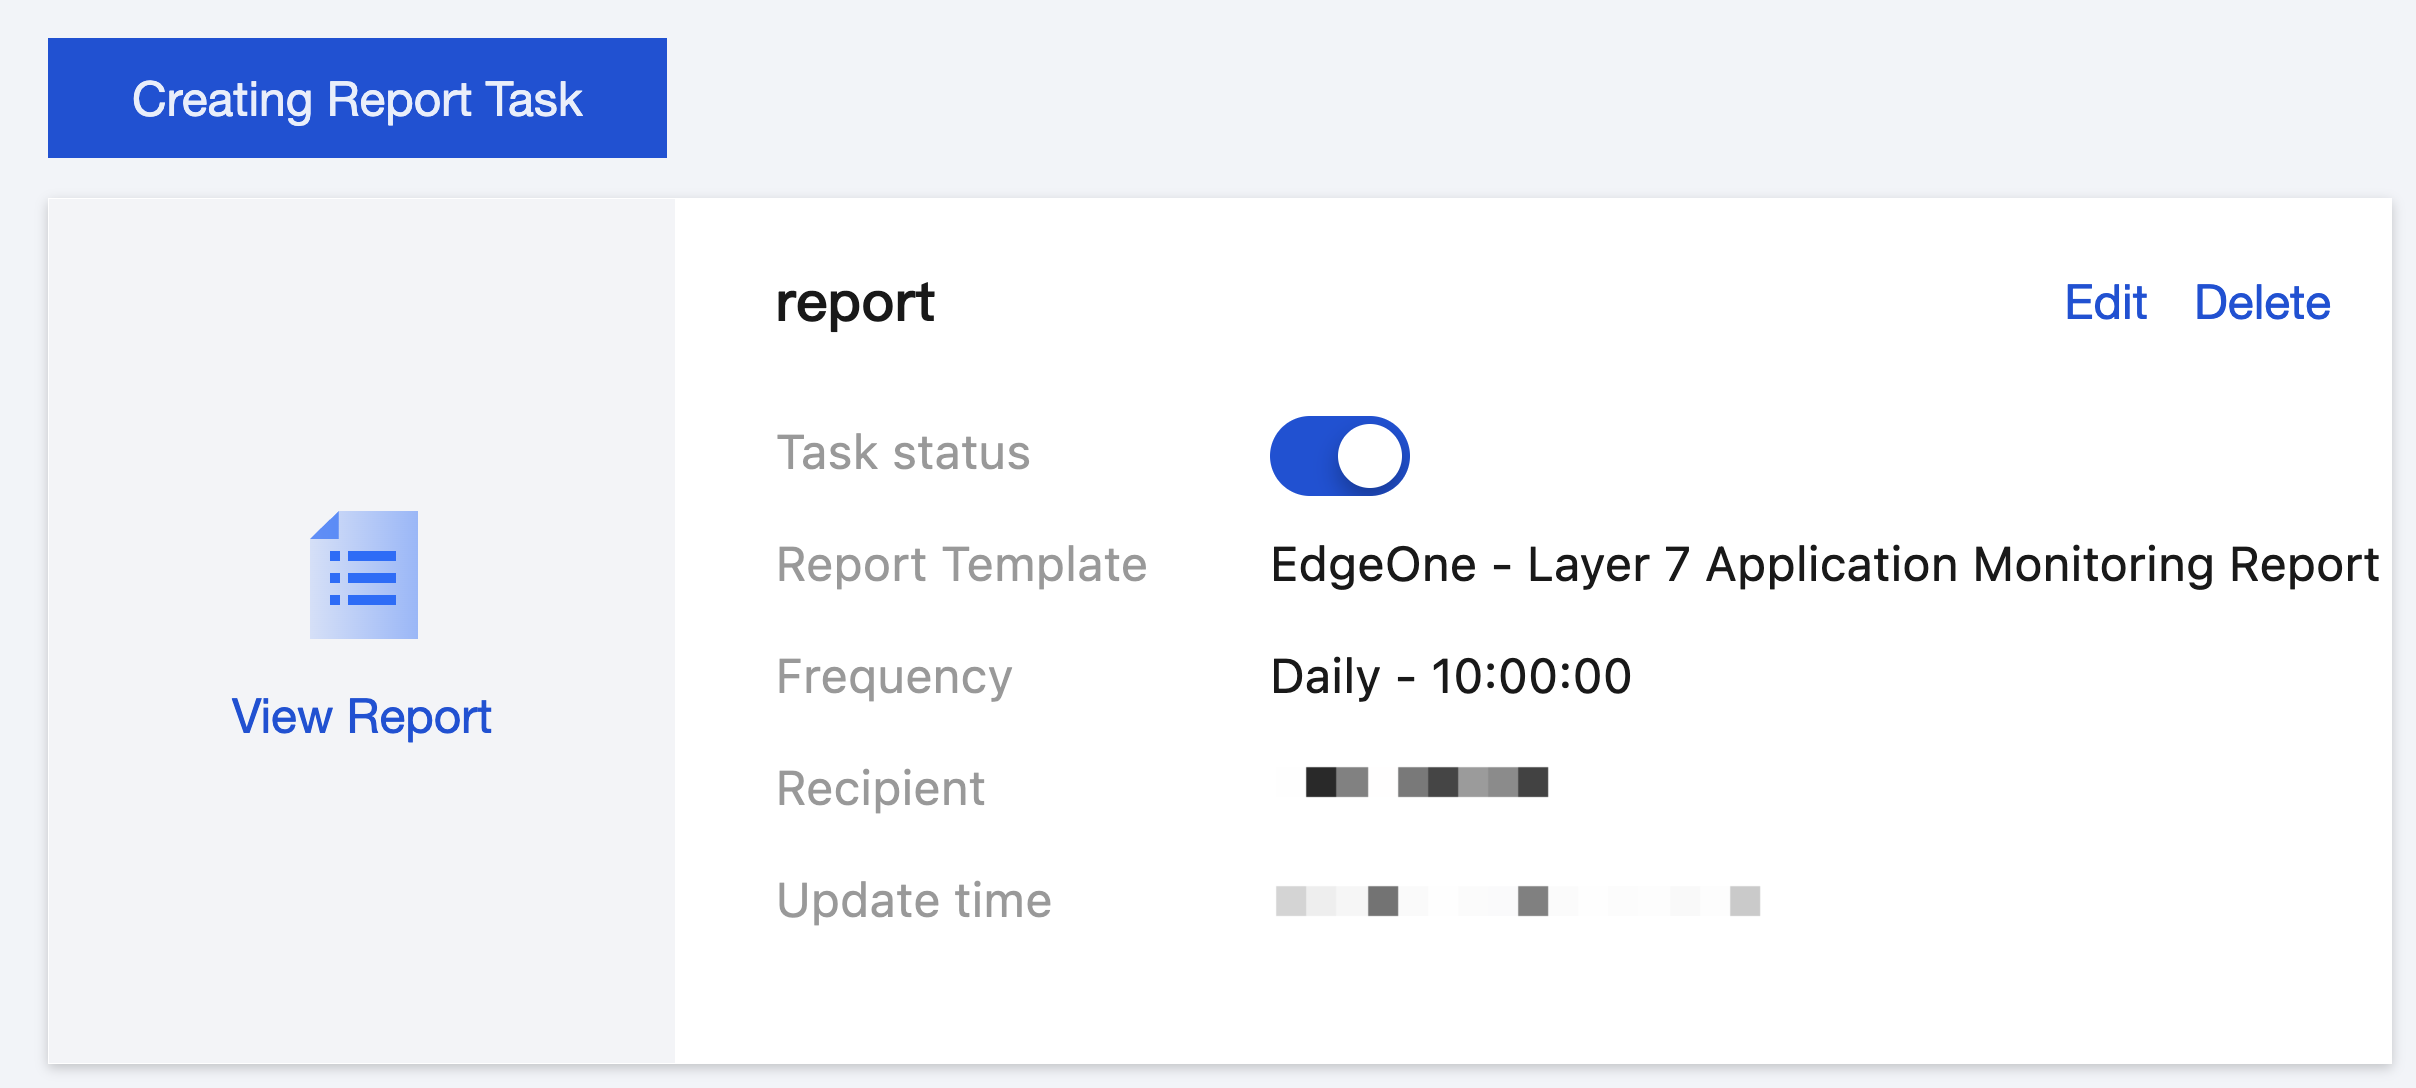

View Report Task

1. click View Report to download and view historical reports. You can still view the previously generated historical reports within the validity period of table storage after closing the task.
2. Click Delete. All report tasks and historical reports generated under the report task will be deleted and cannot be recovered.


Introduction to Report Templates

Note:
The currently available report templates contain only "system preset templates". Various preset templates will be added here subsequently.
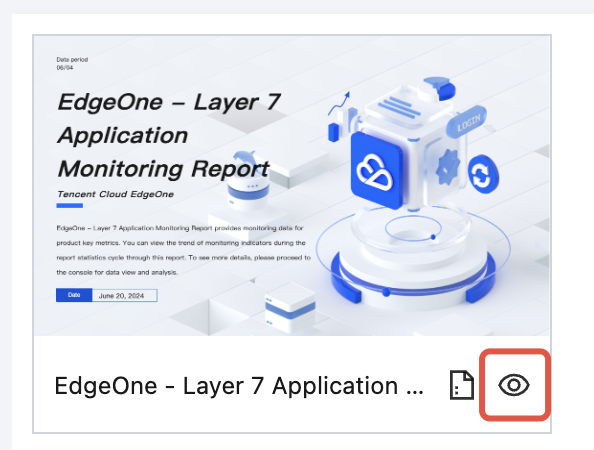
You may click the Preview icon in the report template to view an example report.

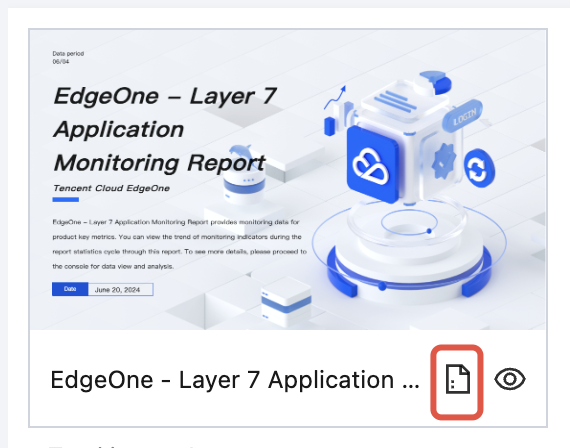
You can also click the report icon to create a report task.


ヘルプとサポート

この記事はお役に立ちましたか?

フィードバック