Slow Query Analysis

最終更新日:2025-07-22 20:25:30
Feature Description
Note:
Note: TencentDB for PostgreSQL supports slow SQL details and abstracted SQL statistics, both of which support downloading. Just click to download on the corresponding webpage.
The default database considers SQL statement queries exceeding 1s as "slow queries", and the corresponding statements are called "slow query statements" (commonly known as "slow SQL"). The process where a database administrator (DBA) analyzes slow query statements and finds out the reasons for slow query occurrence is called "slow query analysis".
Log in to the TencentDB for PostgreSQL console, click the Instance ID or Operation column's Manage, enter instance details, then click Performance Optimization on the instance management page. In the Slow Query Analysis module, you can view the slow query analysis provided by the system. As shown in the figure below:
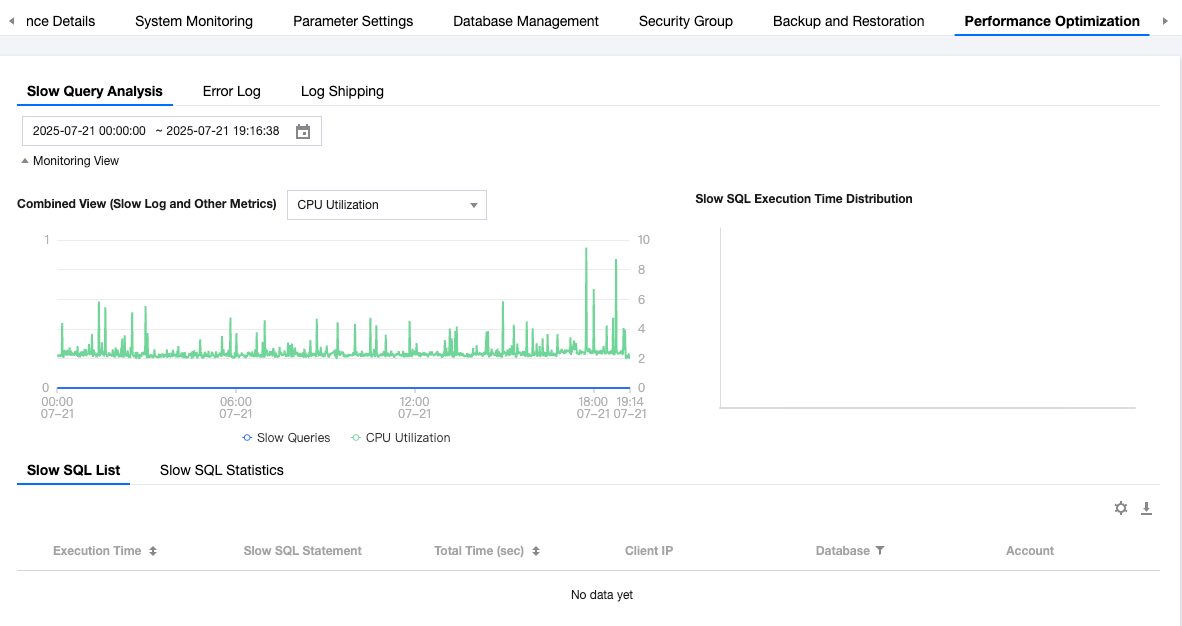
Monitoring View
The two charts in the console provide a monitoring view, offering an intuitive way to view slow SQL information.
Slow query and other monitoring combined view: Support through charting format to view slow query metrics as well as the ability to compare with other metrics. Supported metrics include: CPU usage, QPS, request count, read request count, number of write requests, other requests, buffer cache hit rate, and average execution latency.
Slow SQL duration distribution: View slow queries through different time periods to see the main time period distribution.
Slow SQL List
The slow SQL list displays the generated slow SQL statements in real time. The list is sorted in descending order by time, with newly generated slow SQL automatically displayed on the first line.
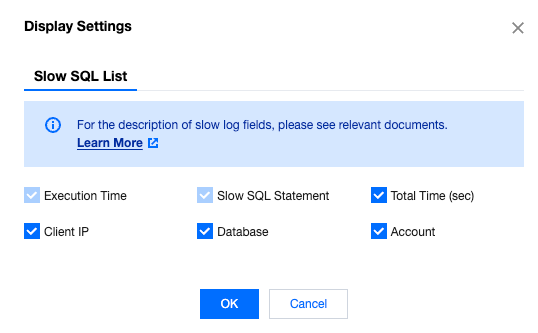
Supported fields for viewing slow SQL: execution time, slow SQL statement, total time (seconds), client IP address, database, account. The explanation of each field is as follows:
Execution Time
Slow SQL statements: Detailed slow log SQL statements recorded.
Total time (seconds): The occupied time of executing this slow log SQL statement.
Client IP: Which clients the statement was executed on.
Database: Which database the PromQL statement called.
Account: Which user the statement was run with.
Note:
- The slow SQL list saves slow SQL data from the most recent 7 days and a maximum log volume of 50GiB by default. When either condition is met, logs exceeding the requirement are automatically deleted.
- If a single slow SQL exceeds 1 MB, you will not be able to view it in the console. Please submit a ticket to contact Tencent Cloud for assistance.
Slow SQL Statistical Analysis
Slow SQL statistical analysis can aggregate and analyze the same type of SQL based on abstract parameters obtained from ALL slow SQL over a specified time period. It includes multiple field info.
Last execution time: The time when the abstract statement last occurred within the statistical scope. Since specific statements may take extended time to execute, we unify the records by the begin_time of statement execution.
Abstracted SQL statement: The statement after removing constants from slow SQL. Abstracted statements can summarize similar statements of the same nature for better analysis.
Database: Which database the statement called.
Account: Which user the statement was run with.
Client IP address: Which clients the statement was executed on.
First execution time: The first occurrence of the slow SQL within the statistical scope (after abstraction, there may be multiple records).
Total execution time (seconds): The total time consumed by slow query statements within the statistical scope.
Average execution time (seconds): The average time of total time of slow query statements divided by total counts.
Minimum execution time (seconds): The minimum time among all slow query statements in this abstract statement; used to help judge whether this statement is sporadic.
Maximum execution time (seconds): The maximum time among all slow query statements in this abstract statement; used to help judge whether this statement is sporadic.
Total time percentage: The percentage of time consumed by slow query statements within the statistical scope.
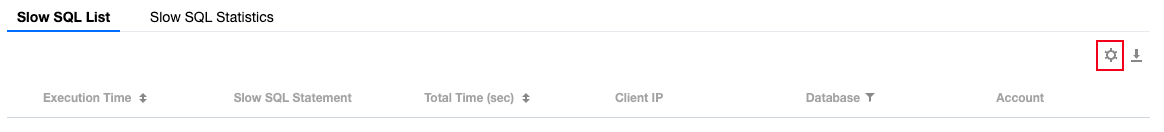
Based on your needs, you can customize the list field to show SQL statistics, as shown below:
フィードバック