製品アップデート情報
製品リリース記録
Feature Category | Metric | Type | Description |
Request analysis | workqueue_adds_total | Counter | Number of new events (Adds) processed by the workqueue. |
Request analysis | workqueue_depth | Gauge | Current depth of the workqueue. If the queue depth remains high for a long time, it indicates that the Controller cannot process tasks in the queue in time, causing a backlog of tasks. |
Request analysis | workqueue_queue_duration_seconds_bucket | Histogram | Duration for which a task remains in the workqueue. The bucket thresholds are defined as the set {10-8, 10-7, 10-6, 10-5, 10-4, 10-3, 10-2, 10-1, 1, 10}. Unit: seconds. |
Resource analysis | pod_core_usage | Gauge | CPU usage. Unit: %. |
Resource analysis | pod_mem_usage | Gauge | Memory usage. Unit: %. |
Request analysis | rest_client_requests_total | Counter | Number of HTTP requests calculated based on status codes, methods, and hosts. |
Request analysis | rest_client_request_duration_seconds_bucket | Histogram | HTTP request latency calculated based on Verbs and URLs. |
Resource analysis | container_network_receive_bytes_total | Counter | Network inbound traffic. Unit: bytes. Note: The original metric k8s_pod_network_receive_bytes_bw is charged. Map the metric name to use the free metric. |
Resource analysis | container_network_transmit_packets_total | Counter | Network outbound traffic. Unit: bytes. Note: The original metric k8s_pod_network_transmit_bytes_bw is charged. Map the metric name to use the free metric. |
Metric Display Name | Metric Name | Used Metric | Metric Description |
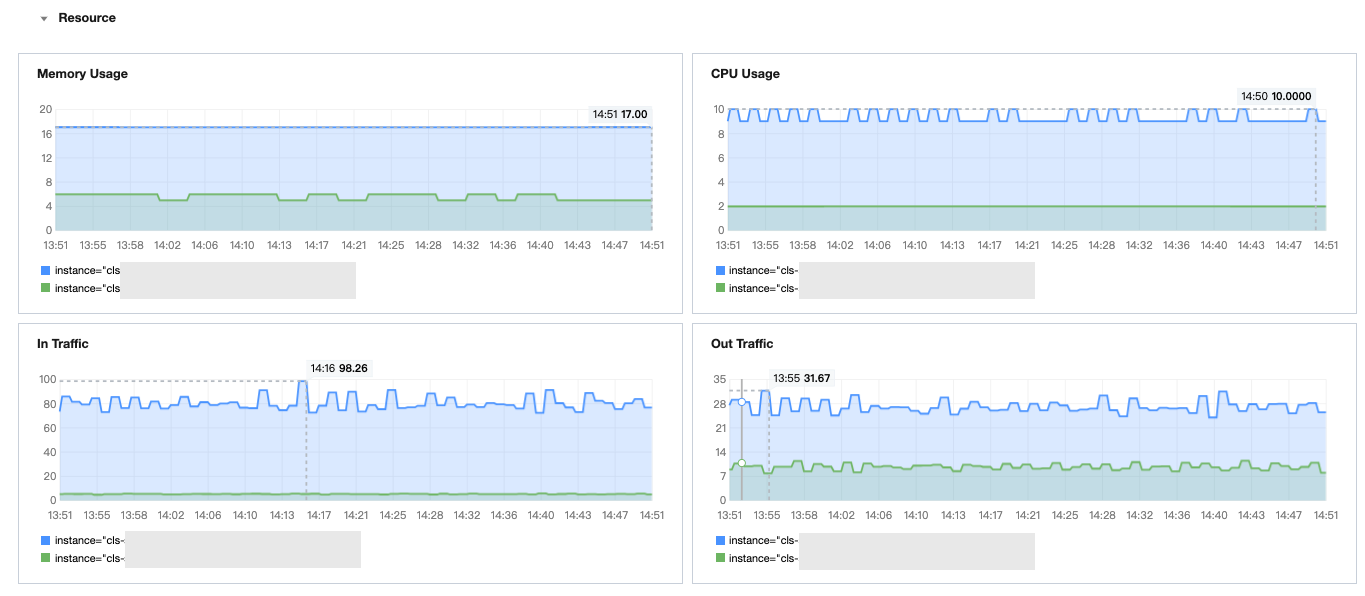
Memory Usage | Memory usage | pod_mem_usage | Memory usage of Controller Manager. Unit: %. |
Cpu Usage | CPU usage | pod_core_usage | CPU usage of Controller Manager. Unit: %. |
In Traffic | Inbound traffic | container_network_receive_bytes_total | Network inbound traffic of Controller Manager. Unit: bytes/s. |
Out Traffic | Outbound traffic | container_network_transmit_packets_total | Network outbound traffic of Controller Manager. Unit: bytes/s. |
Metric Display Name | Metric Name | Used Metric | Metric Description |
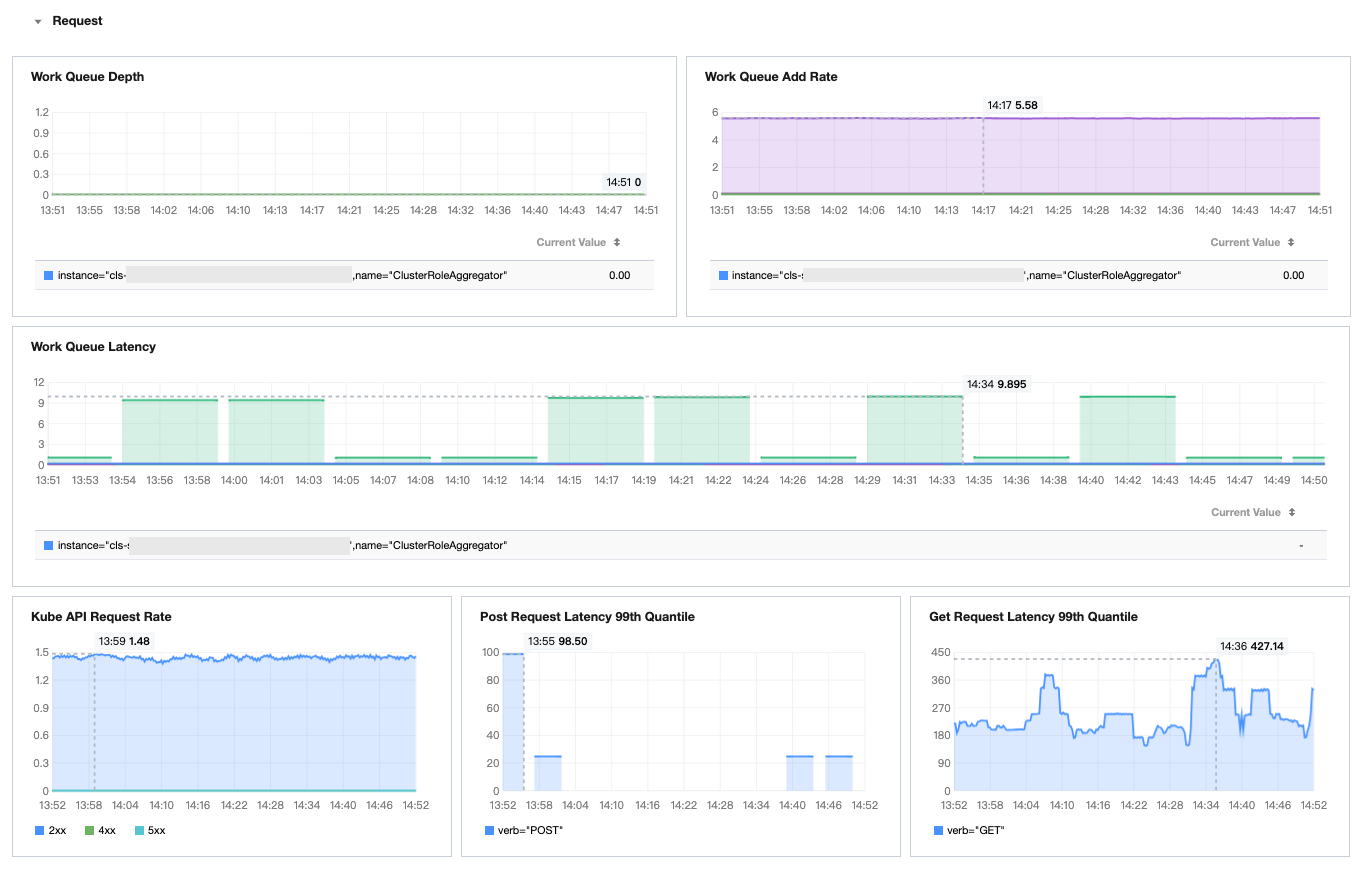
Work Queue Depth | Workqueue depth | workqueue_depth | Changes in workqueue depth per unit time. |
Work Queue Add Rate | Workqueue growth rate | workqueue_adds_total | Number of new events (Adds) in the workqueue per unit time. Unit: ops/s. |
Work Queue Latency | Workqueue latency | workqueue_queue_duration_seconds_bucket | Duration for which an event remains in the workqueue. Unit: ms. |
Kube API Request Rate | Kube API request QPS | rest_client_requests_total | Number of HTTP requests calculated based on status codes, methods, and hosts. Unit: ops/s. |
Post Request Latency 99th Quantile | POST request P99 latency | rest_client_request_duration_seconds_bucket | POST request P99 latency. Unit: ms. |
Get Request Latency 99th Quantile | GET request P99 latency | rest_client_request_duration_seconds_bucket | GET request P99 latency. Unit: ms. |
フィードバック