A funnel chart is suitable for business processes with one single flow direction and path. It collects the statistics of each stage and uses a trapezoidal area to represent the business volume difference between two stages.
Chart Configuration
General configuration
Configuration Item
Description
Basic information
Chart Name: Set the display name of the table, which can be left empty.
Legend
Set the chart legends. You can control the legend styles and positions and configure the data to be displayed as legends.
Standard configuration
Set the unit of all metric-type fields in the chart. For more information, see Unit Configuration.
Funnel chart configuration
Configuration Item
Description
Funnel chart
Display Value: Set the label display form of each stage in the funnel chart, which can be Value or Conversion rate.
Max Rendered Stages: Set the number of rendered stages in the funnel chart, which can be up to 20.
Conversion Rate: Set the calculation method of the conversion rate, which can be Percentage of the first stage or Percentage of the previous stage.
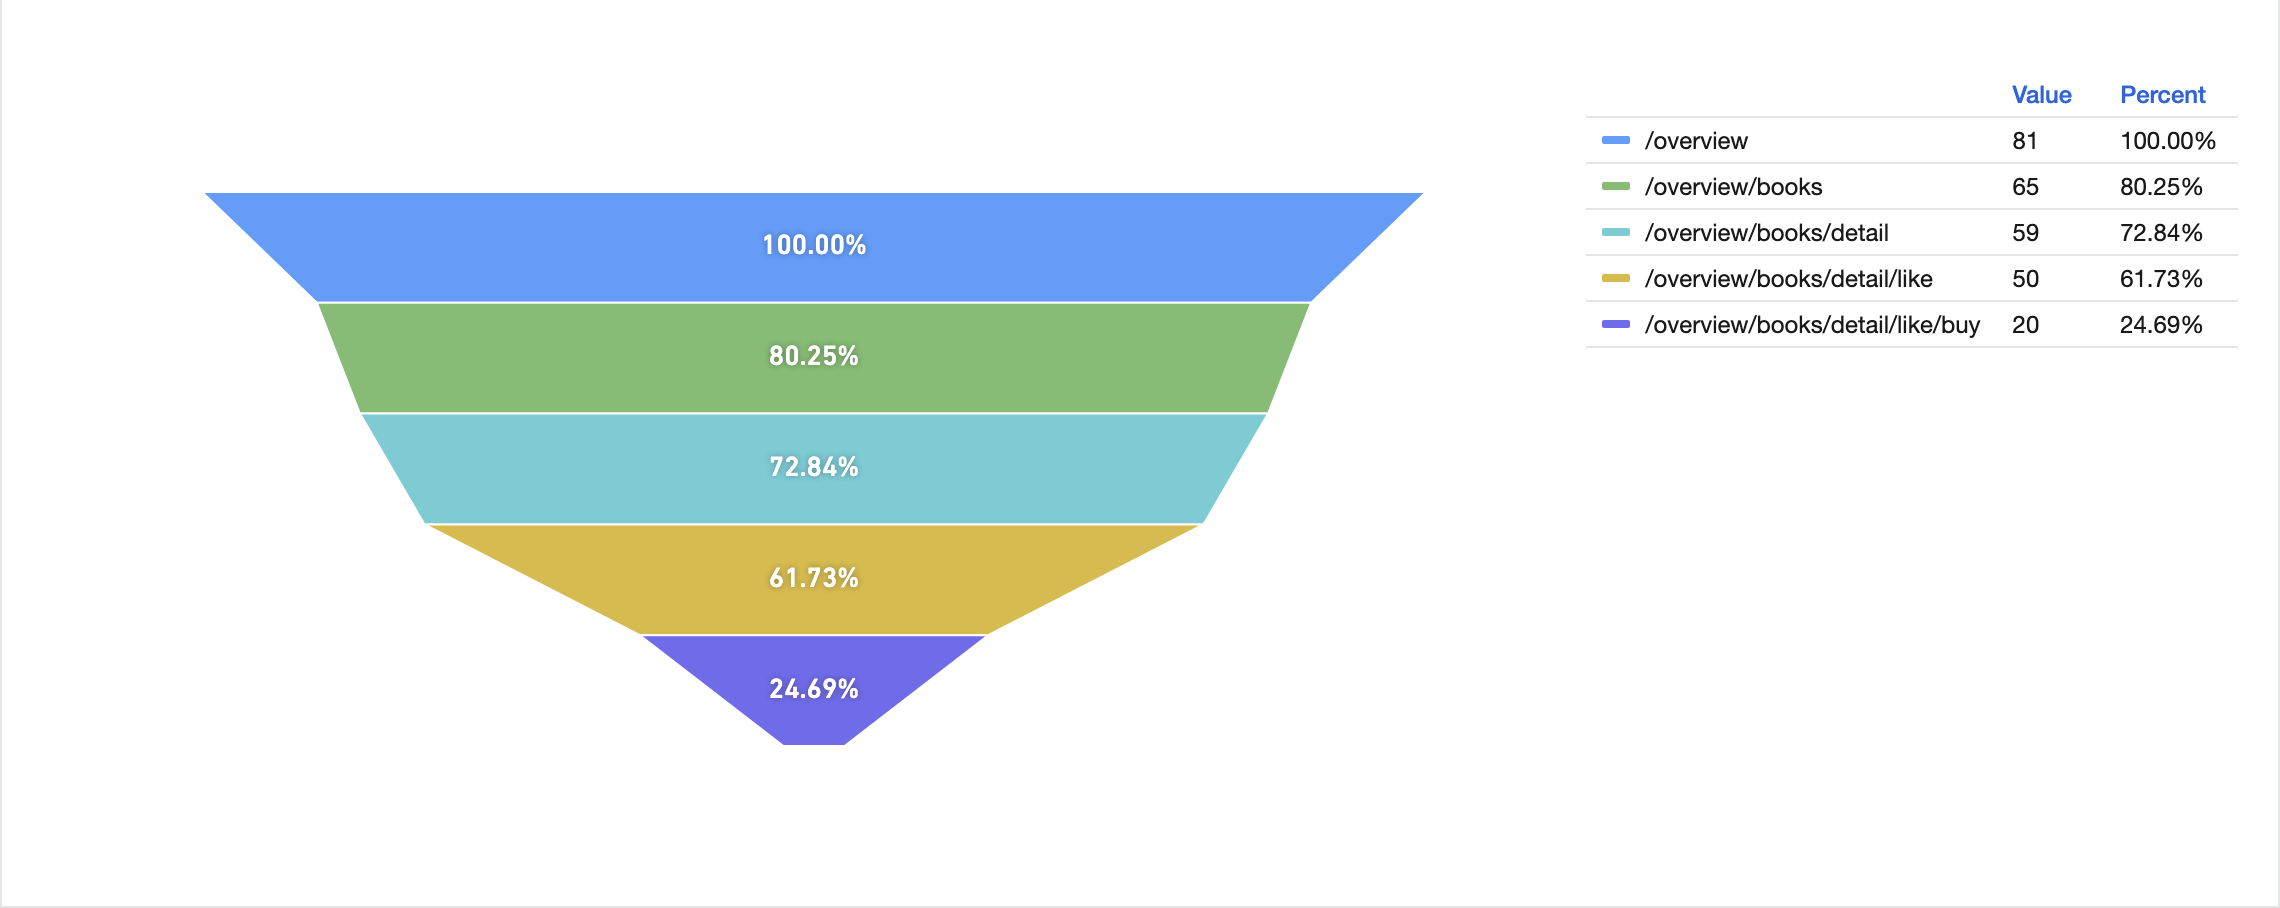
Sample funnel chart:
* |select url, count(*) as pv group by url limit 5