Accessing Log Dashboard
마지막 업데이트 시간:2024-01-04 14:34:05
Accessing Log Dashboard
마지막 업데이트 시간: 2024-01-04 14:34:05
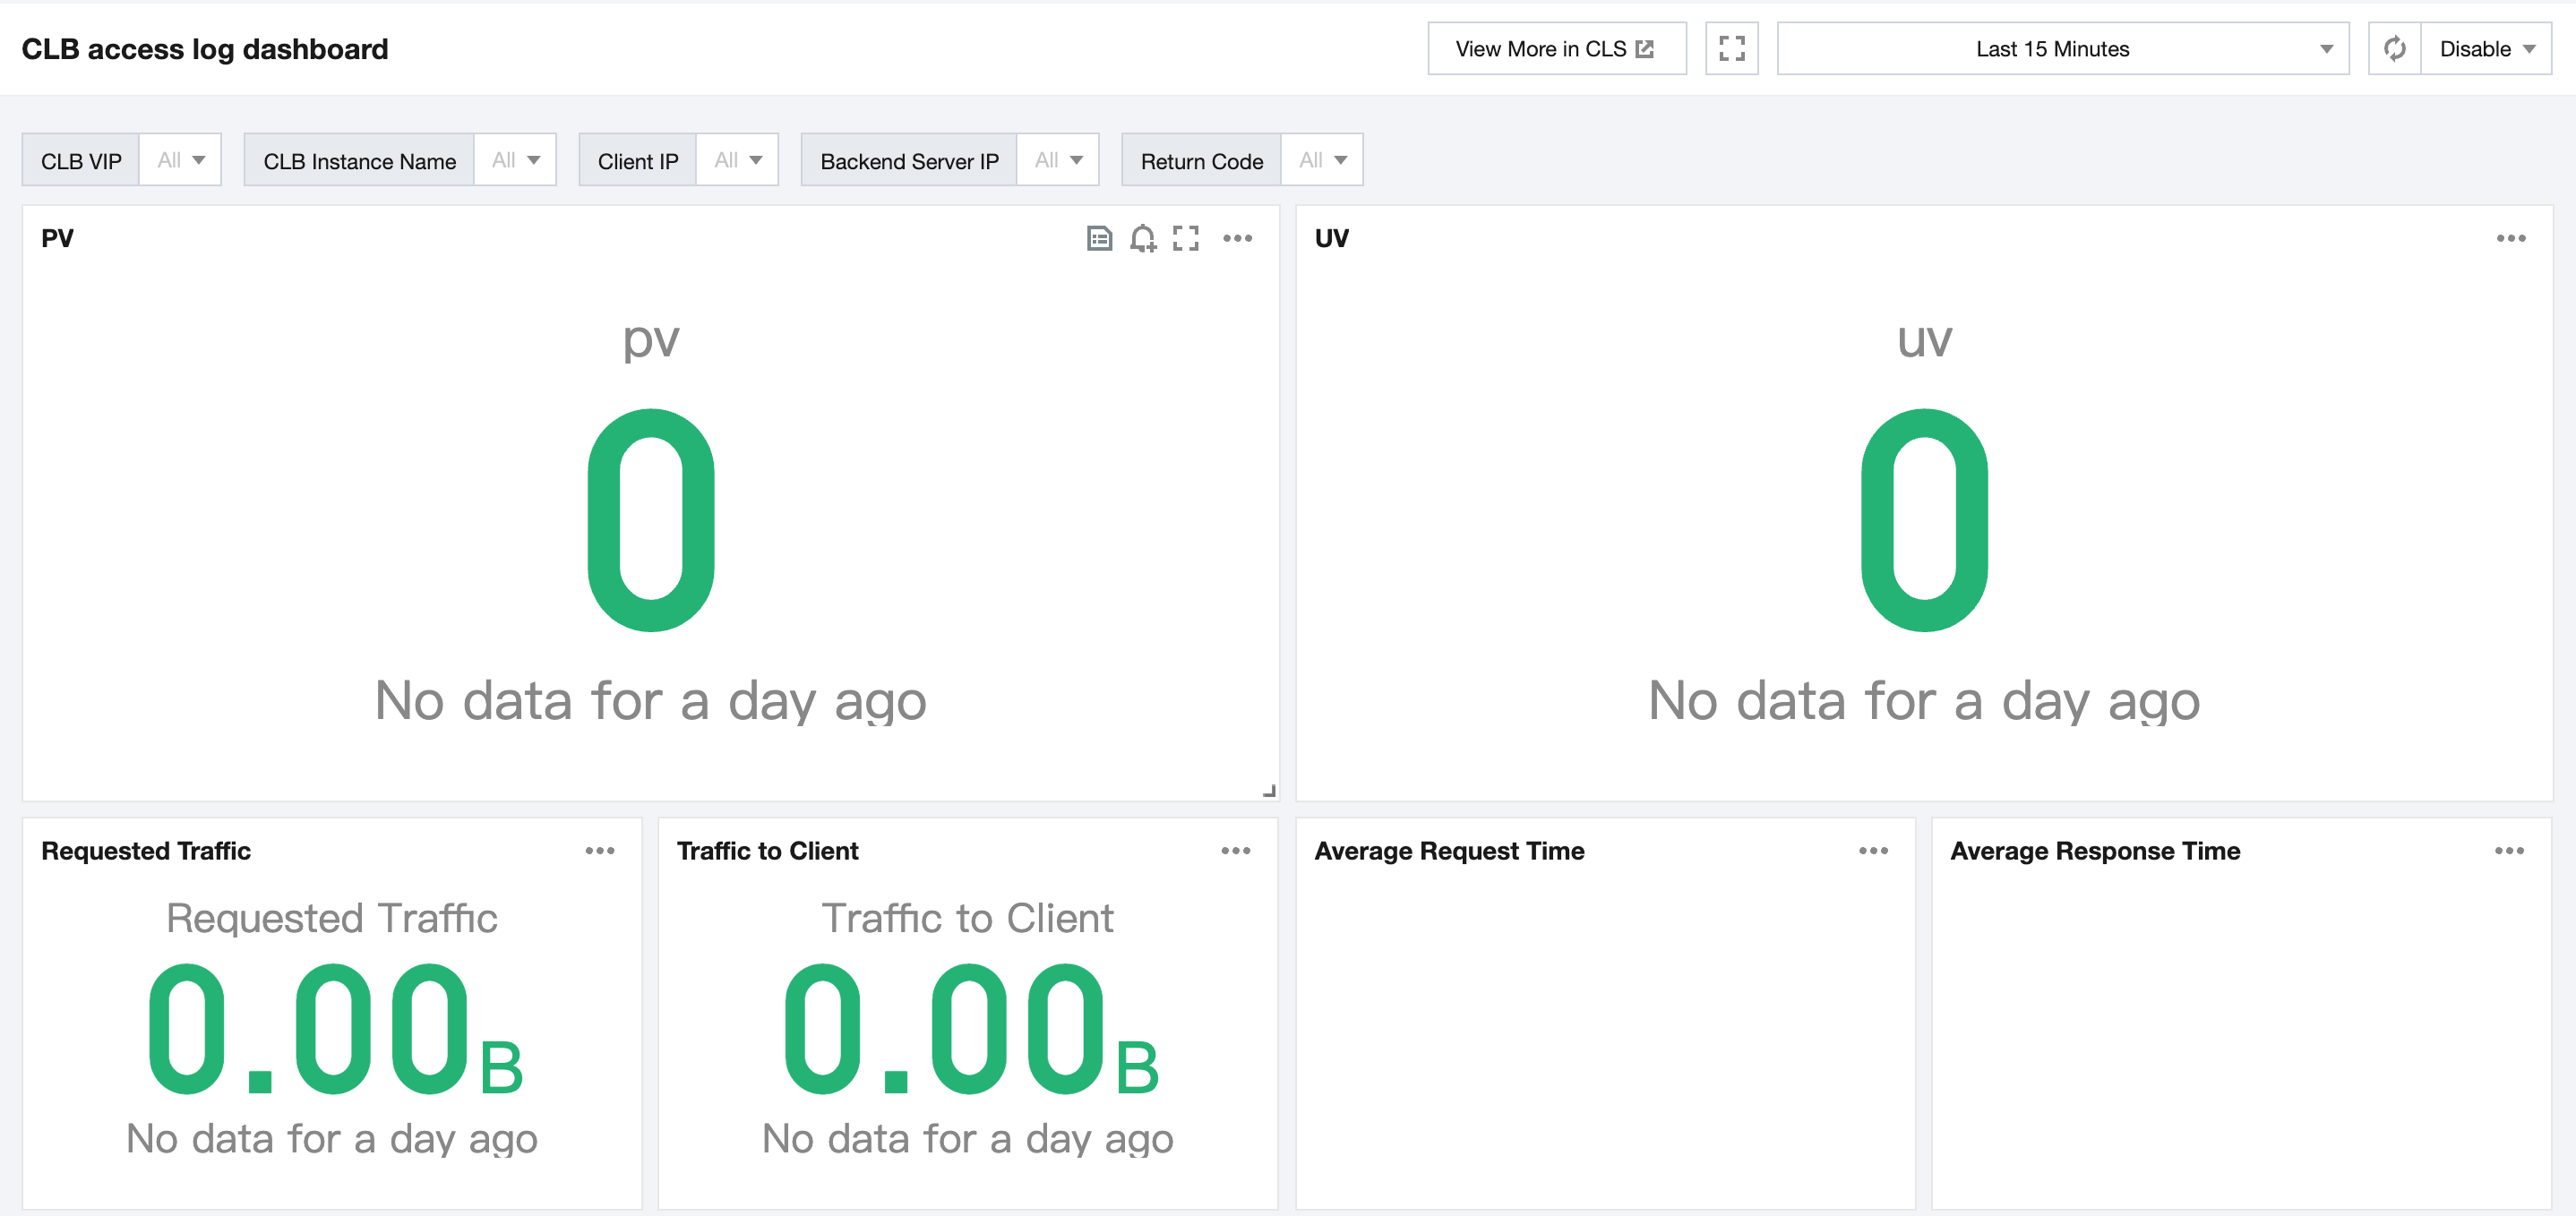
By connecting CLB access logs to Cloud Log Service, you can check the access logs in a dashboard. The dashboard provides charts of multiple metrics, giving you a full picture of the load balancer.
Dashboard
Each log topic has its own dashboard, which contains data of following metrics.
PV
UV
Outgoing request message traffic
Incoming response traffic
Average request time
Average response time
Backend status code distribution
Overall status code distribution
PV/UV trend
Outgoing/Incoming traffic trend
Average requests/responses per minute
P99, P95, P90, P50 access duration
Top requested instances
Top requested domain names
Preparations
Directions
1. Log in to the CLB console and select Access Logs on the left sidebar.
2. In the Access Log Dashboard page, select the region and log topic to see the dashboard of this log topic.
3. (Optional) In the upper corner of the Access Log Dashboard page, filter logs by the CLB VIP, client IP, backend server IP and status code.
See Also
피드백