tencent cloud

Tencent Cloud Observability Platform

Release Notes and Announcements
Release Notes
Product Introduction
Overview
Strengths
Basic Features
Basic Concepts
Use Cases
Use Limits
Purchase Guide
Tencent Cloud Product Monitoring
Application Performance Management
Mobile App Performance Monitoring
Real User Monitoring
Cloud Automated Testing
Prometheus Monitoring
Grafana
EventBridge
PTS
Quick Start
Monitoring Overview
Instance Group
Tencent Cloud Product Monitoring
Application Performance Management
Real User Monitoring
Cloud Automated Testing
Performance Testing Service
Prometheus Getting Started
Grafana
Dashboard Creation
EventBridge
Alarm Service
Cloud Product Monitoring
Tencent Cloud Service Metrics
Operation Guide
CVM Agents
Cloud Product Monitoring Integration with Grafana
Troubleshooting
Practical Tutorial
Application Performance Management
Product Introduction
Access Guide
Operation Guide
Practical Tutorial
Parameter Information
FAQs
Mobile App Performance Monitoring
Overview
Operation Guide
Access Guide
Practical Tutorial
Tencent Cloud Real User Monitoring
Product Introduction
Operation Guide
Connection Guide
FAQs
Cloud Automated Testing
Product Introduction
Operation Guide
FAQs
Performance Testing Service
Overview
Operation Guide
Practice Tutorial
JavaScript API List
FAQs
Prometheus Monitoring
Product Introduction
Access Guide
Operation Guide
Practical Tutorial
Terraform
FAQs
Grafana
Product Introduction
Operation Guide
Guide on Grafana Common Features
FAQs
Dashboard
Overview
Operation Guide
Alarm Management
Console Operation Guide
Troubleshooting
FAQs
EventBridge
Product Introduction
Operation Guide
Practical Tutorial
FAQs
Report Management
FAQs
General
Alarm Service
Concepts
Monitoring Charts
CVM Agents
Dynamic Alarm Threshold
CM Connection to Grafana
Documentation Guide
Related Agreements
Application Performance Management Service Level Agreement
APM Privacy Policy
APM Data Processing And Security Agreement
RUM Service Level Agreement
Mobile Performance Monitoring Service Level Agreement
Cloud Automated Testing Service Level Agreement
Prometheus Service Level Agreement
TCMG Service Level Agreements
PTS Service Level Agreement
PTS Use Limits
Cloud Monitor Service Level Agreement
API Documentation
History
Introduction
API Category
Making API Requests
Monitoring Data Query APIs
Alarm APIs
Legacy Alert APIs
Notification Template APIs
TMP APIs
Grafana Service APIs
Event Center APIs
TencentCloud Managed Service for Prometheus APIs
Monitoring APIs
Data Types
Error Codes
Glossary

Conducting WebSocket-based Performance Testing by Using JMeter

PDF
聚焦模式
字号
最后更新时间: 2025-03-10 22:14:21
This document introduces how to use JMeter to conduct WebSocket-based performance testing by introducing plugins.

Background

WebSocket is a common network communication protocol, and with the popularity of real-time web applications, ensuring WebSocket connection performance has become crucial. The WebSocket protocol for performance testing helps evaluate business performance under high load and high concurrent connections, ensuring good response speed and data transmission quality even when a large number of users are using it simultaneously.
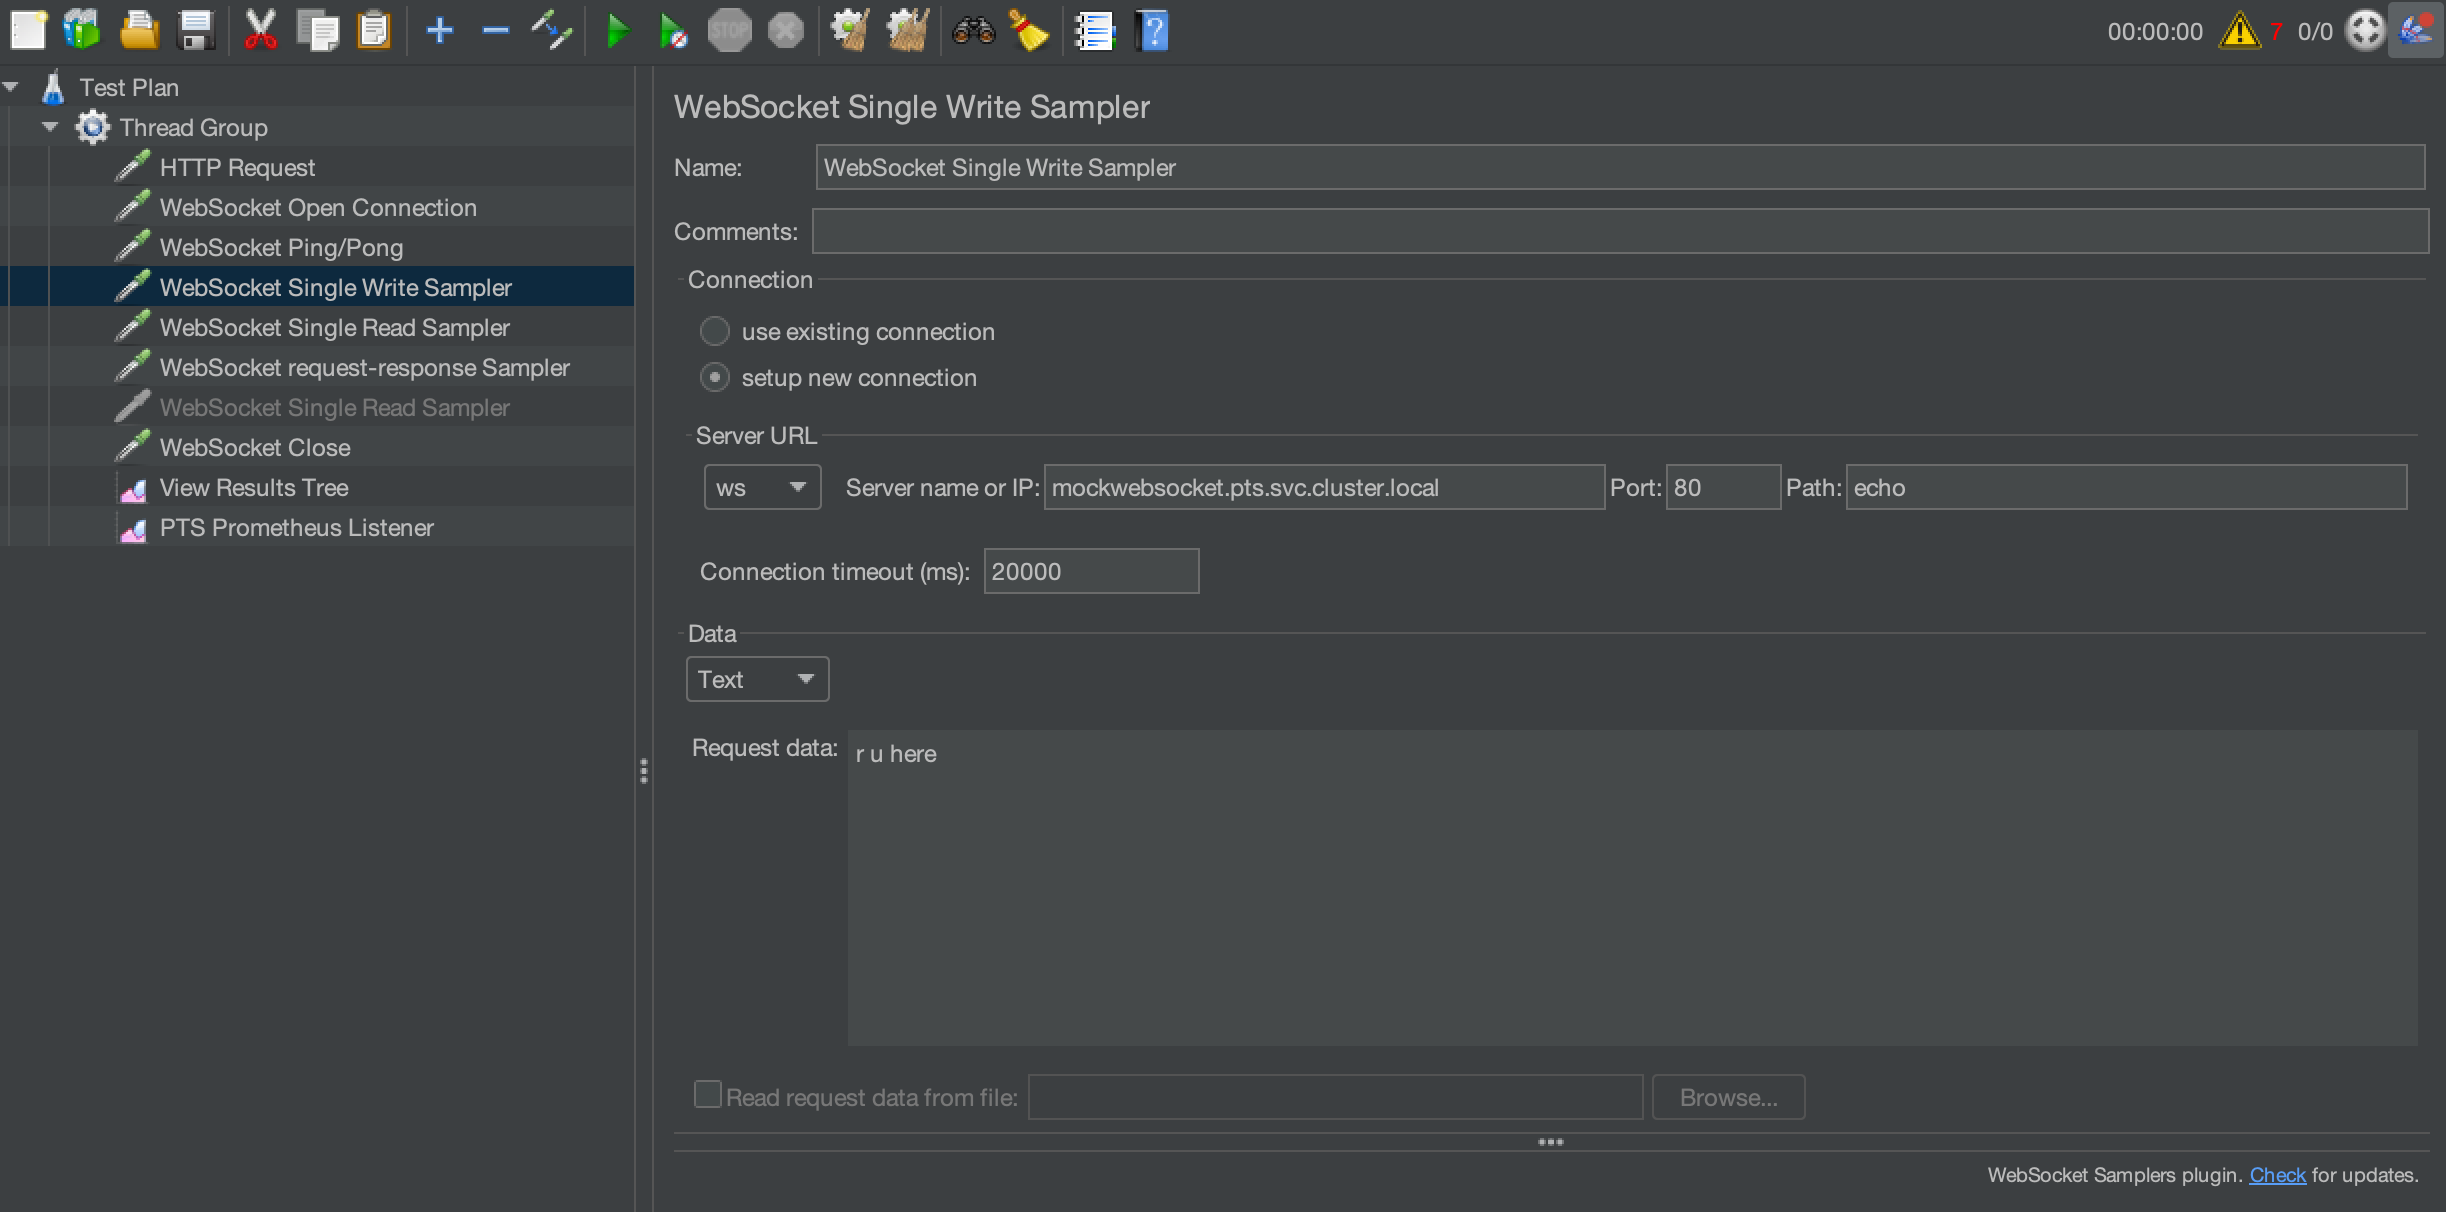
Although JMeter does not natively support WebSocket-based performance testing, JMeter provides additional support for it through plugin extension. The most commonly used plugin is WebSocket Samplers by Peter Doornbosch. This plugin provides 6 samplers that can meet most WebSocket-based performance testing requirements.

Plugin Version

PTS supports WebSocket-based performance testing that provides the same user experience as native JMeter-based performance testing. The metric reporting configuration has been applied in the stable plugin version, jmeter-websocket-samplers-1.2.8.jar, to support data reporting during the performance testing. Note that the plugin version should be 1.2.8. Other versions may lack metric reporting configuration, leading to incomplete data. The plugin can be downloaded at the following link: https://bitbucket.org/pjtr/jmeter-websocket-samplers/downloads/?tab=downloads.

Usage

Creating a JMeter-based Performance Testing Scenario

1. Log in to the TCOP console.
2. In the left sidebar, click PTS > Test Scenarios.
3. Click Create Scenario. On the Create Scenario page, select the testing scenario of the JMeter type.


Uploading the Performance Testing Files

1. Configure the performance testing plan in local JMeter according to business needs.


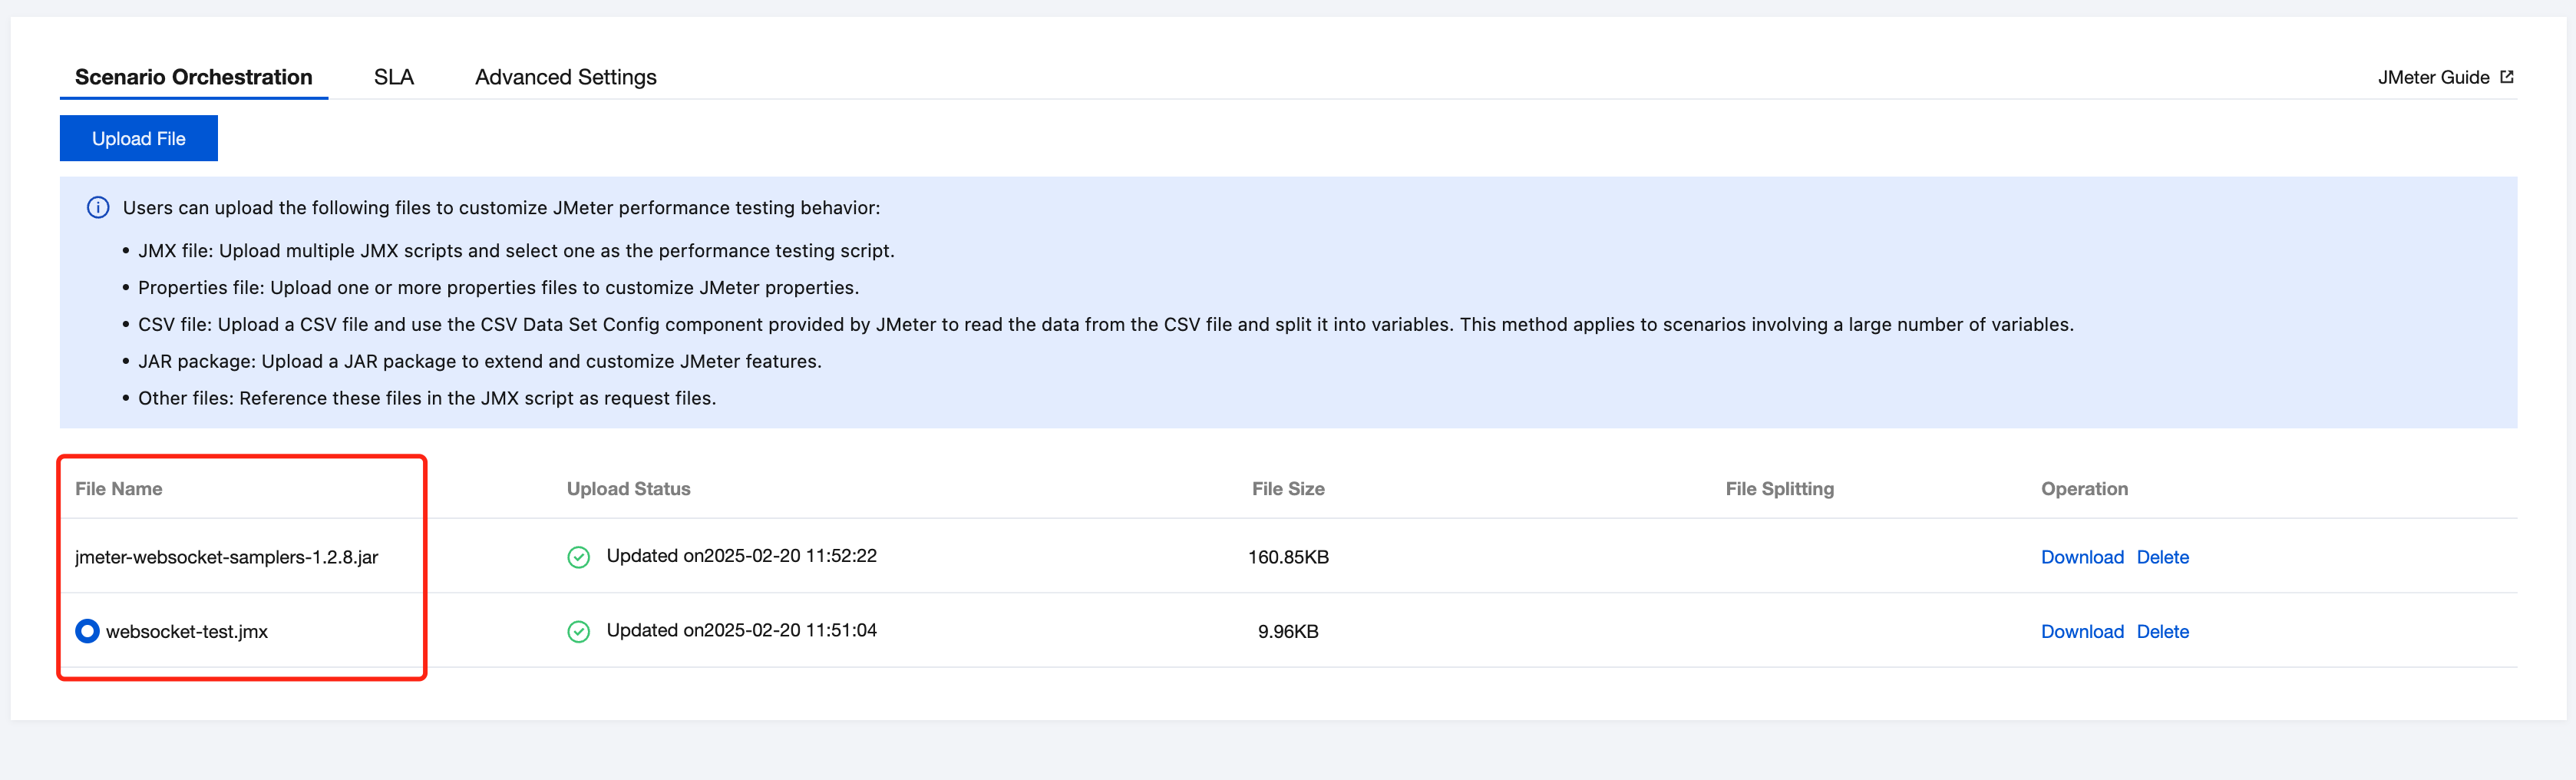
2. After the local debugging is successful, upload the corresponding JMX script, WebSocket plugin, and other necessary files to the console.


Running the Performance Testing Script

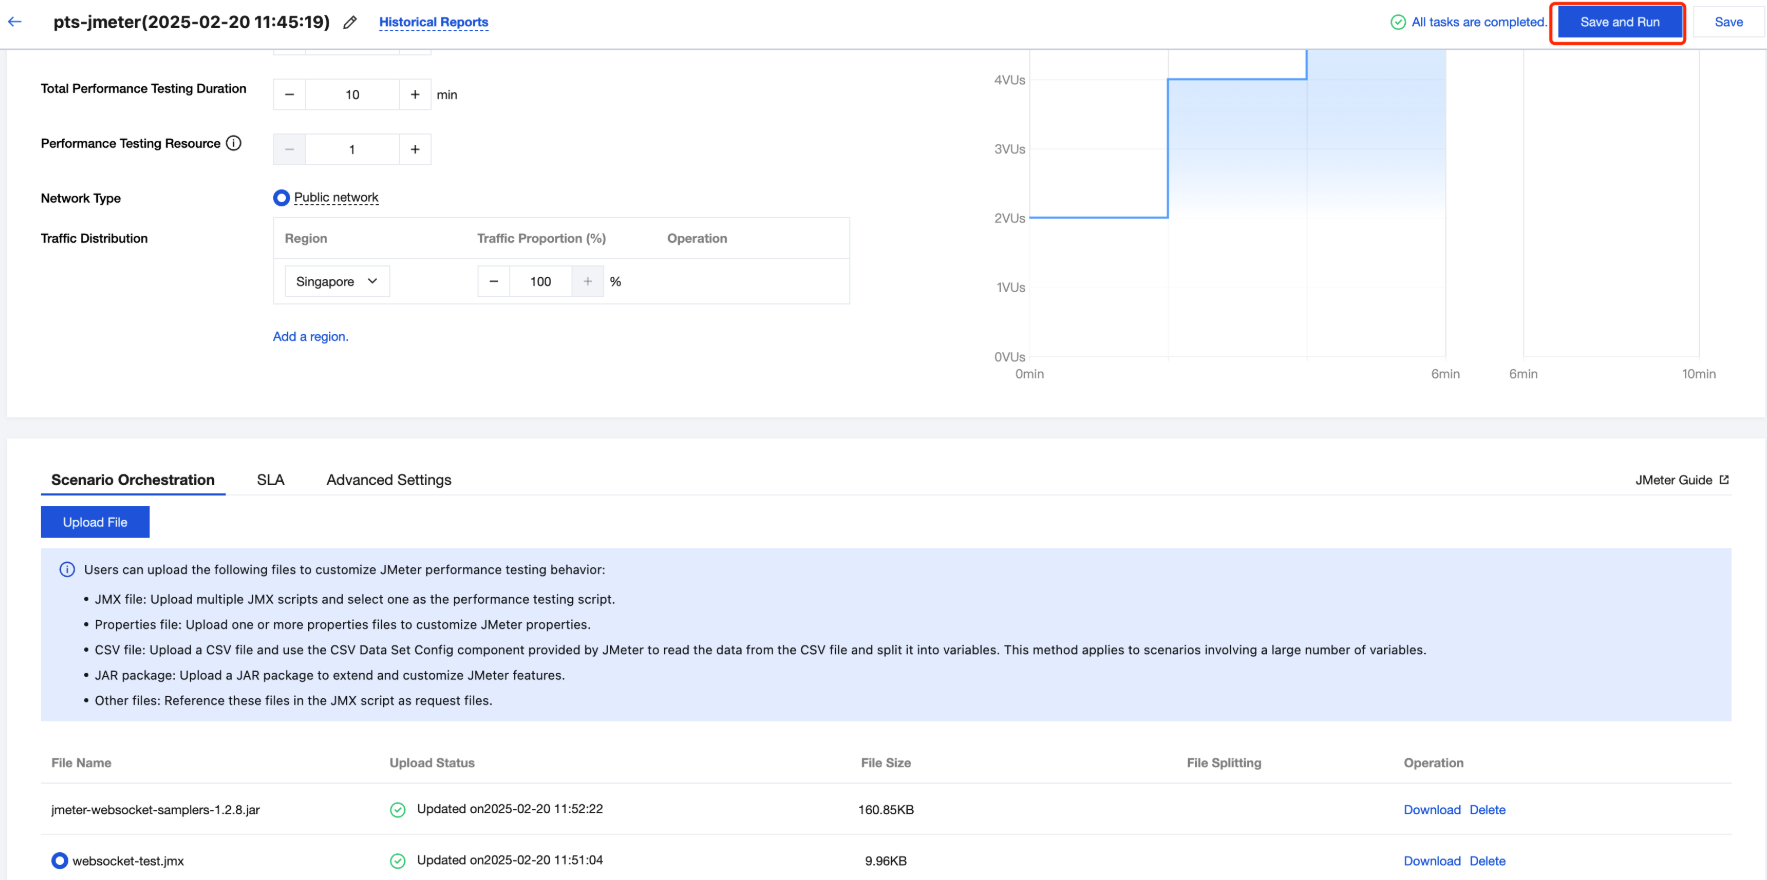
Click Save and Run in the upper right corner to start the performance testing task and generate a real-time report.


Viewing the Performance Testing Results

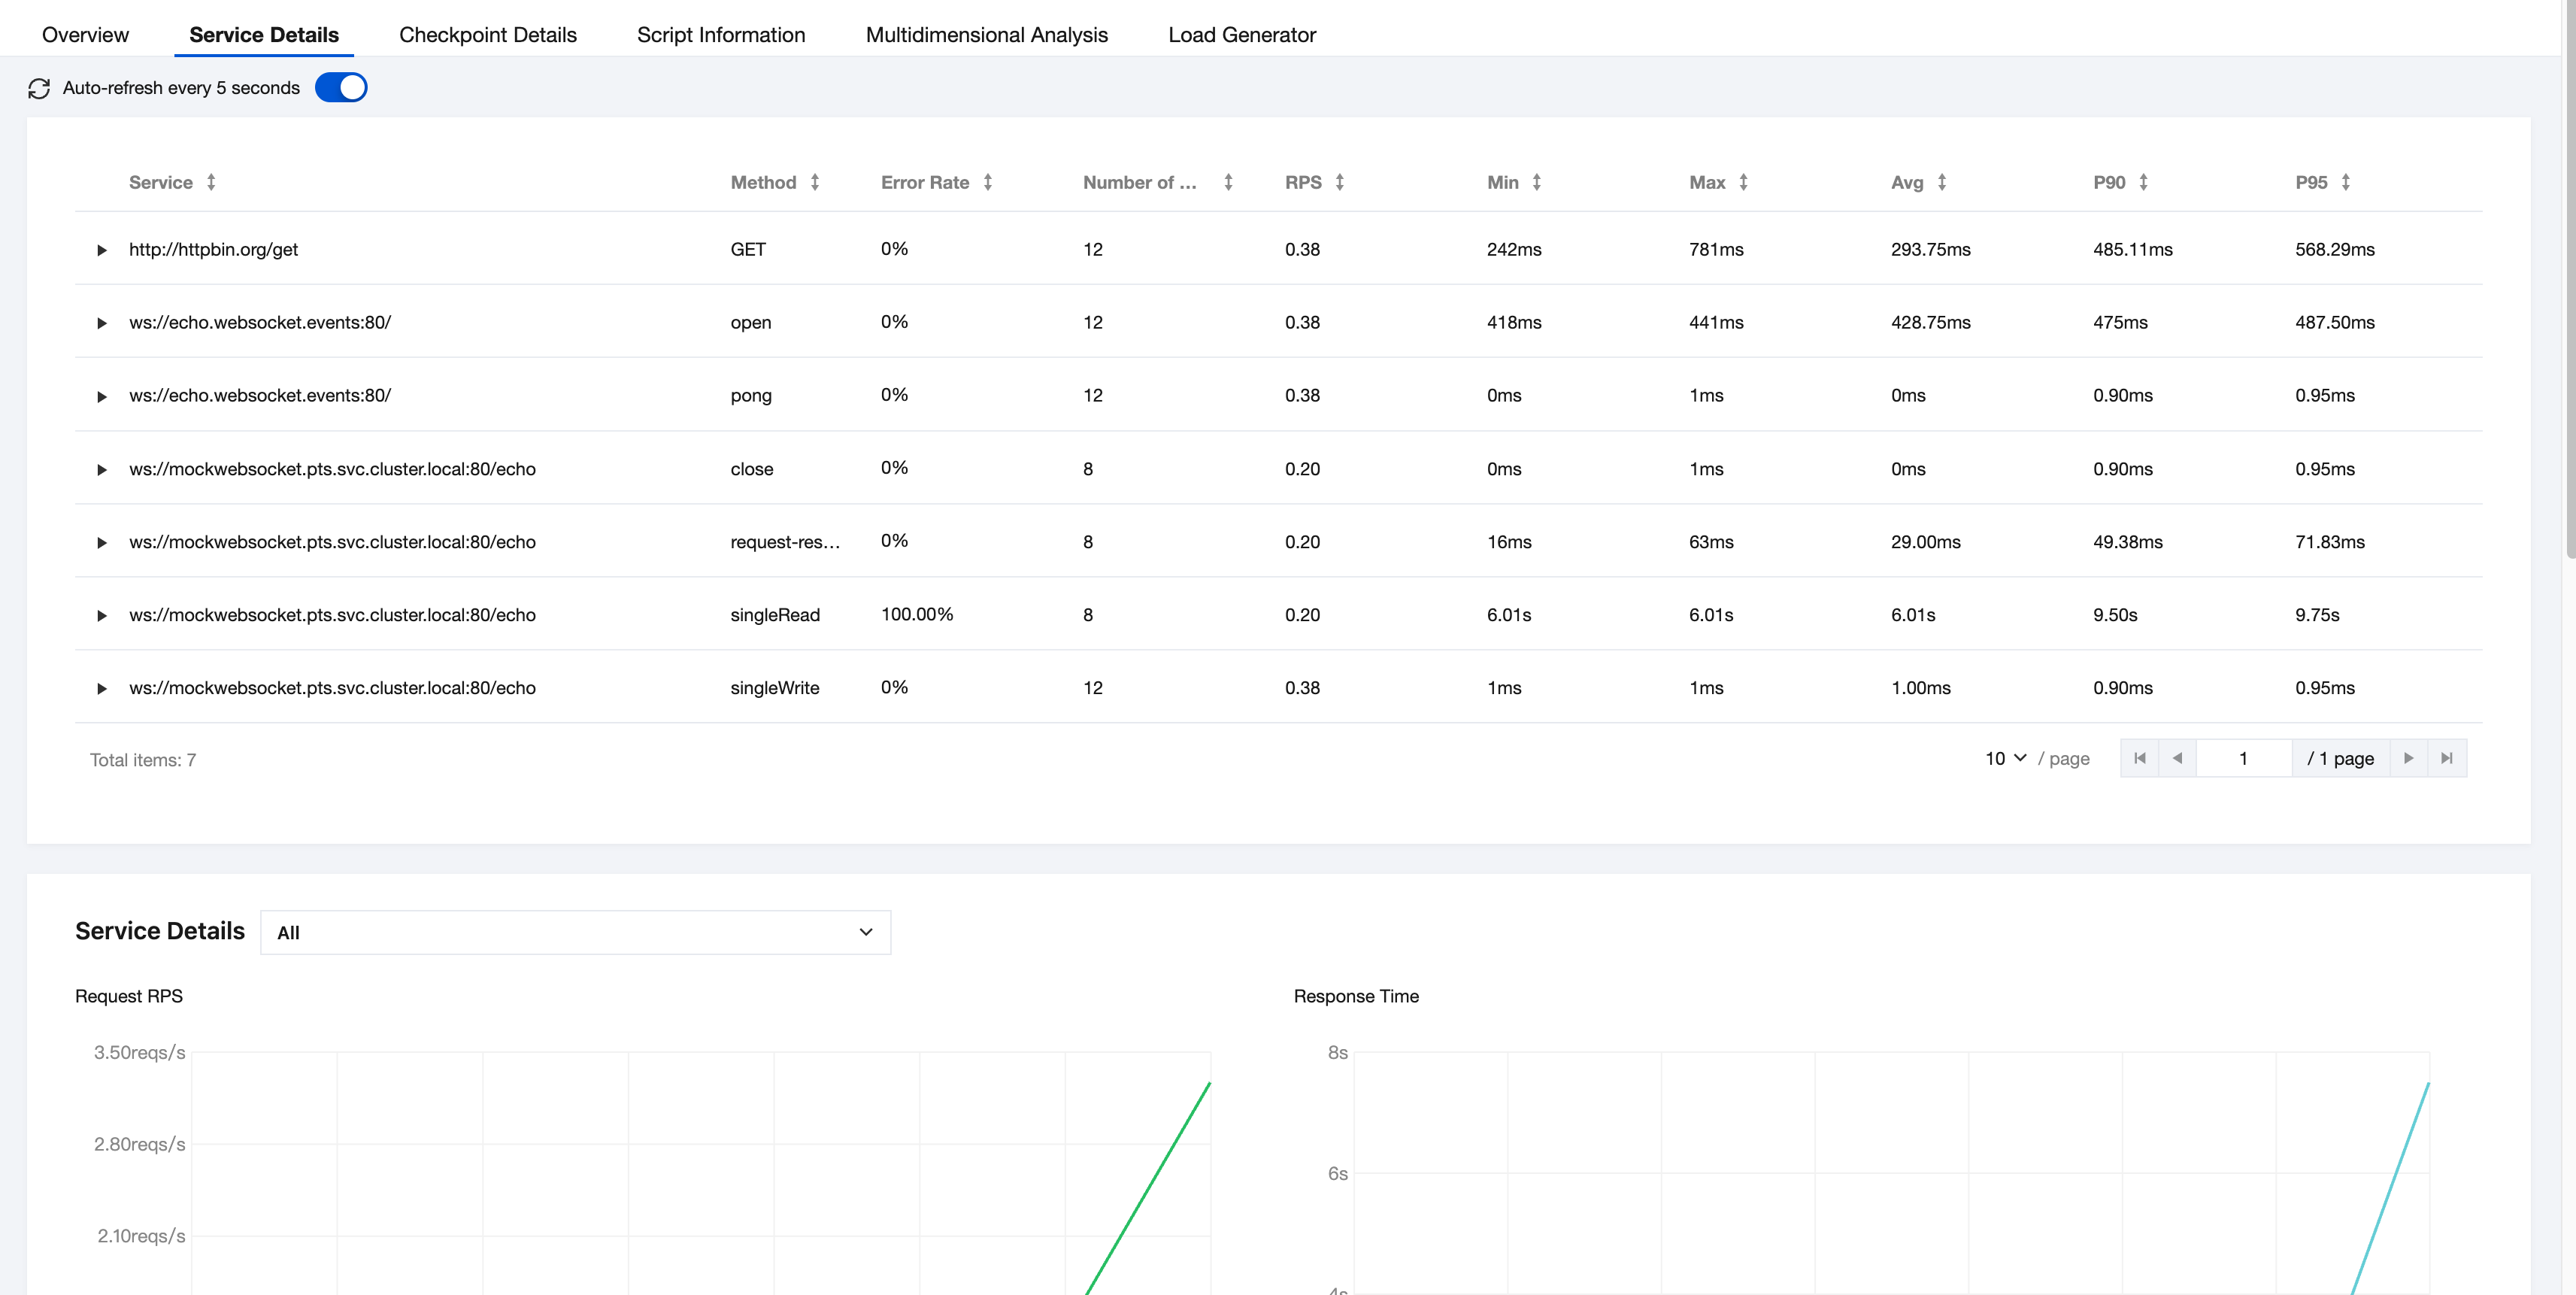
PTS has conducted event tracking for the results of each sampler in the WebSocket plugin. During the performance testing, you can view the performance testing data corresponding to different methods in the console according to business needs.


帮助和支持

本页内容是否解决了您的问题?

填写满意度调查问卷,共创更好文档体验。

文档反馈