Release Notes
Product Announcements
Security Announcement
wget https://artifacts.elastic.co/downloads/logstash/logstash-5.6.4.tar.gztar xvf logstash-5.6.4.tar.gzyum install java-1.8.0-openjdk java-1.8.0-openjdk-devel -y
\\*.conf configuration file based on the data source type. For more information, please see Data Source Configuration File Description.nohup ./bin/logstash -f ~/*.conf 2>&1 >/dev/null &
docker pull docker.elastic.co/logstash/logstash:5.6.9
\\*.conf configuration file based on the data source type and place it in the /usr/share/logstash/pipeline/ directory which can be customized.docker run --rm -it -v ~/pipeline/:/usr/share/logstash/pipeline/ docker.elastic.co/logstash/logstash:5.6.9
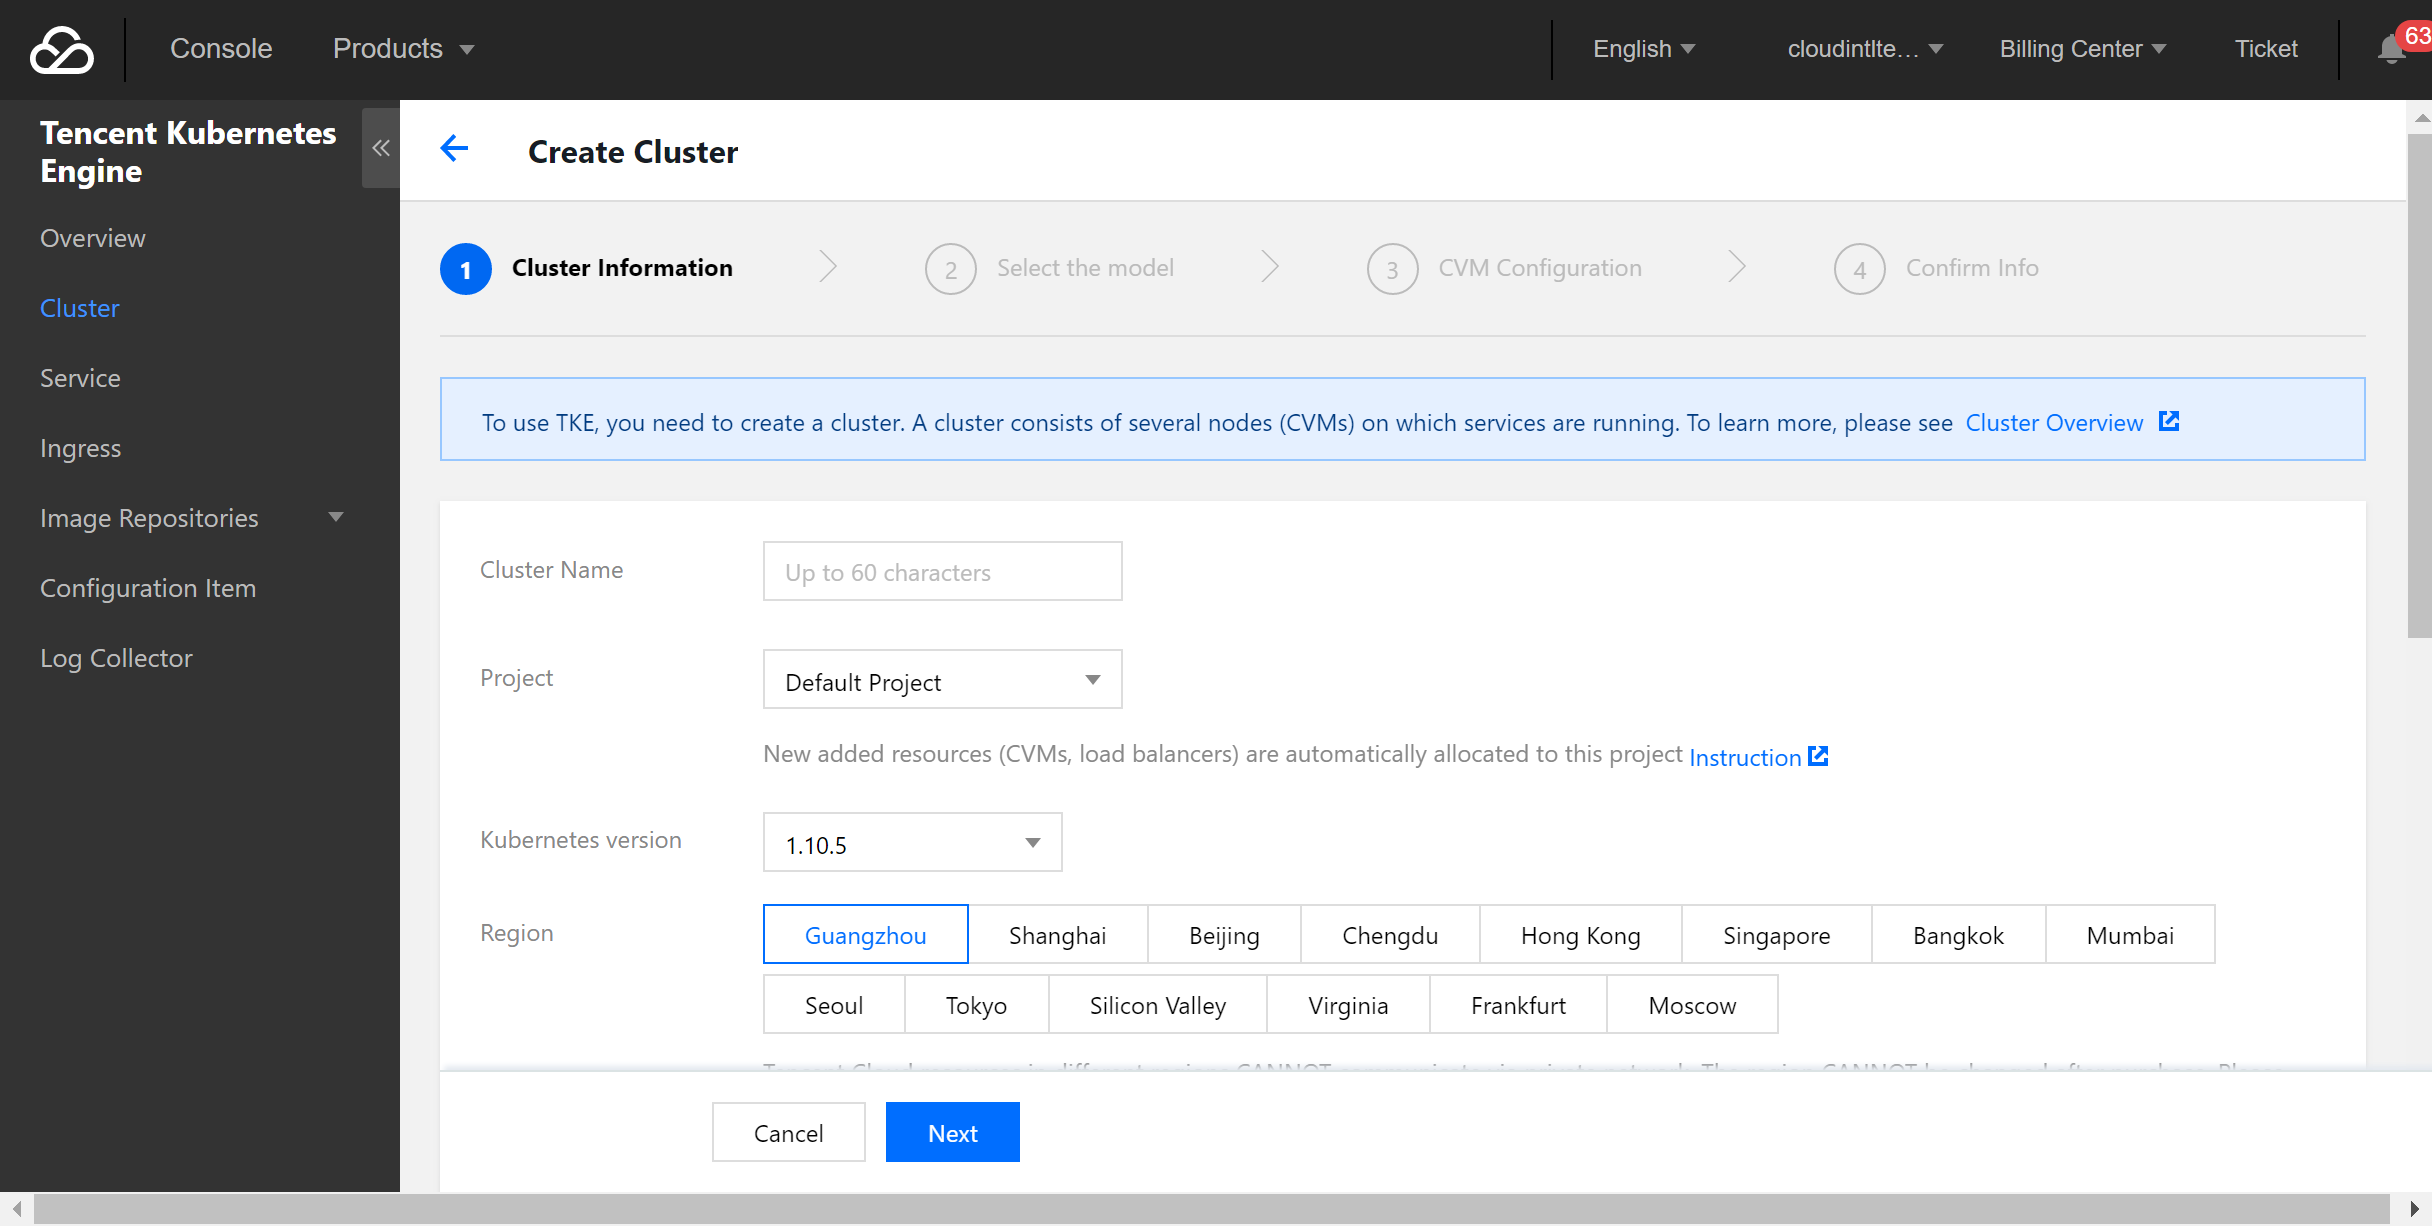
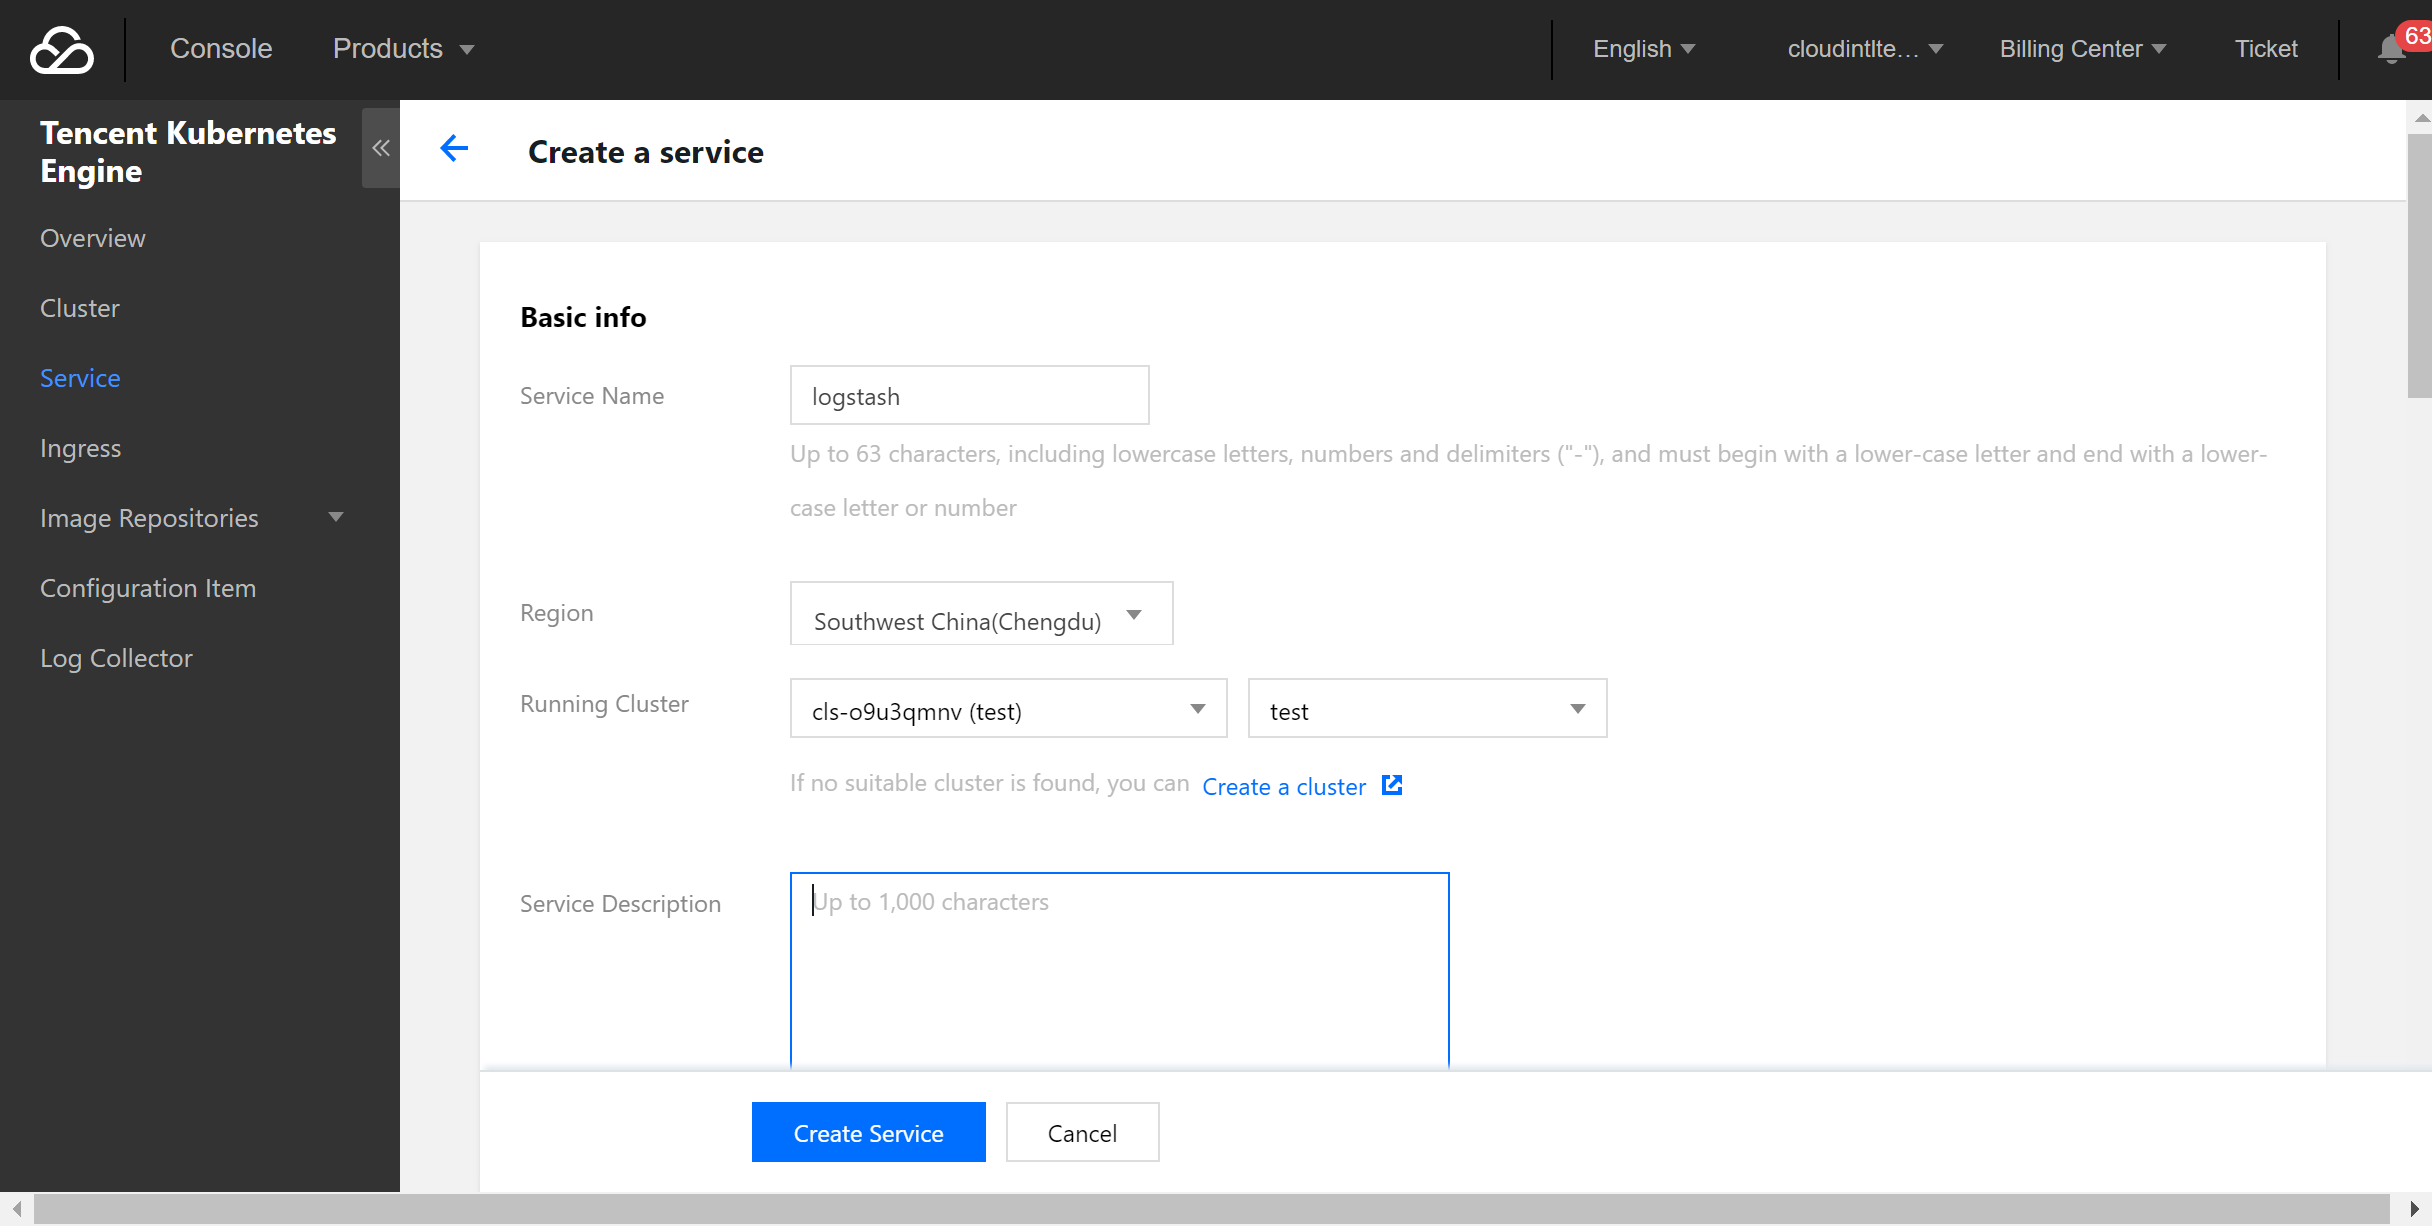
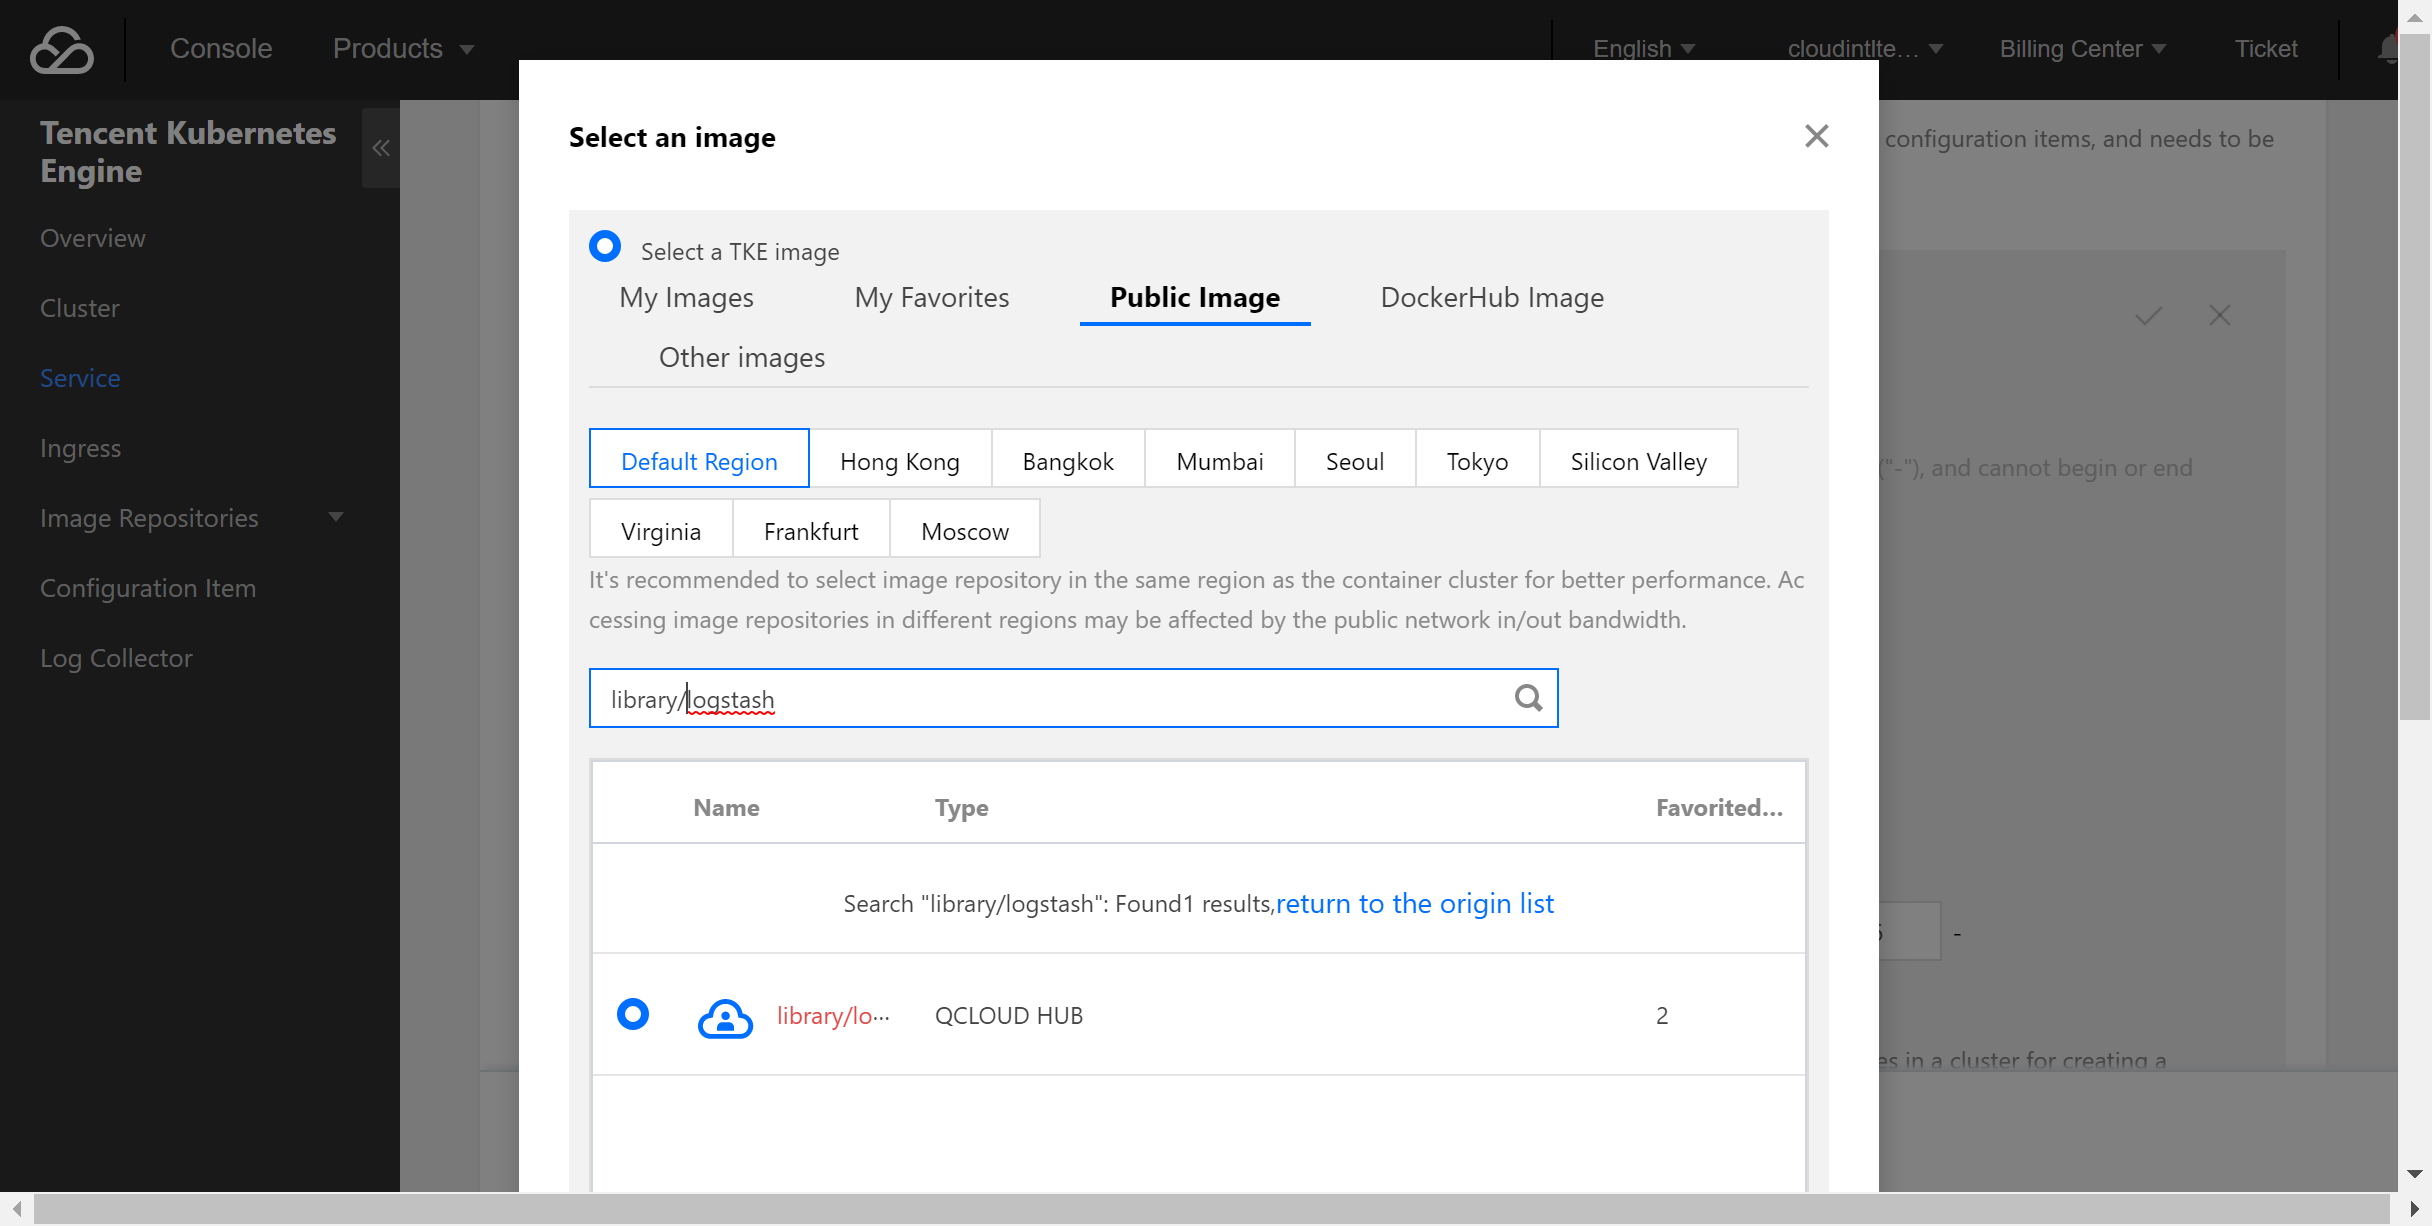
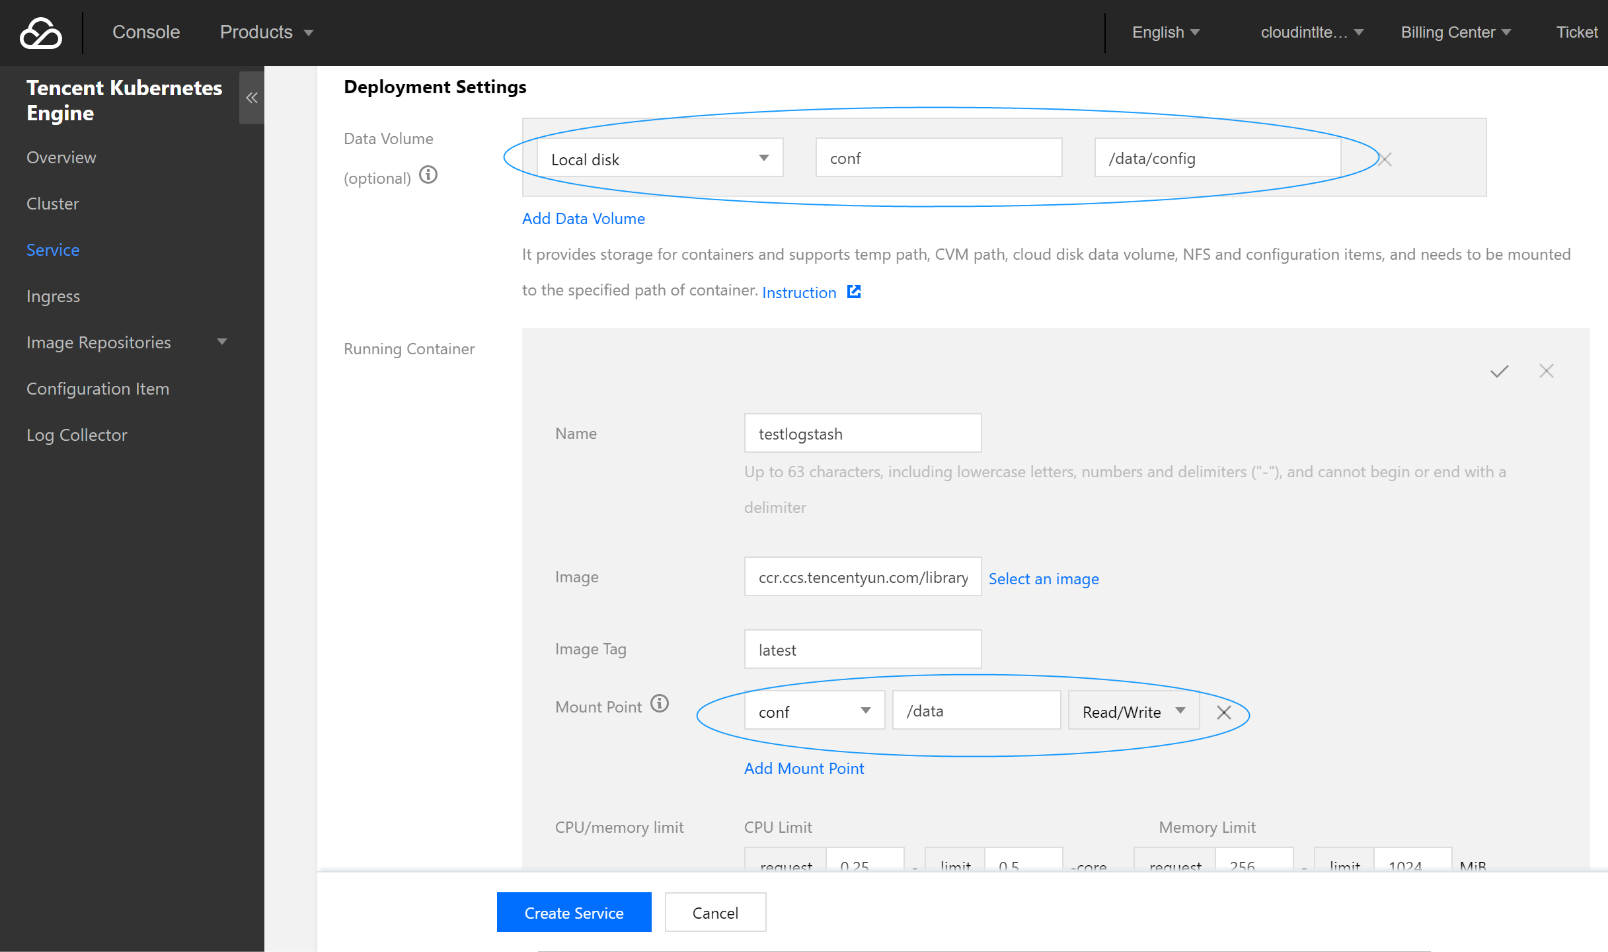
logstash.conf is added to the /data/config directory on the CVM instance and mounted to the /data directory of Docker, so that the logstash.conf file can be read when the container starts.
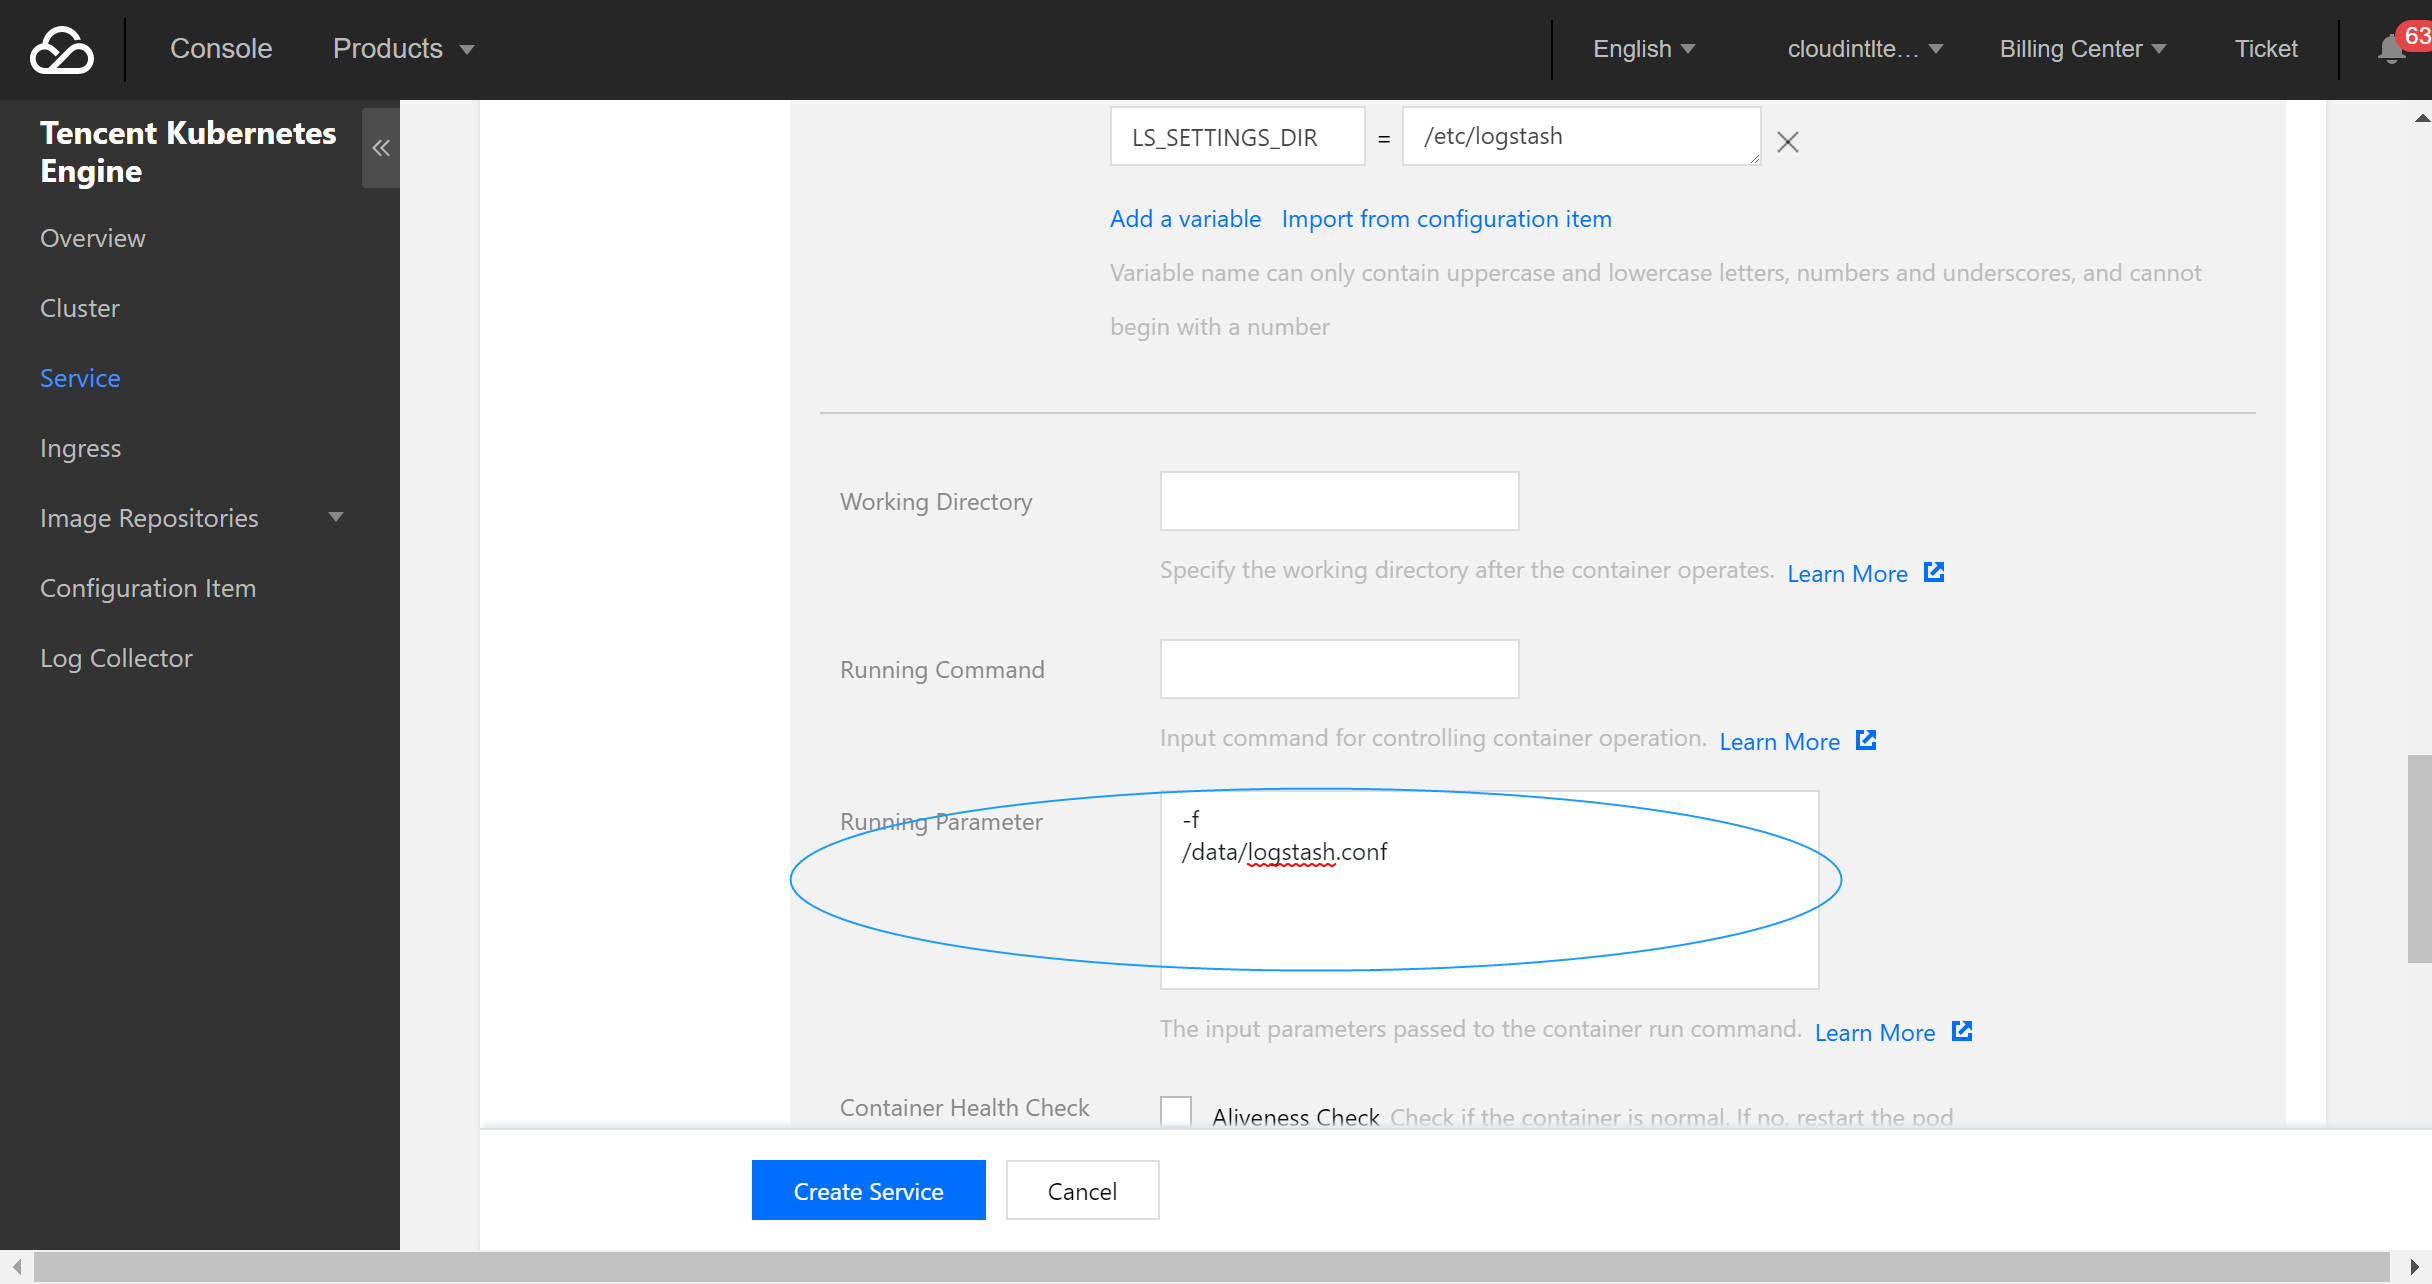
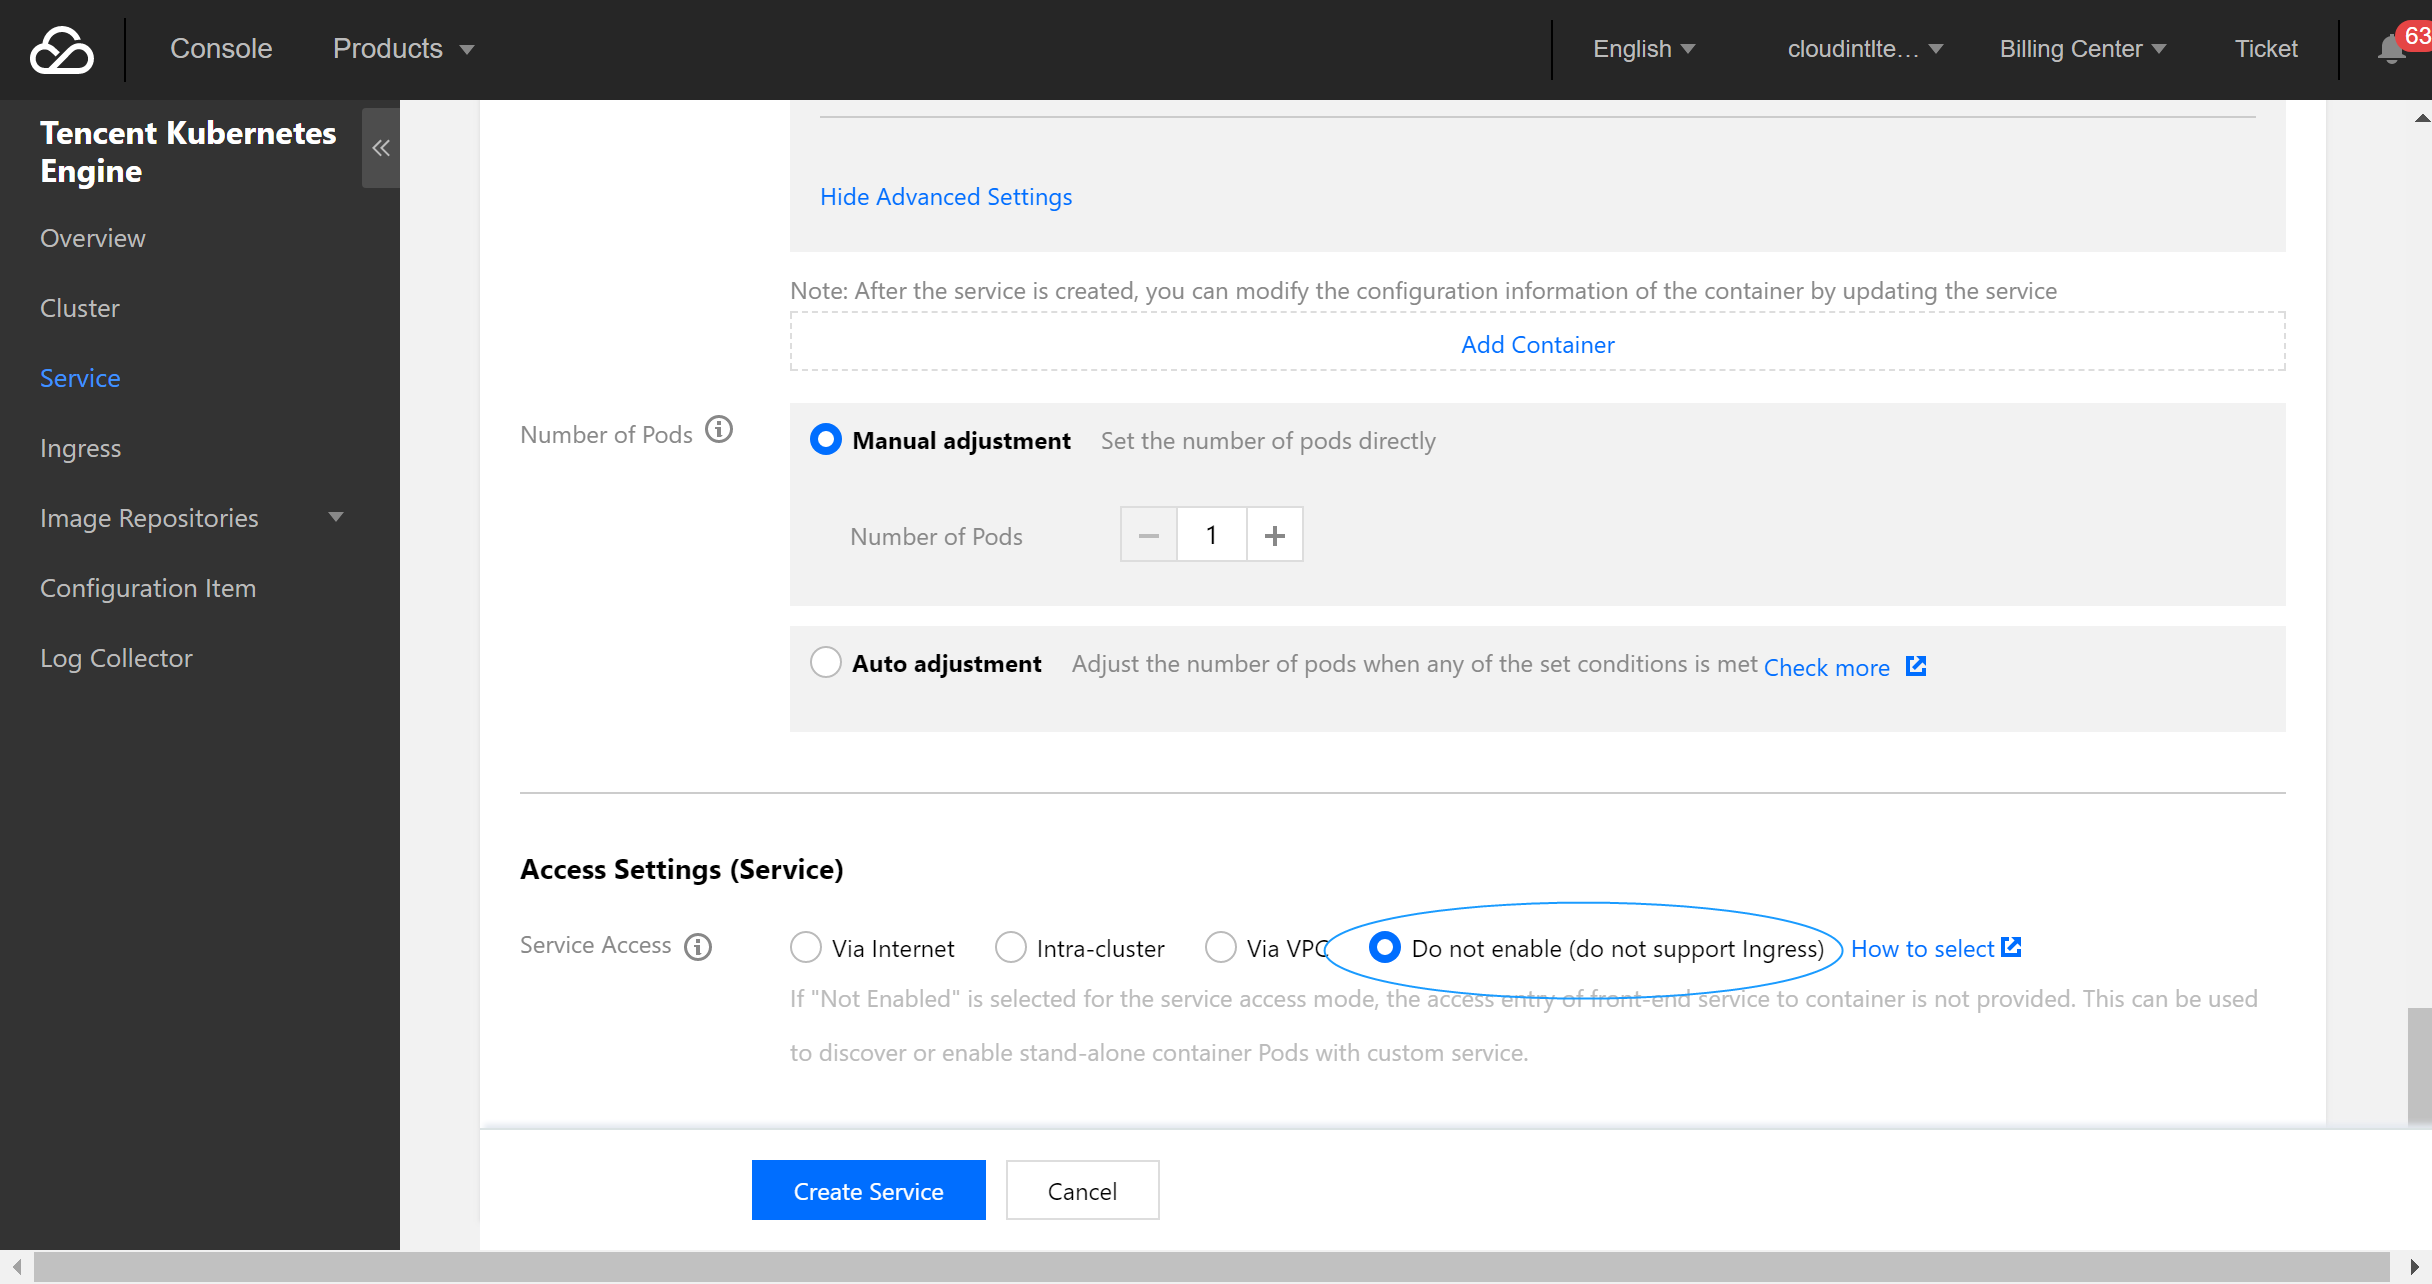
input {file {path => "/var/log/nginx/access.log" # File path}}filter {}output {elasticsearch {hosts => ["http://172.16.0.89:9200"] # Private VIP address and port of the ES clusterindex => "nginx_access-%{+YYYY.MM.dd}" # Custom index name suffixed with date. One index is generated per day}}
input{kafka{bootstrap_servers => ["172.16.16.22:9092"]client_id => "test"group_id => "test"auto_offset_reset => "latest" # Start consumption from the latest offsetconsumer_threads => 5decorate_events => true # This attribute will bring the current topic, offset, group, partition, and other information into the messagetopics => ["test1","test2"] # Array type. Multiple topics can be configuredtype => "test" # Data source identification field}}output {elasticsearch {hosts => ["http://172.16.0.89:9200"] # Private VIP address and port of the ES clusterindex => "test_kafka"}}
input {jdbc {# MySQL database addressjdbc_connection_string => "jdbc:mysql://172.16.32.14:3306/test"# Username and passwordjdbc_user => "root"jdbc_password => "Elastic123"# Driver jar package. You need to download the jar when installing and deploying Logstash on your own as it is not provided by Logstash by defaultjdbc_driver_library => "/usr/local/services/logstash-5.6.4/lib/mysql-connector-java-5.1.40.jar"# Driver class namejdbc_driver_class => "com.mysql.jdbc.Driver"jdbc_paging_enabled => "true"jdbc_page_size => "50000"# Path and name of the SQL file to be executed#statement_filepath => "test.sql"# SQL statement to be executedstatement => "select * from test_es"# Set the monitoring interval. The meanings of each field (from left to right) are minutes, hours, days, months, and years. If all of them are `*`, it indicates to update once every minute by defaultschedule => "* * * * *"type => "jdbc"}}output {elasticsearch {hosts => ["http://172.16.0.30:9200"]index => "test_mysql"document_id => "%{id}"}}
libbeat library as needed.wget https://artifacts.elastic.co/downloads/beats/filebeat/filebeat-5.6.4-linux-x86_64.tar.gztar xvf filebeat-5.6.4.tar.gz
filebeat.yml.nohup ./filebeat 2>&1 >/dev/null &
docker pull docker.elastic.co/beats/filebeat:5.6.9
\\*.conf configuration file based on the data source type and place it in the /usr/share/logstash/pipeline/ directory which can be customized.docker run docker.elastic.co/beats/filebeat:5.6.9
filebeat.yml file as follows:// Input source configurationfilebeat.prospectors:- input_type: logpaths:- /usr/local/services/testlogs/*.log// Output to ESoutput.elasticsearch:# Array of hosts to connect to.hosts: ["172.16.0.39:9200"]
피드백