Copyright Notice
©2013-2025 Tencent Cloud. All rights reserved.
Copyright in this document is exclusively owned by Tencent Cloud. You must not reproduce, modify, copy or distribute in any way, in whole or in part, the contents of this document without Tencent Cloud's the prior written consent.
Trademark Notice
All trademarks associated with Tencent Cloud and its services are owned by the Tencent corporate group, including its parent, subsidiaries and affiliated companies, as the case may be. Trademarks of third parties referred to in this document are owned by their respective proprietors.
Service Statement
This document is intended to provide users with general information about Tencent Cloud's products and services only and does not form part of Tencent Cloud's terms and conditions. Tencent Cloud's products or services are subject to change. Specific products and services and the standards applicable to them are exclusively provided for in Tencent Cloud's applicable terms and conditions.
Last updated:2023-11-08 10:14:24
Last updated:2023-11-08 10:15:00
Flink DataStream API or Flink Table API. Those who develop a JAR job need to have knowledge of Java or Scala DataStream API. This job type is suitable for users who focus on the underlying part of stream computing and require high complexity. To develop a JAR job, you need to develop and compile the JAR package in the local system first.Last updated:2023-11-08 10:11:04
Field | Description |
Job name | The name of the job, which is set when the job is created and can be modified. |
Cluster | The name of the cluster where the job resides. |
Cluster ID | The ID of the cluster where the job resides. |
Job ID | The serial ID of the job, usually starting with cql- (assigned at random, immutable). |
Job type | The type of the job. Four types are available: JAR, SQL, Python, and ETL. |
Status | The current status of the job, such as uninitialized, unpublished, operating, running, stopped, or error. |
Region | The geographical region of the cluster where the job resides, such as Guangzhou, Shanghai, or Beijing. |
AZ | The AZ of the cluster where the job resides, such as Shanghai Zone 3. |
Online version | The running version. |
Creation time | The time when the job is created. |
Cumulative run time | The total run time of the job. |
Start time | The time when this job run starts. |
Run time | The duration of this job run. |
Compute resources | The number of CUs used in this job run. It is the sum of the number of JobManager CUs and that of TaskManager CUs, where the number of JobManager CUs = 1 (1 for each job by default) and that of TaskManager CUs = Maximum parallelism x CUs per TaskManager. |
Last updated:2023-11-08 10:12:24
Last updated:2023-11-08 10:09:02
StreamExecutionEnvironment env = StreamExecutionEnvironment.getExecutionEnvironment();env.setRuntimeMode(RuntimeExecutionMode.BATCH);
RuntimeExecutionMode.STREAMING to RuntimeExecutionMode.BATCH in a streaming job.env_settings = EnvironmentSettings.new_instance().in_batch_mode().use_blink_planner().build()table_env = TableEnvironment.create(env_settings)
EnvironmentSettings.new_instance().in_streaming_mode() to EnvironmentSettings.new_instance().in_batch_mode() in a streaming job. For details, see Intro to the Python Table API.Last updated:2023-12-26 17:49:27
RocksDB StateBackend.state.backend: filesystem
restart-strategy: fixed-delayrestart-strategy.fixed-delay.attempts: 100restart-strategy.fixed-delay.delay: 5 s
taskmanager.memory.jvm-overhead.fraction: 0.3
execution.checkpointing.mode: AT_LEAST_ONCE
pipeline.operator-chaining: false
execution.checkpointing.timeout: 3000s
execution.checkpointing.timeout: 1000s
set CHECKPOINT_TIMEOUT= '1000 s';
DELETE_ON_CANCELLATION, RETAIN_ON_CANCELLATION, and RETAIN_ON_SUCCESS. The default policy is DELETE_ON_CANCELLATION. If this parameter is not set, the default policy will be used.Checkpoint Storage Policy | Checkpoint Clearing |
DELETE_ON_CANCELLATION (default) | 1. Create a checkpoint when the job is stopped, and delete the old checkpoint (so cannot recover the job from the old one) 2. Create no checkpoint when the job is stopped, and delete the old checkpoint (so cannot recover the job from checkpoint) |
RETAIN_ON_CANCELLATION | 1. Create a checkpoint when the job is stopped, and delete the old checkpoint (so cannot recover the job from the old one) 2. Create no checkpoint when the job is stopped, and do not delete the old checkpoint (so can recover the job from checkpoint) |
RETAIN_ON_SUCCESS | 1. Create a checkpoint when the job is stopped, and do not delete the old checkpoint (so can recover the job from checkpoint) 2. Create no checkpoint when the job is stopped, and do not delete the old checkpoint (so can recover the job from checkpoint) |
execution.checkpointing.externalized-checkpoint-retention: RETAIN_ON_SUCCESS
Non-customizable Parameters |
kubernetes.container.image |
kubernetes.jobmanager.cpu |
taskmanager.cpu.cores |
kubernetes.taskmanager.cpu |
jobmanager.heap.size |
jobmanager.heap.mb |
jobmanager.memory.process.size |
taskmanager.heap.size |
taskmanager.heap.mb |
taskmanager.memory.process.size |
taskmanager.numberOfTaskSlots |
env.java.opts (you can customize another two separate parameters: env.java.opts.taskmanager and env.java.opts.jobmanager) |
Last updated:2023-11-07 18:18:45
MaxParallelism, for example), Flink has to discard the current runtime state of the job and restart it.2048.128. To increase their maximum parallelism, you need to manually change the value of this parameter, and the system will discard the existing runtime state and restart the jobs.MaxParallelism, or when you want to explicitly restrict the maximum scaling capabilities of the job.pipeline.max-parallelism is the maximum parallelism of all operators in the job. For example, if a job has 5 operators, whose parallelism is [1, 5, 100, 2, 2], respectively, the minimum value of pipeline.max-parallelism allowed is 100.pipeline.max-parallelism is fixed to 16384. However, we recommend you maintain pipeline.max-parallelism at 2048 or lower to avoid unnecessary runtime overhead or reduced processing capabilities of the job.Last updated:2023-11-08 10:05:51
Last updated:2023-11-08 10:07:24
Last updated:2023-11-07 18:05:17
Status.JVM.CPU.Load of the JobManager, representing the CPU utilization of the JVM.Status.JVM.GarbageCollector.<GarbageCollector>.Count of the JobManager, representing the GC count of the JobManager.Status.JVM.GarbageCollector.<GarbageCollector>.Time of the JobManager, representing the GC time of the JobManager.Status.JVM.CPU.Load of the TaskManager, representing the CPU utilization of the JVM.Status.JVM.GarbageCollector.<GarbageCollector>.Count of the TaskManager, representing the GC count of the TaskManager.Status.JVM.GarbageCollector.<GarbageCollector>.Time of the TaskManager, representing the GC time of the TaskManager.Last updated:2023-11-08 10:19:09
Last updated:2023-11-08 10:19:40
Field | Description | Example |
instanceId | The job ID | cql-xxxxxx |
folderId | The ID of the job directory | folder-xxxxxxxx |
creatorUin | The UIN of the job creator | 123456 |
clusterId | The ID of the cluster where the job resides | cluster-xxxxxxxx |
workSpaceId | The ID of the workspace where the job resides | space-xxxxxxxx |
Last updated:2023-11-07 18:09:05
Metric | Description | Example Value |
job_records_in_per_second | The total number of records the job receives from all sources per second. | 22478.14 Record/s |
job_records_out_per_second | The total number of records the job emits to all sinks per second. | 12017.09 Record/s |
job_bytes_in_per_second | The total number of bytes the job receives from all sources (Kafka sources only) per second. | 786576 Byte/s |
job_bytes_out_per_second | The total number of bytes the job emits to all sinks (Kafka sinks only) per second. | 156872 Byte/s |
job latency | The total latency it takes the data to flow through all operators. Sample errors may exist, so the value is for reference only. | 275 ms |
job_service_delay | The difference between the current timestamp and the watermark at the sink (if there are multiple sinks, the maximum difference is used). | 5432 ms |
job_cpu_load | The average CPU utilization of all TaskManagers of the job. | 23.85% |
taskmanager_status_jvm_memory_heap_used_percentage | The average heap memory utilization of all TaskManagers of the job. | 57.12% |
taskmanager_status_jvm_memory_heap_used | The total heap memory used of all TaskManagers of the job. | 830897056.00 Bytes |
taskmanager_memory_heap_committed | The total heap memory committed of all TaskManagers of the job. | 4937220096.00 Bytes |
taskmanager_memory_heap_max | The total max heap memory of all TaskManagers of the job. | 4937220096.00 Bytes |
taskmanager_status_jvm_memory_nonheap_used | The total non-heap memory (JVM metaspace and code cache) used of all TaskManagers of the job. | 296651064.00 Bytes |
taskmanager_memory_nonheap_committed | The total non-heap memory (JVM metaspace and code cache) committed of all TaskManagers of the job. | 103219200.00 Bytes |
taskmanager_status_jvm_memory_nonheap_max | The total max non-heap memory (JVM metaspace and code cache) of all TaskManagers of the job. | 780140544.00 Bytes |
taskmanager_status_jvm_memory_process_memoryused | The max JVM memory (RSS) of all TaskManagers of the job, including heap, non-heap, native, and other areas. This metric is used to give an early warning for OOM Killed events in a Pod. | 3597035110.00 Bytes |
taskmanager_memory_direct_count | The sum of buffers in the direct buffer pools of all TaskManagers of the job. | 10993.00 Items |
taskmanager_memory_direct_used | The total direct buffer pools used of all TaskManagers of the job. | 360328431.00 Bytes |
taskmanager_memory_direct_max | The total max direct buffer pools of all TaskManagers of the job. | 360328431.00 Bytes |
taskmanager_memory_mapped_count | The sum of buffers in the mapped buffer pools of all TaskManagers of the job. | 4 Items |
taskmanager_memory_mapped_used | The total mapped buffer pools used of all TaskManagers of the job. | 33554432.00 Bytes |
taskmanager_memory_mapped_max | The total max mapped buffer pools of all TaskManagers of the job. | 33554432.00 Bytes |
jobmanager_jvm_old_gc_count | The old GC count of the JobManager of the job. | 3.00 Times |
jobmanager_jvm_old_gc_time | The old GC time of the JobManager of the job. | 701.00 ms |
jobmanager_jvm_young_gc_count | The young GC count of the JobManager of the job. | 53.00 Times |
jobmanager_jvm_young_gc_time | The young GC time of the JobManager of the job. | 4094.00 ms |
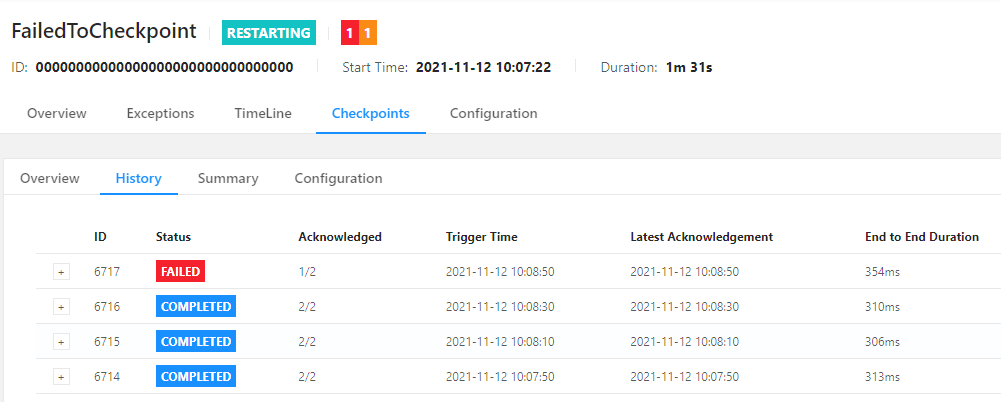
job_lastcheckpointduration | The time taken to make the last checkpoint of the job. | 723.00 ms |
job_lastcheckpointsize | The size of the last checkpoint of the job. | 751321.00 Bytes |
taskmanager_jvm_old_gc_count | The sum of old GC counts of all TaskManagers of the job. | 9.00 Times |
taskmanager_jvm_old_gc_time | The sum of old GC time of all TaskManagers of the job. | 2014.00 ms |
taskmanager_jvm_young_gc_count | The sum of young GC counts of all TaskManagers of the job. | 889.00 Times |
taskmanager_jvm_young_gc_time | The sum of young GC time of all TaskManagers of the job. | 15051.00 ms |
job_numberofcompletedcheckpoints | The number of successful checkpoints of the job. | 11.00 Times |
job_numberoffailedcheckpoints | The number of failed checkpoints of the job. | 1.00 Time |
job_numberofinprogresscheckpoints | The number of checkpoints in progress (not completed) of the job. | 1.00 Time |
job_totalnumberofcheckpoints | The total number of checkpoints (in progress, completed, and failed) of the job. | 13.00 Times |
job_numrecordsinbutfailed | The number of failed records (such as raising various exceptions) in the operator. If its value is greater than 1, the semantics of Exactly-Once will be affected. It is a testing parameter for reference only. | 0.00 Times |
jobmanager_job_numrestarts | The recorded number of job restarts due to crash (excluding restart of the job after the JobManager exits) of the JobManager of the job. | 10.00 Times |
jobmanager_status_jvm_memory_heap_used_percentage | The heap memory utilization of the JobManager of the job. | 31.34% |
jobmanager_memory_heap_used | The heap memory used of the JobManager of the job. | 1040001560.00 Bytes |
jobmanager_memory_heap_committed | The heap memory committed of the JobManager of the job. | 3318218752.00 Bytes |
jobmanager_memory_heap_max | The max heap memory of the JobManager of the job. | 3318218752.00 Bytes |
jobmanager_status_jvm_memory_nonheap_used | The non-heap memory (JVM metaspace and code cache) used of the JobManager of the job. | 117362656.00 Bytes |
jobmanager_memory_nonheap_committed | The non-heap memory (JVM metaspace and code cache) committed of the JobManager of the job. | 122183680.00 Bytes |
jobmanager_status_jvm_memory_nonheap_max | The max non-heap memory (JVM metaspace and code cache) of the JobManager of the job. | 780140544.00 Bytes |
jobmanager_status_jvm_memory_used | The JVM memory used (RSS) of the JobManager of the job, including heap, non-heap, native and other areas. This metric is used to give an early warning for OOM Killed events in a Pod. | 3597035110.00 Bytes |
jobmanager_cpu_load | The CPU utilization of the JobManager of the job. | 7.12% |
jobmanager_cpu_time | The CPU service time (ms) of the JobManager of the job. | 834490.00 ms |
jobmanager_downtime | For a non-running (failed or recovering) job, the duration of this downtime; for a running job, the value of this metric is 0. | 1088466.00 ms |
job_uptime | For a running job, the duration of continuous running of this job without interruption. | 202305.00 ms |
job_restartingtime | The time taken for the last restart of the job. | 197181.00 ms |
jobmanager_lastcheckpointrestoretimestamp | The Unix timestamp of the last job recovery from checkpoint (in ms), whose value will be -1 if no recovery is performed. | 1621934344137.00 ms |
jobmanager_memory_mapped_count | The number of buffers in the mapped buffer pool of the JobManager of the job. | 4.00 Items |
jobmanager_memory_mapped_memoryused | The mapped buffer pool used of the JobManager of the job. | 33554432.00 Bytes |
jobmanager_memory_mapped_totalcapacity | The max mapped buffer pool of the JobManager of the job. | 33554432.00 Bytes |
jobmanager_memory_direct_count | The number of buffers in the direct buffer pool of the JobManager of the job. | 22.00 Items |
jobmanager_memory_direct_memoryused | The direct buffer pool used of the JobManager of the job. | 575767.00 Bytes |
jobmanager_memory_direct_totalcapacity | The max direct buffer pool of the JobManager of the job. | 577814.00 Bytes |
jobmanager_numregisteredtaskmanagers | The number of registered TaskManagers of the job, which is generally equal to the max operator parallelism. The decline in the number of TaskManagers indicates that some TaskManagers are disconnected, and the job may crash and try to recover. | 3.00 TaskManagers |
jobmanager_numrunningjobs | The number of running jobs, with 1 for proper job running and 0 for job crash. | 1.00 Job |
jobmanager_taskslotsavailable | The number of task slots available, with 0 for proper job running and a value other than 0 for possible non-running of the job for a short period of time. | 0.00 Slots |
jobmanager_taskslotstotal | In Stream Compute Service, a TaskManager has only one task slot, so the total number of task slots is equal to the number of registered TaskManagers. | 3.00 Slots |
jobmanager_threads_count | The number of active threads in the JobManager of the job, including daemon and non-daemon threads. | 77.00 Threads |
taskmanager_cpu_time | The CPU service time (ms) of all TaskManagers of the job. | 2029230.00 ms |
taskmanager_network_availablememorysegments | The sum of memory segments available in all TaskManagers of the job. | 32890.00 Items |
taskmanager_network_totalmemorysegments | The sum of total memory segments assigned to all TaskManagers of the job. | 32931.00 Items |
taskmanager_threads_count | The total number of active threads in all TaskManagers of the job, including daemon and non-daemon threads. | 207.00 Threads |
job_lastcheckpointsize | The size of the last checkpoint. | 1,024 Bytes |
job_lastcheckpointduration | The time taken to make the last checkpoint. | 100ms |
job_numberoffailedcheckpoints | The number of failed checkpoints. | 50 Bytes |
JM CPU Load | The JVM CPU utilization of the JobManager. | 12% |
JM Heap Memory | The heap memory usage of the JobManager. | 50 Bytes |
JM GC Count | Status.JVM.GarbageCollector.<GarbageCollector>.Count of the JobManager, representing the GC count of the JobManager. | 5 times |
JM GC Time | Status.JVM.GarbageCollector.<GarbageCollector>.Time of the JobManager, representing the GC time of the JobManager. | 64ms |
TaskManager CPU Load | The JVM CPU utilization of the selected TaskManager. | 70% |
TaskManager Heap Memory | The heap memory usage of the selected TaskManager. | 50 bytes |
TaskManager GC Count | Status.JVM.GarbageCollector.<GarbageCollector>.Count of the selected TaskManager, representing the GC count of the TaskManager. | 5 times |
TaskManager GC Time | Status.JVM.GarbageCollector.<GarbageCollector>.Time of the selected TaskManager, representing the GC time of the TaskManager. | 5ms |
Task OutPoolUsage | The percentage of output queues. When this metric reaches 100%, the task is backpressured. | 64% |
Task OutputQueueLength | The number of output queues. | 6 |
Task InPoolUsage | The percentage of input queues. When this metric reaches 100%, the task is backpressured. | 64% |
Task InputQueueLength | The number of input queues. | 6 |
Task CurrentInputWatermark | The current watermark of the task. | 1623814418 |
Data import time (ETL) | The delay of a source taking the data in the job. | 10 ms |
job_records_in_per_second (ETL) | The total rate of all sources in the job. | 342 Records/s |
SourceIdleTime (ETL) | The interval between data batches processed by a source in the job, which indirectly reflects the idle time of the source. | 24532223 ms |
SynDelay (ETL) | The delay of a source taking the data and processing it in the job. | 1345 ms |
BinLogPos (ETL) | The MySQL binary log coordinates or PostgreSQL log sequence number (LSN) of the job. | 260690147 |
job latency (ETL) | The average delay between the sink and source operators of the job. | 49 ms |
DbFlushDelay (ETL) | The sum of the database flush delay and async callback time of the job. | 30 ms |
job_records_out_per_second (ETL) | The total rate of all sinks in the job. | 234 Records/s |
Source - full sync (ETL) | The full data sync progress of the job. | 30% |
Source - incremental sync (ETL) | For MySQL, sync delay refers to the gap between the binlog coordinates of the current source and the latest binlog coordinates of the MySQL instance source collected in the last sampling; for PostgreSQL, sync delay refers to the gap between the LSN of the current source and the latest LSN of the PostgreSQL instance source collected in the last sampling. | 205 |
Kafka - records_lag max | The maximum of kafka-lag-max (the difference of Kafka producer and consumer offsets) reported by the TaskManager. | 100 |
Kafka - records_lag min | The minimum of kafka-lag-max (the difference of Kafka producer and consumer offsets) reported by the TaskManager. | 50 |
Kafka - records_lag mean | The mean of kafka-lag-max (the difference of Kafka producer and consumer offsets) reported by the TaskManager. | 80 |
Kafka - records_lag sum | The sum of kafka-lag-max (the difference of Kafka producer and consumer offsets) reported by the TaskManager. | 500 |
CurrentFetchEventtimeLag (ms) | Formula: FetchTime (the time the source fetches the data) − EventTime (data event time). This metric reflects the retention of data in the external system. | 10 |
CurrentEmitEventtimeLag (ms) | Formula: EmitTime (the time the data leaves the source) − EventTime (data event time). This metric reflects the retention of data between the external system and the Source. | 20 |
taskmanager_job_task_backpressuredtimemspersecond (%) | The maximum of all subtask backpressure percentages in the job. | 30% |
taskmanager_job_task_dataskewcoefficient | This metric is the coefficient of variation (= standard deviation/mean) of subtask inputs of each job. A value less than 10% represents a weak skew. | 10% |
Last updated:2023-11-07 17:56:22


metrics.reporters: promgatewaymetrics.reporter.promgateway.host: ${Prometheus PushGateway IP}metrics.reporter.promgateway.port: ${Prometheus PushGateway port}
metrics.reporter.promgateway.needBasicAuth: truemetrics.reporter.promgateway.password: ${Prometheus password}
job_numberoffailedcheckpoints, for example, and display the configured alarm policy in TencentCloud Managed Service for Prometheus, follow these steps:job_numberoffailedcheckpoints) on the dashboard.
instance_id="$InstanceId". If filters are required, enter specific values in { }, such as instance_id="cql-abcd0012".{{ $labels.job_id }}, and the value of the query statement can be expressed as {{ $value }}.Last updated:2023-11-07 17:45:54
Last updated:2023-11-07 17:13:06
job-running-log/.DEBUG, INFO, WARN, and ERROR. After a log level is set, the logs of the job will be output at this level. If no log level is available for selection, submit a ticket to upgrade your cluster first.DEBUG, INFO, WARN, and ERROR), and click Confirm. After this change, the logs of these jobs will be output at the new level. If no log level is available for selection, submit a ticket to upgrade your cluster first.Last updated:2023-11-07 17:52:44
from RUNNING to FAILED to identify the direct cause of a job crash, and the information following Caused by in the stack trace represents the failure details.java.lang.OutOfMemoryError appears, it is probably that OOM has occurred in the heap memory. In this case, you need to increase the operator parallelism (CUs) of the job and optimize the memory usage to avoid OOM.exit code OR shutting down JVM OR fatal OR kill OR killing
fatal.declined represents a checkpoint failure due to resource unavailability (the job is not running), the existence of FINISHED operators, checkpoint timeout, incomplete checkpoint files, or other reasons.Checkpoint was declinedCheckpoint was canceledCheckpoint expiredjob has failedTask has failedFailure to finalize
Timeout expired while fetching topic metadata for Kafka represents an initialization timeout, and Communications link failure for MySQL represents disconnection (which may be a client timeout due to no data inflow for a long period).java.util.concurrent.TimeoutExceptiontimeoutfailuretimed outfailed
Exception indicates that an exception may have occurred. For example, the start logs of a Flink job in the following figure indicates that the job fails to be submitted due to an exception. Search by Exception will display specific exceptions following Caused by in the stack traces at all levels.Exception can be found by search due to keyword segmentation rules.WARN or ERROR, where many results may be found. Please filter the information as needed. For example, some logs may contain WARN and ERROR themselves and do not represent errors.WARN org.apache.flink.core.plugin.PluginConfig - The plugins directory [plugins] does not exist.WARN org.apache.flink.shaded.zookeeper3.org.apache.zookeeper.ClientCnxn - SASL configuration failed: javax.security.auth.login.LoginException: No JAAS configuration section named 'Client' was found in specified JAAS configuration file: '/tmp/jaas-00000000.conf'. Will continue connection to Zookeeper server without SASL authentication, if Zookeeper server allows it.ERROR org.apache.flink.shaded.curator4.org.apache.curator.ConnectionState - Authentication failedWARN org.apache.hadoop.util.NativeCodeLoader - Unable to load native-hadoop library for your platform... using builtin-java classes where applicableWARN org.apache.flink.kubernetes.utils.KubernetesInitializerUtils - Ship directory /data/workspace/.../shipFiles is not exists. Ignoring it.WARN org.apache.flink.configuration.GlobalConfiguration - Error while trying to split key and value in configuration file /opt/flink-1.11.0/conf/flink-conf.yamlWARN org.apache.flink.shaded.curator4.org.apache.curator.utils.ZKPaths - The version of ZooKeeper being used doesn't support Container nodes. CreateMode.PERSISTENT will be used instead.WARNING: Unable to load JDK7 types (annotations, java.nio.file.Path): no Java7 support added
Last updated:2023-11-07 16:38:39
RUNNING to RESTARTING or FAILED), a job running failure event will be generated. If the job is RUNNING again, a failed job recovery event will be generated.Last updated:2023-11-07 16:40:32

FAILED as its final status.COMPLETED as its final status.Last updated:2023-11-07 16:48:29
RUNNING to FAILED or RESTARTING. Later, the Flink JobManager will recover the job in about 10s, with the running instance ID after recovery remaining unchanged.restart-strategy.fixed-delay.attempts and defaults to 5, and we recommend you increase it in a production environment) given in the Restart Policies. This will result in the exit of both the JobManager and the TaskManagers, and the system will try to recover the job from the last successful checkpoint within about 2 minutes, with the running instance ID after recovery increased by 1.RUNNING, a failed job recovery event will be generated, indicating the end of this event.from RUNNING to FAILED contain the direct causes of the job failure. We recommend you analyze the issue based on these error messages together with the logs of the JobManager and the TaskManagers.Last updated:2023-11-07 16:57:54
Status Code | Possible Cause | Solution |
137 | The memory occupied by the job exceeded the memory quota of the Pod, and the Pod was killed due to OOM. | Increase the operator parallelism and the Task Manager spec (CUs) as instructed in Configuring Job Resources. |
-1 | This is the code of the basic policy, indicating that the Pod has exited, but no exit code is returned due to system errors or other reasons. | Submit a ticket to contact the technicians for help. |
0 | During the startup process, the Pod cannot assign IPs in the associated subnet (no IPs available, for example), resulting in startup failure and exit. | Check whether available IPs are sufficient in the VPC subnet associated with the cluster. If yes, submit a ticket to contact the technicians for help. |
1 | An exception occurred during Flink initialization, resulting in startup failure. | This is generally caused by basic conflicts or overwriting of critical configuration files. You can search logs by Could not start cluster entrypoint and view relevant exceptions. |
2 | A fatal error occurred during the startup of the Flink JobManager. | Search logs by Fatal error occurred in the cluster entrypoint and view relevant exceptions. |
239 | An uncaptured fatal error occurred in Flink execution threads. | Search logs by produced an uncaught exception. Stopping the process and other keywords and view relevant exceptions. |
Last updated:2023-11-07 16:34:40
Status Code | Possible Cause | Solution |
137 | The memory occupied by the job exceeded the memory quota of the Pod, and the Pod was killed due to OOM. | This may be caused by inappropriate implementation of the source connector, with high memory pressure on the JobManager. |
-1 | This is the code of the basic policy, indicating that the Pod has exited, but no exit code is returned due to system errors or other reasons. | Submit a ticket to contact the technicians for help. |
0 | During the startup process, the Pod cannot assign IPs in the associated subnet (no IPs available, for example), resulting in startup failure and exit. | Check whether available IPs are sufficient in the VPC subnet associated with the cluster. If yes, submit a ticket to contact the technicians for help. |
1 | An exception occurred during Flink initialization, resulting in startup failure. | This is generally caused by basic conflicts or overwriting of critical configuration files. You can search logs by Could not start cluster entrypoint and view relevant exceptions. |
2 | A fatal error occurred during the startup of the Flink JobManager. | Search logs by Fatal error occurred in the cluster entrypoint and view relevant exceptions. |
239 | An uncaptured fatal error occurred in Flink execution threads. | Search logs by produced an uncaught exception. Stopping the process and other keywords and view relevant exceptions. |
Last updated:2025-04-15 16:20:33
taskmanager.memory.managed.size to a smaller value to increase the available heap memory. However, you must make adjustments under the guidance of an expert who fully understands the memory allocation mechanisms in Flink. Otherwise, this operation probably poses other issues.OutOfMemoryError: Java heap space or similar keywords are found in the job crash logs, you can enable the feature of Collecting Pod Crash Events, and set -XX:+HeapDumpOnOutOfMemoryError as described in the document, so that the local heap dump can be captured in time for analysis in case of an OOM crash of the job.OutOfMemoryError: Java heap space is not found in the logs, and the job is properly running, we recommend you configure alarms for the job, and add job failure event in the alarm rules of Stream Compute Service to timely receive job failure event pushes.Last updated:2023-11-08 10:20:59
rest.flamegraph.enabled: true to the advanced parameters of the job as instructed in Advanced Job Parameters, and publish the new job version to use flame graphs.


Last updated:2023-11-07 16:23:00
Backpressued in the figure) lower than the threshold but a busyness (Busy in the figure) higher than 50%. This operator is generally the root cause of the back pressure, whose data processing rate is relatively slow. If you view the Flink Web UI of the job as instructed here at this moment, you will see a series of gray operators followed by a red operator.OceanusBackpressureHigh and OceanusBackpressureTooHigh are two different alarm events. If you only care about a severe back pressure event that affects the job running, you can set an alarm for OceanusBackpressureTooHigh only.rest.flamegraph.enabled: true to the advanced parameters of the job as instructed in Advanced Job Parameters, and publish the new job version to use flame graphs.
Last updated:2023-11-07 15:38:00
Last updated:2023-11-07 15:43:23
scan.incremental.snapshot.chunk.size to a larger value) to avoid the JobManager heap memory from being used up due to too many shards.OutOfMemoryError: Java heap space is not found in the logs, and the job is properly running, we recommend you configure alarms for the job, and add job failure event in the alarm rules of Stream Compute Service to timely receive job failure event pushes.Last updated:2023-11-07 16:29:28
[_dc] and the default database [_db] are there.
On the Database/Table references page, select Create > Create database in the top right corner, select a catalog and enter a database name in the pop-up window, and click Confirm**.${variable name}:default value}, such as ${job_name}:job_test.connector andversion attributes.dc.db.test_table. If parameters are used in the metadata table creation statements, click Replace table variables to replace parameters with actual values.Last updated:2023-11-07 16:25:49
${variable name}:default value_ is used as the separator in a variable name.Last updated:2023-11-07 16:26:48
Flink Version | Description |
1.11 | Not supported |
1.13 | Hive v2.2.0, v2.3.2, v2.3.5, and v3.1.1 supported |
1.14 | Not supported |
hive --service metastore: Activate the Hive metastore service.ps -ef|grep metastore: Check whether the service is successfully activated._dc directory, and click Create Hive catalog.
Upload the configuration files hive-site.xml (adding urls to it), hdfs-site.xml, hivemetastore-site.xml, and hiveserver2-site.xml (download them here).catalog_name.database_name.CREATE DATABASE IF NOT EXISTS `hiveCatalogName`.`databaseName`;
catalog_name.database_name.table_name.CREATE TABLE IF NOT EXISTS `hiveCatalogName`.`databaseName`.`tableName` (user_id INT,item_id INT,category_id INT,-- ts AS localtimestamp,-- WATERMARK FOR ts AS ts,behavior VARCHAR) WITH ('connector' = 'datagen','rows-per-second' = '1', -- The number of records generated per second'fields.user_id.kind' = 'sequence', -- Whether a bounded sequence (if yes, the output automatically stops after the sequence ends)'fields.user_id.start' = '1', -- The start value of the sequence'fields.user_id.end' = '10000', -- The end value of the sequence'fields.item_id.kind' = 'random', -- A random number without range'fields.item_id.min' = '1', -- The minimum random number'fields.item_id.max' = '1000', -- The maximum random number'fields.category_id.kind' = 'random', -- A random number without range'fields.category_id.min' = '1', -- The minimum random number'fields.category_id.max' = '1000', -- The maximum random number'fields.behavior.length' = '5' -- Random string length);
INSERT INTO`hiveCatalogName`.`databaseName`.`sink_tableName`SELECT*FROM`hiveCatalogName`.`databaseName`.`source_tableName`;
useradd flinkgroupadd supergroupusermod -a -G supergroup flinkhdfs dfsadmin -refreshUserToGroupsMappings
hive-site.xml:<property><name>hive.metastore.authorization.storage.checks</name><value>true</value><description>Should the metastore do authorization checks againstthe underlying storage for operations like drop-partition (disallowthe drop-partition if the user in question doesn't have permissionsto delete the corresponding directory on the storage).</description><property>
Last updated:2023-11-08 10:16:47
state.checkpoints.num-retained in the advanced parameters.Last updated:2023-11-07 15:50:37
Last updated:2023-11-07 15:52:47
Last updated:2023-11-07 15:51:30
Field | Description |
Cluster name | A user-defined name. |
Cluster ID | The unique identification of the cluster, automatically generated by the system. |
Cluster status | The current status of the cluster. |
Cluster description | A user-defined description that helps identify the cluster. |
Computer resources (CU) | The idle/total CUs in the cluster. |
Region/AZ | The region/AZ where the cluster resides. |
VPC | The VPC and subnet associated with the cluster. Stream Compute Service connects a private cluster with your VPC through ENI to access resources and services in this network environment. |
COS | The COS bucket associated with the cluster during its creation. |
Logging | The CLS logsets and log topics associated with the cluster during its creation. |
Tag | The tags attached to the cluster. |
Billing mode | Monthly subscription is supported. |
Flink version | The Flink version used on the cluster. |
Creation time | The cluster creation time. |
DNS | The DNS information of the cluster. |
Flink UI access policy | You can set a Flink UI access policy. If no access IP allowlist is set, Flink UI is accessible to all public IPs. |
Last updated:2023-11-07 15:46:05
Last updated:2023-11-07 15:48:27
Last updated:2023-11-07 15:47:27
Last updated:2023-11-07 15:48:54
Last updated:2023-11-07 15:44:49
172.17.0.2) with kafka.example.com.172.17.0.2 kafka.example.com172.17.0.3 mysql.example.com
172.17.0.253 and 172.17.0.254. Your requests in a job to access any domain in the form of *.example.com will be resolved using your DNS server. If you set the mapping of 172.17.0.2 kafka.example.com in your DNS server, requests to access kafka.example.com will be resolved to 172.17.0.2.example.com {forward . 172.17.0.253 172.17.0.254}
Last updated:2023-11-07 15:45:14
Last updated:2023-11-08 10:18:09
Last updated:2023-11-08 10:18:35
QcloudOceanusFullAccess in the CAM console as instructed in Authorization Management. After the sub-account is associated with the policy QcloudOceanusFullAccess, it will have access to Stream Compute Service. For details, see CAM.QcloudCamRoleFullAccess, and a sub-user with QcloudCamSubaccountsAuthorizeRoleFullAccess can perform this operation for themselves.Oceanus_QCSRole role created successfully, the underlying system services of Stream Compute Service still cannot play the Oceanus_QCSRole role.cam:PassRole permission.{"version": "2.0","statement": [{"effect": "allow","action": "cam:PassRole","resource": "qcs::cam::uin/${OwnerUin}:roleName/Oceanus_QCSRole"}]}
Last updated:2023-11-08 10:16:06
Permission | Super Admin | Space Admin | Developer | Guest |
Create/Terminate cluster | ✔️ | ❌ | ❌ | ❌ |
Modify cluster info | ✔️ | ❌ | ❌ | ❌ |
Renew/Upgrade cluster | ✔️ | ❌ | ❌ | ❌ |
View cluster | ✔️ | ✔️ | ✔️ | ✔️ |
Add/Delete space | ✔️ | ❌ | ❌ | ❌ |
Modify space attribute | ✔️ | ❌ | ❌ | ❌ |
Associate/Disassociate cluster with/from space | ✔️ | ❌ | ❌ | ❌ |
Add/Delete space member | ✔️ | ✔️ | ❌ | ❌ |
Modify space member role | ✔️ | ✔️ | ❌ | ❌ |
Edit super admin | ✔️ | ❌ | ❌ | ❌ |
Create/Delete job | ✔️ | ✔️ | ✔️ | ❌ |
Run/Stop job | ✔️ | ✔️ | ✔️ | ❌ |
Develop/Test job | ✔️ | ✔️ | ✔️ | ❌ |
Monitor alarm | ✔️ | ✔️ | ✔️ | ❌ |
View job | ✔️ | ✔️ | ✔️ | ✔️ |
Create/Delete dependency | ✔️ | ✔️ | ✔️ | ❌ |
Edit dependency | ✔️ | ✔️ | ✔️ | ❌ |
View dependency | ✔️ | ✔️ | ✔️ | ✔️ |
Create/Delete metadatabase | ✔️ | ✔️ | ✔️ | ❌ |
Create/Delete metadata table | ✔️ | ✔️ | ✔️ | ❌ |
View metadata | ✔️ | ✔️ | ✔️ | ✔️ |
Operate directory | ✔️ | ✔️ | ✔️ | ❌ |