Using Spring Boot Actuator to Collect TencentDB for Redis® Performance Data
Baixar
Modo Foco
Tamanho da Fonte
Spring Boot Actuator is a tool provided by Spring Boot for monitoring and managing Spring Boot applications. It exposes runtime information about the application through a series of predefined endpoints, including health status, configuration properties, measurement metrics, and thread dumps. These endpoints can be accessed through HTTP APIs or Java Management Extensions (JMX), assisting developers and Ops personnel in quickly understanding the operation status of applications and performing troubleshooting and performance optimization. This practice tutorial introduces how to expose latency data through Spring Boot Actuator and use monitoring components such as Prometheus and Grafana to monitor the TencentDB for Redis® command latency from the client.
Configuring the Spring Boot Actuator Component Dependency
Actuator is deeply integrated with Spring Boot and ready to use. Just introduce the Spring Boot Actuator dependency to the `pom.xml` file of the project, as shown below.
<!-- Spring Boot Actuator --><dependency><groupId>org.springframework.boot</groupId><artifactId>spring-boot-starter-actuator</artifactId><version>2.4.1</version></dependency><!-- Micrometer Prometheus Registry --><dependency><groupId>io.micrometer</groupId><artifactId>micrometer-registry-prometheus</artifactId></dependency>
Configuring Exposing Endpoints
In Spring Boot 2.x and later versions, when Spring Data Redis and the Lettuce client are used, Lettuce is automatically integrated with Micrometer and starts collecting metrics. If the Actuator dependency is introduced, simply expose the `metrics` and `prometheus` endpoints in the configuration file to complete the monitoring and exposure of Lettuce metrics. Add the endpoints to be exposed in the configuration file application.properties of the project, as shown below.
/actuator/health: displays the overall health status of the application. Customizing the health metrics is supported.
/actuator/info: displays custom application information such as version and description.
/actuator/metrics: provides various running metrics such as memory, CPU, and HTTP request statistics.
/actuator/prometheus: exposes monitoring data to Prometheus. Prometheus can periodically capture measurement metrics applied in Spring Boot.
management.endpoints.web.exposure.include=health,info,metrics,prometheus
Using CURL to Pull Endpoint Data
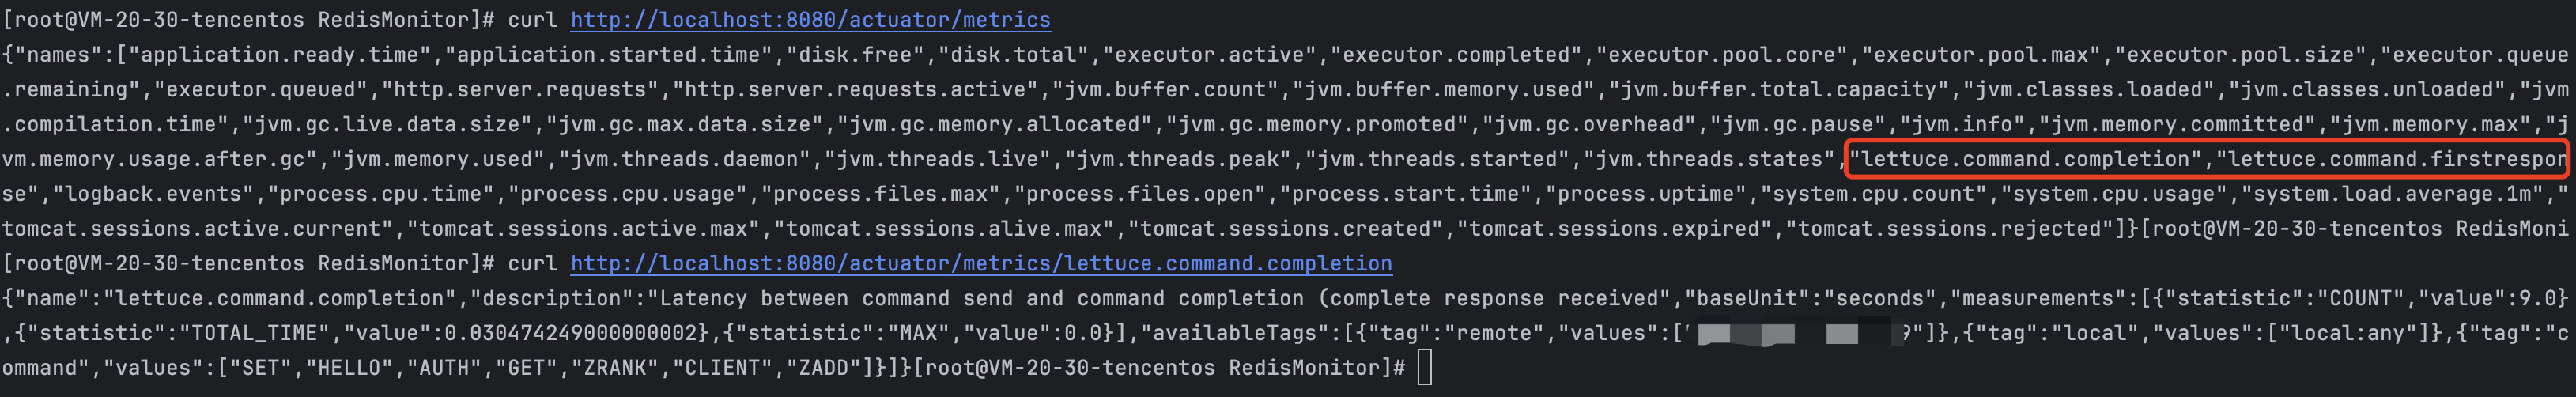
Pull the metrics endpoint by running the `curl` command to view the performance metrics reported by Lettuce.
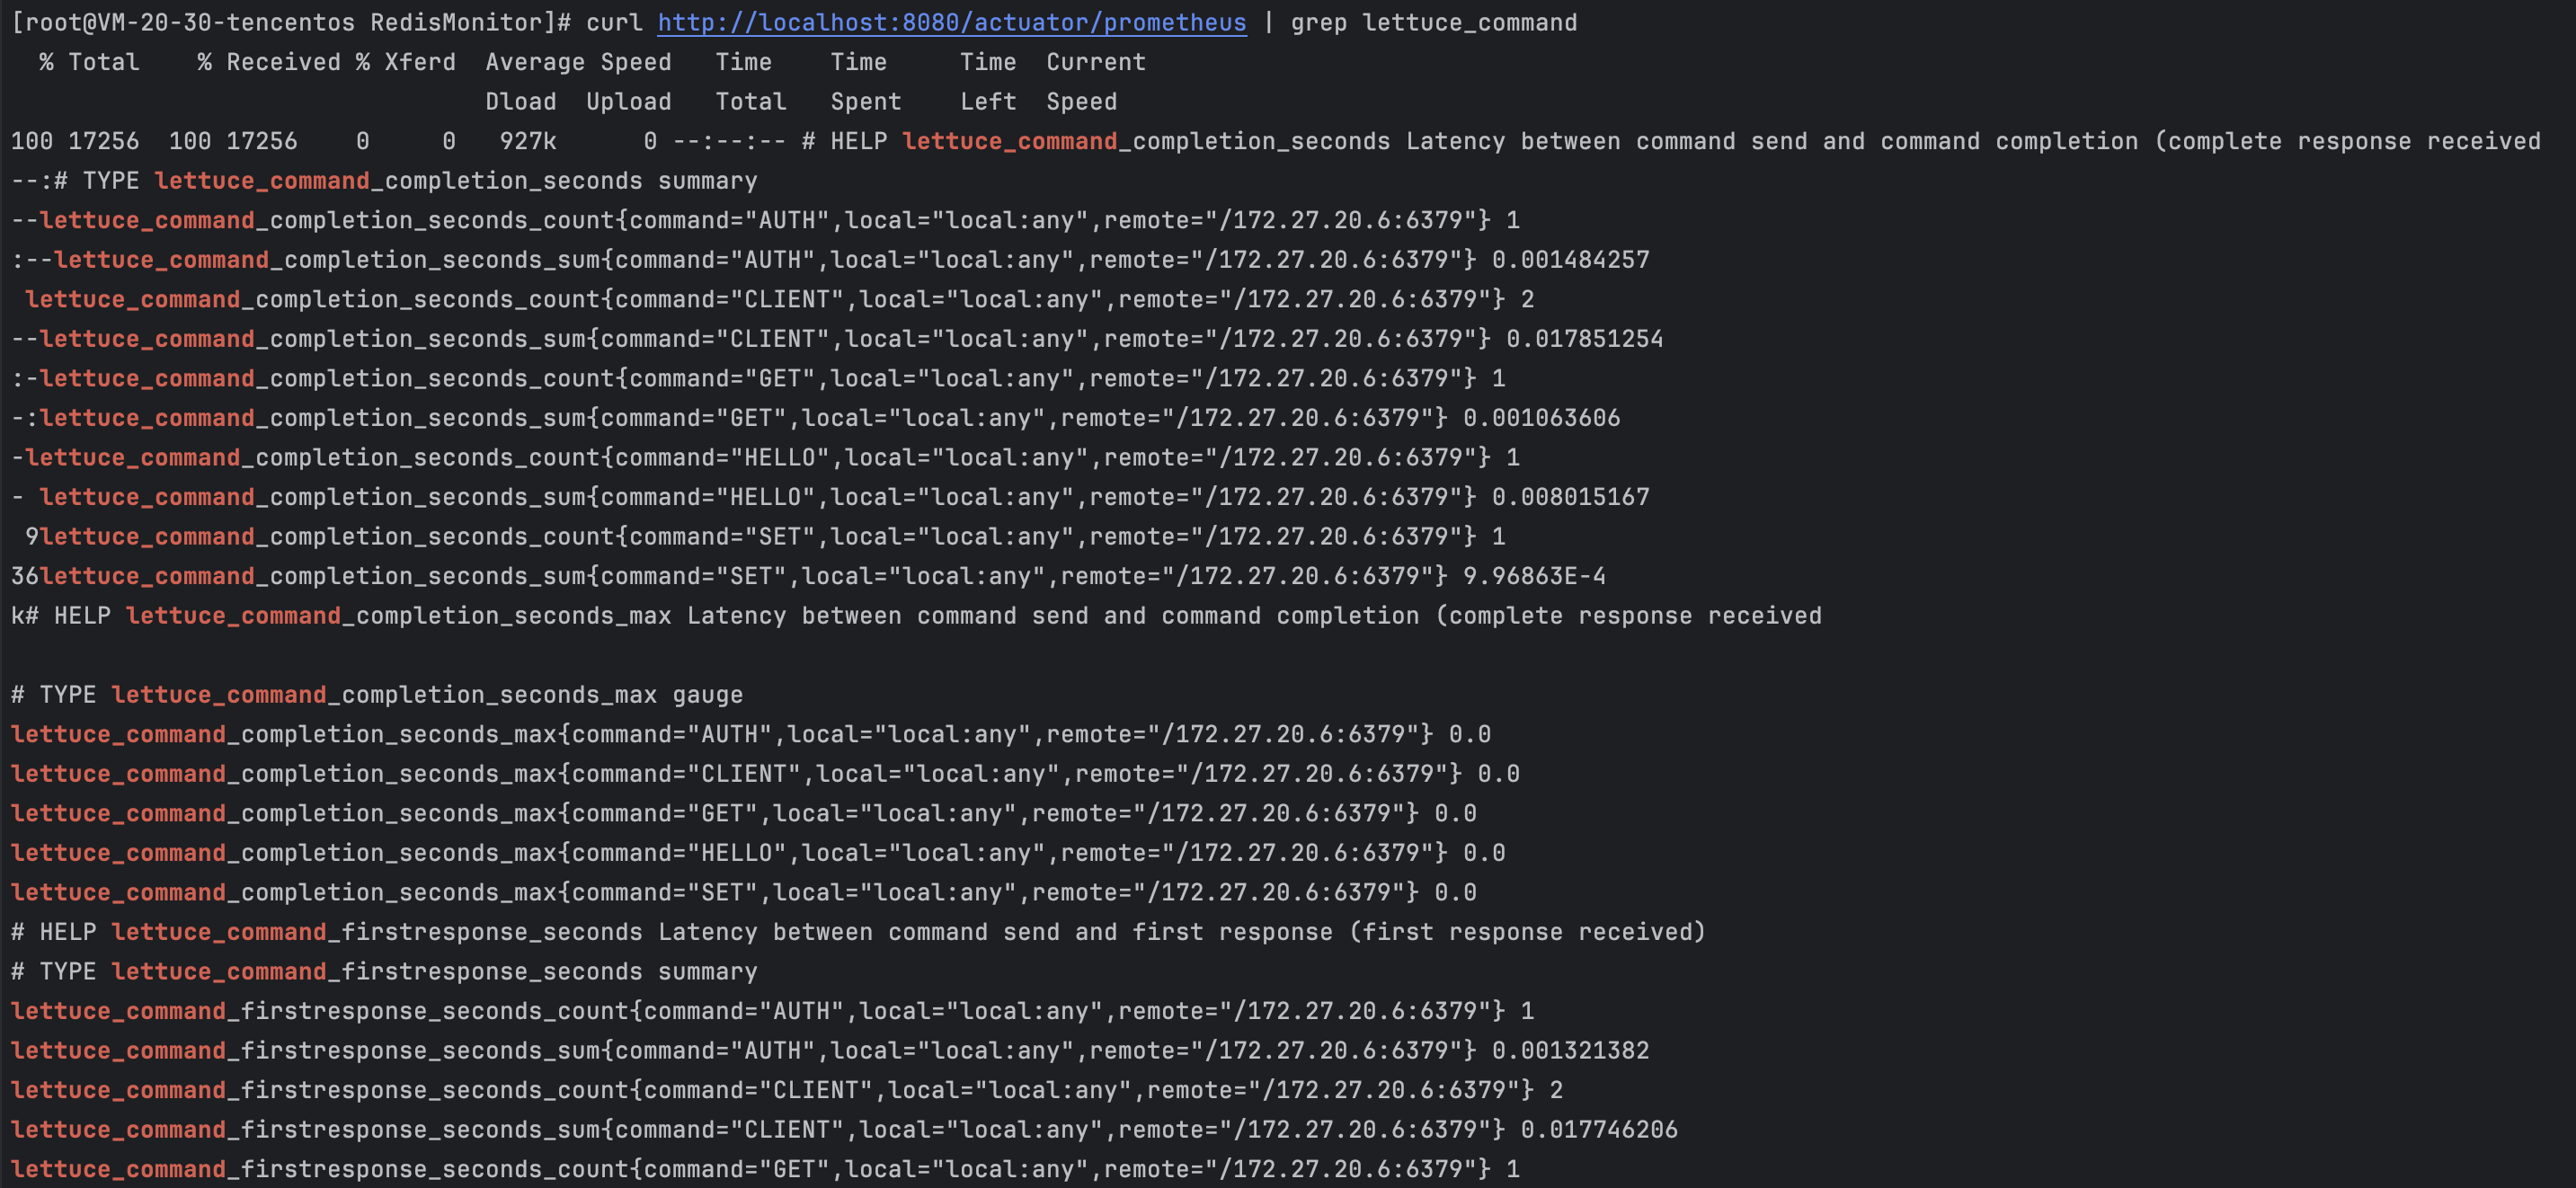
Make a request to the Prometheus endpoint by running the `curl` command to view the data reported in the Prometheus format. Due to the large data volume, the following example filters the results to display only the metric data related to Lettuce.
Ajuda e Suporte
Esta página foi útil?
Você também pode entrar em contato com a Equipe de vendas ou Enviar um tíquete em caso de ajuda.
comentários