tencent cloud

Tencent Cloud Observability Platform

Release Notes and Announcements
Release Notes
Product Introduction
Overview
Strengths
Basic Features
Basic Concepts
Use Cases
Use Limits
Purchase Guide
Tencent Cloud Product Monitoring
Application Performance Management
Mobile App Performance Monitoring
Real User Monitoring
Cloud Automated Testing
Prometheus Monitoring
Grafana
EventBridge
PTS
Quick Start
Monitoring Overview
Instance Group
Tencent Cloud Product Monitoring
Application Performance Management
Real User Monitoring
Cloud Automated Testing
Performance Testing Service
Prometheus Getting Started
Grafana
Dashboard Creation
EventBridge
Alarm Service
Cloud Product Monitoring
Tencent Cloud Service Metrics
Operation Guide
CVM Agents
Cloud Product Monitoring Integration with Grafana
Troubleshooting
Practical Tutorial
Application Performance Management
Product Introduction
Access Guide
Operation Guide
Practical Tutorial
Parameter Information
FAQs
Mobile App Performance Monitoring
Overview
Operation Guide
Access Guide
Practical Tutorial
Tencent Cloud Real User Monitoring
Product Introduction
Operation Guide
Connection Guide
FAQs
Cloud Automated Testing
Product Introduction
Operation Guide
FAQs
Performance Testing Service
Overview
Operation Guide
Practice Tutorial
JavaScript API List
FAQs
Prometheus Monitoring
Product Introduction
Access Guide
Operation Guide
Practical Tutorial
Terraform
FAQs
Grafana
Product Introduction
Operation Guide
Guide on Grafana Common Features
FAQs
Dashboard
Overview
Operation Guide
Alarm Management
Console Operation Guide
Troubleshooting
FAQs
EventBridge
Product Introduction
Operation Guide
Practical Tutorial
FAQs
Report Management
FAQs
General
Alarm Service
Concepts
Monitoring Charts
CVM Agents
Dynamic Alarm Threshold
CM Connection to Grafana
Documentation Guide
Related Agreements
Application Performance Management Service Level Agreement
APM Privacy Policy
APM Data Processing And Security Agreement
RUM Service Level Agreement
Mobile Performance Monitoring Service Level Agreement
Cloud Automated Testing Service Level Agreement
Prometheus Service Level Agreement
TCMG Service Level Agreements
PTS Service Level Agreement
PTS Use Limits
Cloud Monitor Service Level Agreement
API Documentation
History
Introduction
API Category
Making API Requests
Monitoring Data Query APIs
Alarm APIs
Legacy Alert APIs
Notification Template APIs
TMP APIs
Grafana Service APIs
Event Center APIs
TencentCloud Managed Service for Prometheus APIs
Monitoring APIs
Data Types
Error Codes
Glossary

Creating Alerting Rule

PDF
Modo Foco
Tamanho da Fonte
Última atualização: 2024-11-01 09:54:06
This document describes how to create an alerting rule in the TMP console. With such a rule, you will receive notifications when some metrics are exceptional, so that you can take corresponding measures promptly.

Prerequisites

You have created a TMP instance.
You have had a cluster associated or integrations installed in Integration Center.

Directions

For more information on alerting rule, please see Alerting Rule Description.
1. Log in to the TMP console.
2. In the instance list, select the corresponding Prometheus instance, click Alarm Management in the top menu bar, and enter the Alerting Rule page.
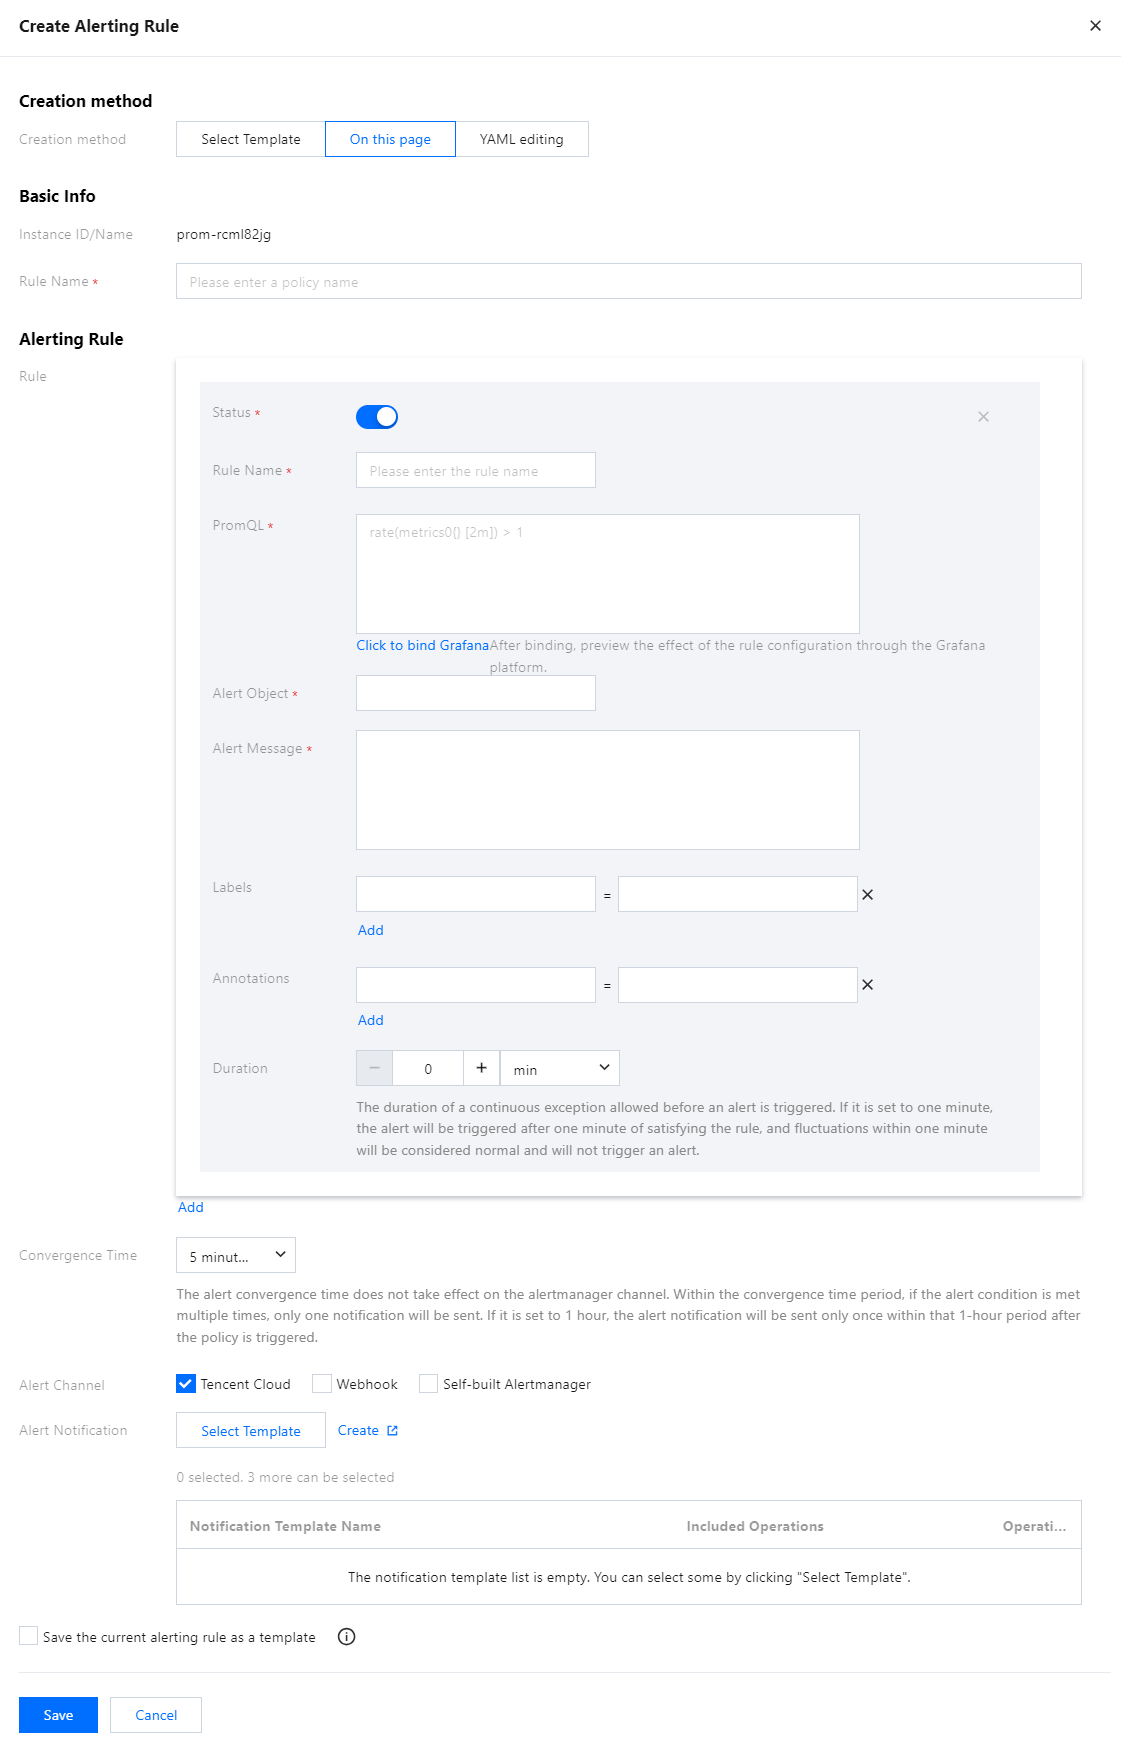
3. In the alert strategy page, click Create Alerting Rule and configure the alert strategy information in the pop-up.
4. Creation methods include: Select Template, On this page, and YAML editing. The following example uses On this page.
Instance ID/Name: Displayed by default. Users do not need to fill in this field.
Rule Name: Custom Definition Name.
Rule: Alarm rule group. Multiple rules can be added.
Rule Name: Custom name.
PromQL: Users can use the default template or customize it. It represents the alarm trigger condition based on the PromQL expression and is used to determine if any time series meets the condition.
Alert Object (Summary): Users can customize the alarm title.
Alert Message (Description): Users can use the default template or customize it.
Labels: Tags. Users can use default or custom tags. Users can specify a set of tags and attach them to alarms, and corresponding handling methods can be matched based on tags in the received alarms.
Annotations: Annotations. Users can use default or custom annotations. The annotations indicate additional alarm information.
Duration: Users can use the default duration or specify the duration. It indicates the time period after which an alarm is sent once the trigger condition is met.
Convergence Time: An alarm is triggered every 5 minutes by default, but users can specify the alarm notification sending frequency.
Alert Channel: You can choose Tencent Cloud alert channels, webhook alert channels, or self-built alertmanager alert channels.
Alert Notification: Supports custom alarm notification templates, including template name, notification type, recipient, receiving channel, etc. For details, please see Notification Template.
Save the current alerting rule as a template: Users can save the alarm policy content configured on the current page as a template, which can be referenced later to quickly trigger alarms.


Ajuda e Suporte

Esta página foi útil?

comentários