MySQL Exporter 接入
下载
聚焦模式
字号
操作场景
MySQL Exporter 是社区专门为采集 MySQL/MariaDB 数据库监控指标而设计开发,通过 Exporter 上报核心的数据库指标,用于异常报警和监控大盘展示,腾讯云可观测平台 Prometheus 提供了与 MySQL Exporter 集成及开箱即用的 Grafana 监控大盘。
目前,Exporter 支持高于5.6版本的 MySQL 和高于10.1版本的 MariaDB。在 MySQL/MariaDB 低于5.6版本时,部分监控指标可能无法被采集。
说明:
接入方式
方式一:一键安装(推荐)
操作步骤
1. 登录 Prometheus 监控服务控制台。
2. 在实例列表中,选择并进入对应的 Prometheus 实例。
3. 在实例详情页,选择数据采集 > 集成中心。
4. 在集成中心找到并单击 MySQL,即会弹出一个安装窗口,在安装页面填写指标采集名称和地址等信息,并单击保存即可。
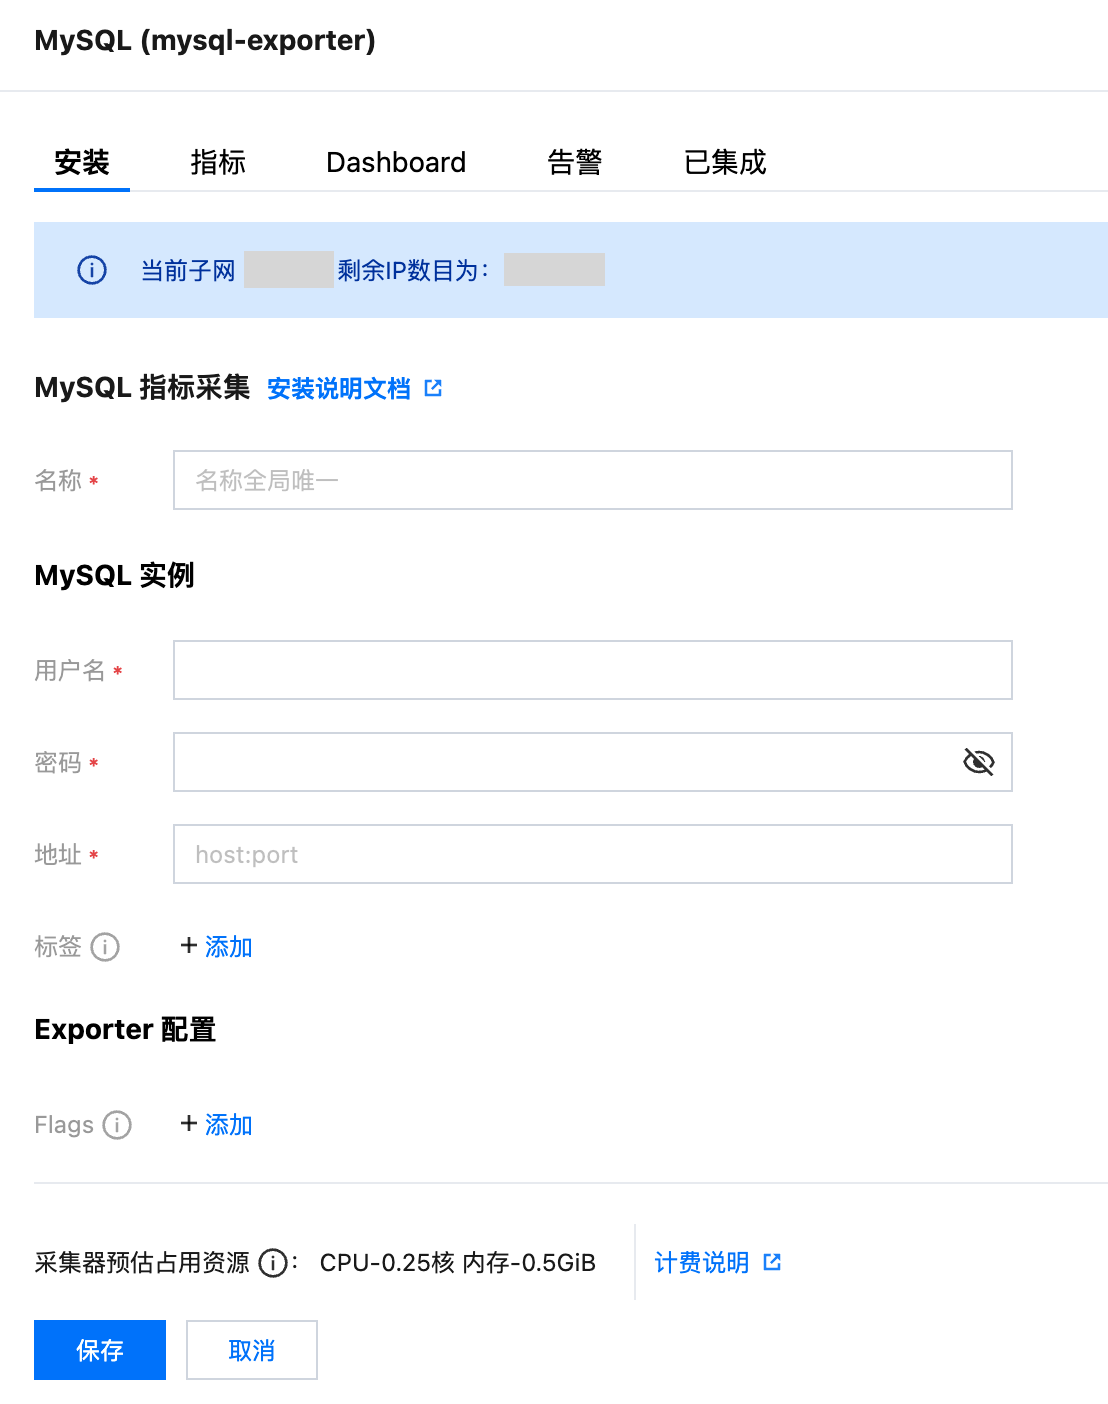
配置说明
参数 | 说明 |
名称 | 集成名称,命名规范如下: 名称具有唯一性。 名称需要符合下面的正则:'^[a-z0-9]([-a-z0-9]*[a-z0-9])?(\\.[a-z0-9]([-a-z0-9]*[a-z0-9])?)*$'。 |
用户名 | MySQL 的用户名称。 |
密码 | MySQL 的密码。 |
地址 | MySQL 的连接地址。 |
标签 | 给指标添加自定义 Label。 |
Exporter 配置 | auto_increment.columns:从 information_schema 采集 auto_increment 列和最大值。 binlog_size:采集所有已注册的 binlog 文件的当前大小。 engine_innodb_status:从 SHOW ENGINE INNODB STATUS 采集。 engine_tokudb_status:从 SHOW ENGINE TOKUDB STATUS 采集。 global_status:从 SHOW GLOBAL STATUS 采集,默认为 true。 global_variables:从 SHOW GLOBAL VARIABLES 采集,默认为 true。 info_schema.clientstats:如果使用 userstat=1 运行,则设置为 true 以采集客户端统计信息。 info_schema.innodb_metrics:从 information_schema.innodb_metrics 采集指标。 info_schema.innodb_tablespaces:从 information_schema.innodb_sys_tablespaces 采集指标。 info_schema.innodb_cmp:从 information_schema.innodb_cmp 采集 InnoDB 压缩表指标,默认为 true。 info_schema.innodb_cmpmem:从 information_schema.innodb_cmpmem 采集 InnoDB 缓冲池压缩指标(默认为 true)。 info_schema.processlist:从 information_schema.processlist 采集线程状态计数。 info_schema.query_response_time:如果 query_response_time_stats 为 ON,则采集查询响应时间分布(默认为 true)。 info_schema.tables:从 information_schema.tables 采集指标。 info_schema.tables.databases:用于收集表统计信息的数据库列表,逗号分隔,默认是 '*' 表示所有数据库。 info_schema.tablestats:如果使用 userstat=1 运行,则设置为 true 以采集表统计信息。 info_schema.schemastats:如果使用 userstat=1 运行,则设置为 true 以采集架构统计信息。 info_schema.userstats:如果使用 userstat=1 运行,则设置为 true 以采集用户统计信息。 perf_schema.eventsstatements:从 performance_schema.events_statements_summary_by_digest 采集指标。 perf_schema.eventsstatements.digest_text_limit:标准化语句文本的最大长度,默认值为120。 perf_schema.eventsstatements.limit:按响应时间限制事件语句摘要的数量,默认值为250。 perf_schema.eventsstatements.timelimit:限制 'last_seen' 事件语句的最大时间,单位为秒,默认值为86400。 perf_schema.eventsstatementssum:从 performance_schema.events_statements_summary_by_digest 汇总采集指标。 perf_schema.eventswaits:从 performance_schema.events_waits_summary_global_by_event_name 采集指标。 perf_schema.file_events:从 performance_schema.file_summary_by_event_name 采集指标。 perf_schema.file_instances:从 performance_schema.file_summary_by_instance采集指标。 perf_schema.indexiowaits:从 performance_schema.table_io_waits_summary_by_index_usage 采集指标。 perf_schema.tableiowaits:从 performance_schema.table_io_waits_summary_by_table 采集指标。 perf_schema.tablelocks:从 performance_schema.table_lock_waits_summary_by_table 采集指标。 perf_schema.replication_group_member_stats:从 performance_schema.replication_group_member_stats 采集指标。 perf_schema.replication_applier_status_by_worker:从 performance_schema.replication_applier_status_by_worker 采集指标。 slave_status:从 SHOW SLAVE STATUS 采集,默认为 true。 slave_hosts:从 SHOW SLAVE HOSTS 采集。 heartbeat:从 heartbeat 采集。 heartbeat.database:收集 heartbeat 数据的数据库,默认值为 heartbeat。 heartbeat.table:收集 heartbeat 数据的表,默认值为 heartbeat。 |
方式二:自定义安装
说明
前提条件
在 Prometheus 实例对应地域及私有网络(VPC)下,创建腾讯云容器服务 Kubernetes 集群,并为集群创建 命名空间。
在 Prometheus 监控服务控制台,选择并进入对应的 Prometheus 实例,在数据采集 > 集成容器服务中找到对应容器集群完成关联集群操作。可参见指引 关联集群。
操作步骤
步骤1:数据库授权
因为 MySQL Exporter 是通过查询数据库中状态数据来对其进行监控,所以需要为对应的数据库实例进行授权。账号和密码需根据实际情况而定,授权步骤如下:
1. 登录 云数据库 MySQL 控制台。
2. 在实例列表页面单击需要授权的数据库名称,进入数据库详情页。
3. 选择数据库管理 > 账号管理,进入账号管理页面,根据业务实际需要创建监控建立的账号。
4. 单击账号右侧操作项下的修改权限,修改对应权限。示例如下图所示:
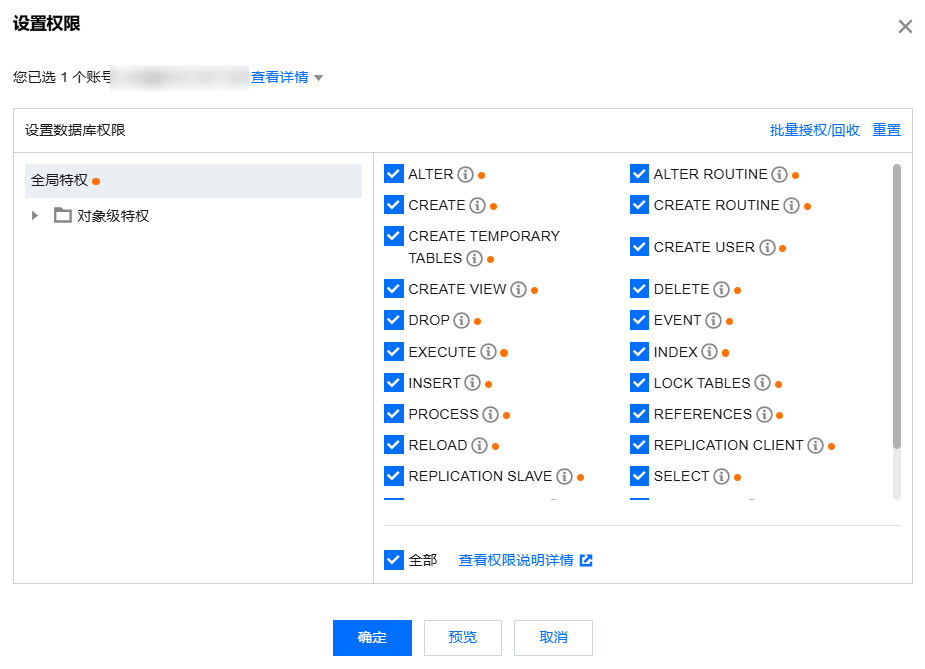
您也可以在您的云服务器中通过执行以下命令进行授权。
CREATE USER 'exporter'@'ip' IDENTIFIED BY 'password' WITH MAX_USER_CONNECTIONS 3;GRANT PROCESS, REPLICATION CLIENT, SELECT ON *.* TO 'exporter'@'ip';
说明
建议为该用户设置最大连接数限制,以避免因监控数据抓取对数据库带来影响。但并非所有的数据库版本中都可以生效,例如 MariaDB 10.1 版本不支持最大连接数设置,则无法生效。详情请参见 MariaDB 说明。
步骤2:Exporter 部署
1. 登录容器服务控制台。
2. 在左侧菜单栏选择集群。
3. 单击需要获取集群访问凭证的集群 ID/名称,进入该集群的管理页面。
4. 使用 Secret 管理 MySQL 连接串。
4.1 在左侧菜单中选择工作负载 > Deployment,进入 Deployment 页面。
4.2 在页面右上角单击 YAML 创建,创建 YAML 配置,配置说明如下:
使用 Kubernetes 的 Secret 来管理连接串,并对连接串进行加密处理,在启动 MySQL Exporter 的时候直接使用 Secret Key,需要调整对应的连接串,YAML 配置示例如下:
apiVersion: v1kind: Secretmetadata:name: mysql-secret-testnamespace: mysql-demotype: OpaquestringData:datasource: "user:password@tcp(ip:port)/" #对应 MySQL 连接串信息
5. 部署 MySQL Exporter。
apiVersion: apps/v1kind: Deploymentmetadata:labels:k8s-app: mysql-exporter # 根据业务需要调整成对应的名称,建议加上 MySQL 实例的信息name: mysql-exporter # 根据业务需要调整成对应的名称,建议加上 MySQL 实例的信息namespace: mysql-demospec:replicas: 1selector:matchLabels:k8s-app: mysql-exporter # 根据业务需要调整成对应的名称,建议加上 MySQL 实例的信息template:metadata:labels:k8s-app: mysql-exporter # 根据业务需要调整成对应的名称,建议加上 MySQL 实例的信息spec:containers:- env:- name: DATA_SOURCE_NAMEvalueFrom:secretKeyRef:name: mysql-secret-test # 对应上一步中的 Secret 的名称key: datasource # 对应上一步中的 Secret Keyimage: ccr.ccs.tencentyun.com/rig-agent/mysqld-exporter:v0.12.1imagePullPolicy: IfNotPresentname: mysql-exporterports:- containerPort: 9104name: metric-portterminationMessagePath: /dev/termination-logterminationMessagePolicy: FilednsPolicy: ClusterFirstimagePullSecrets:- name: qcloudregistrykeyrestartPolicy: AlwaysschedulerName: default-schedulersecurityContext: {}terminationGracePeriodSeconds: 30
6. 验证。
6.1 在 Deployment 页面单击上述步骤创建的 Deployment,进入 Deployment 管理页面。
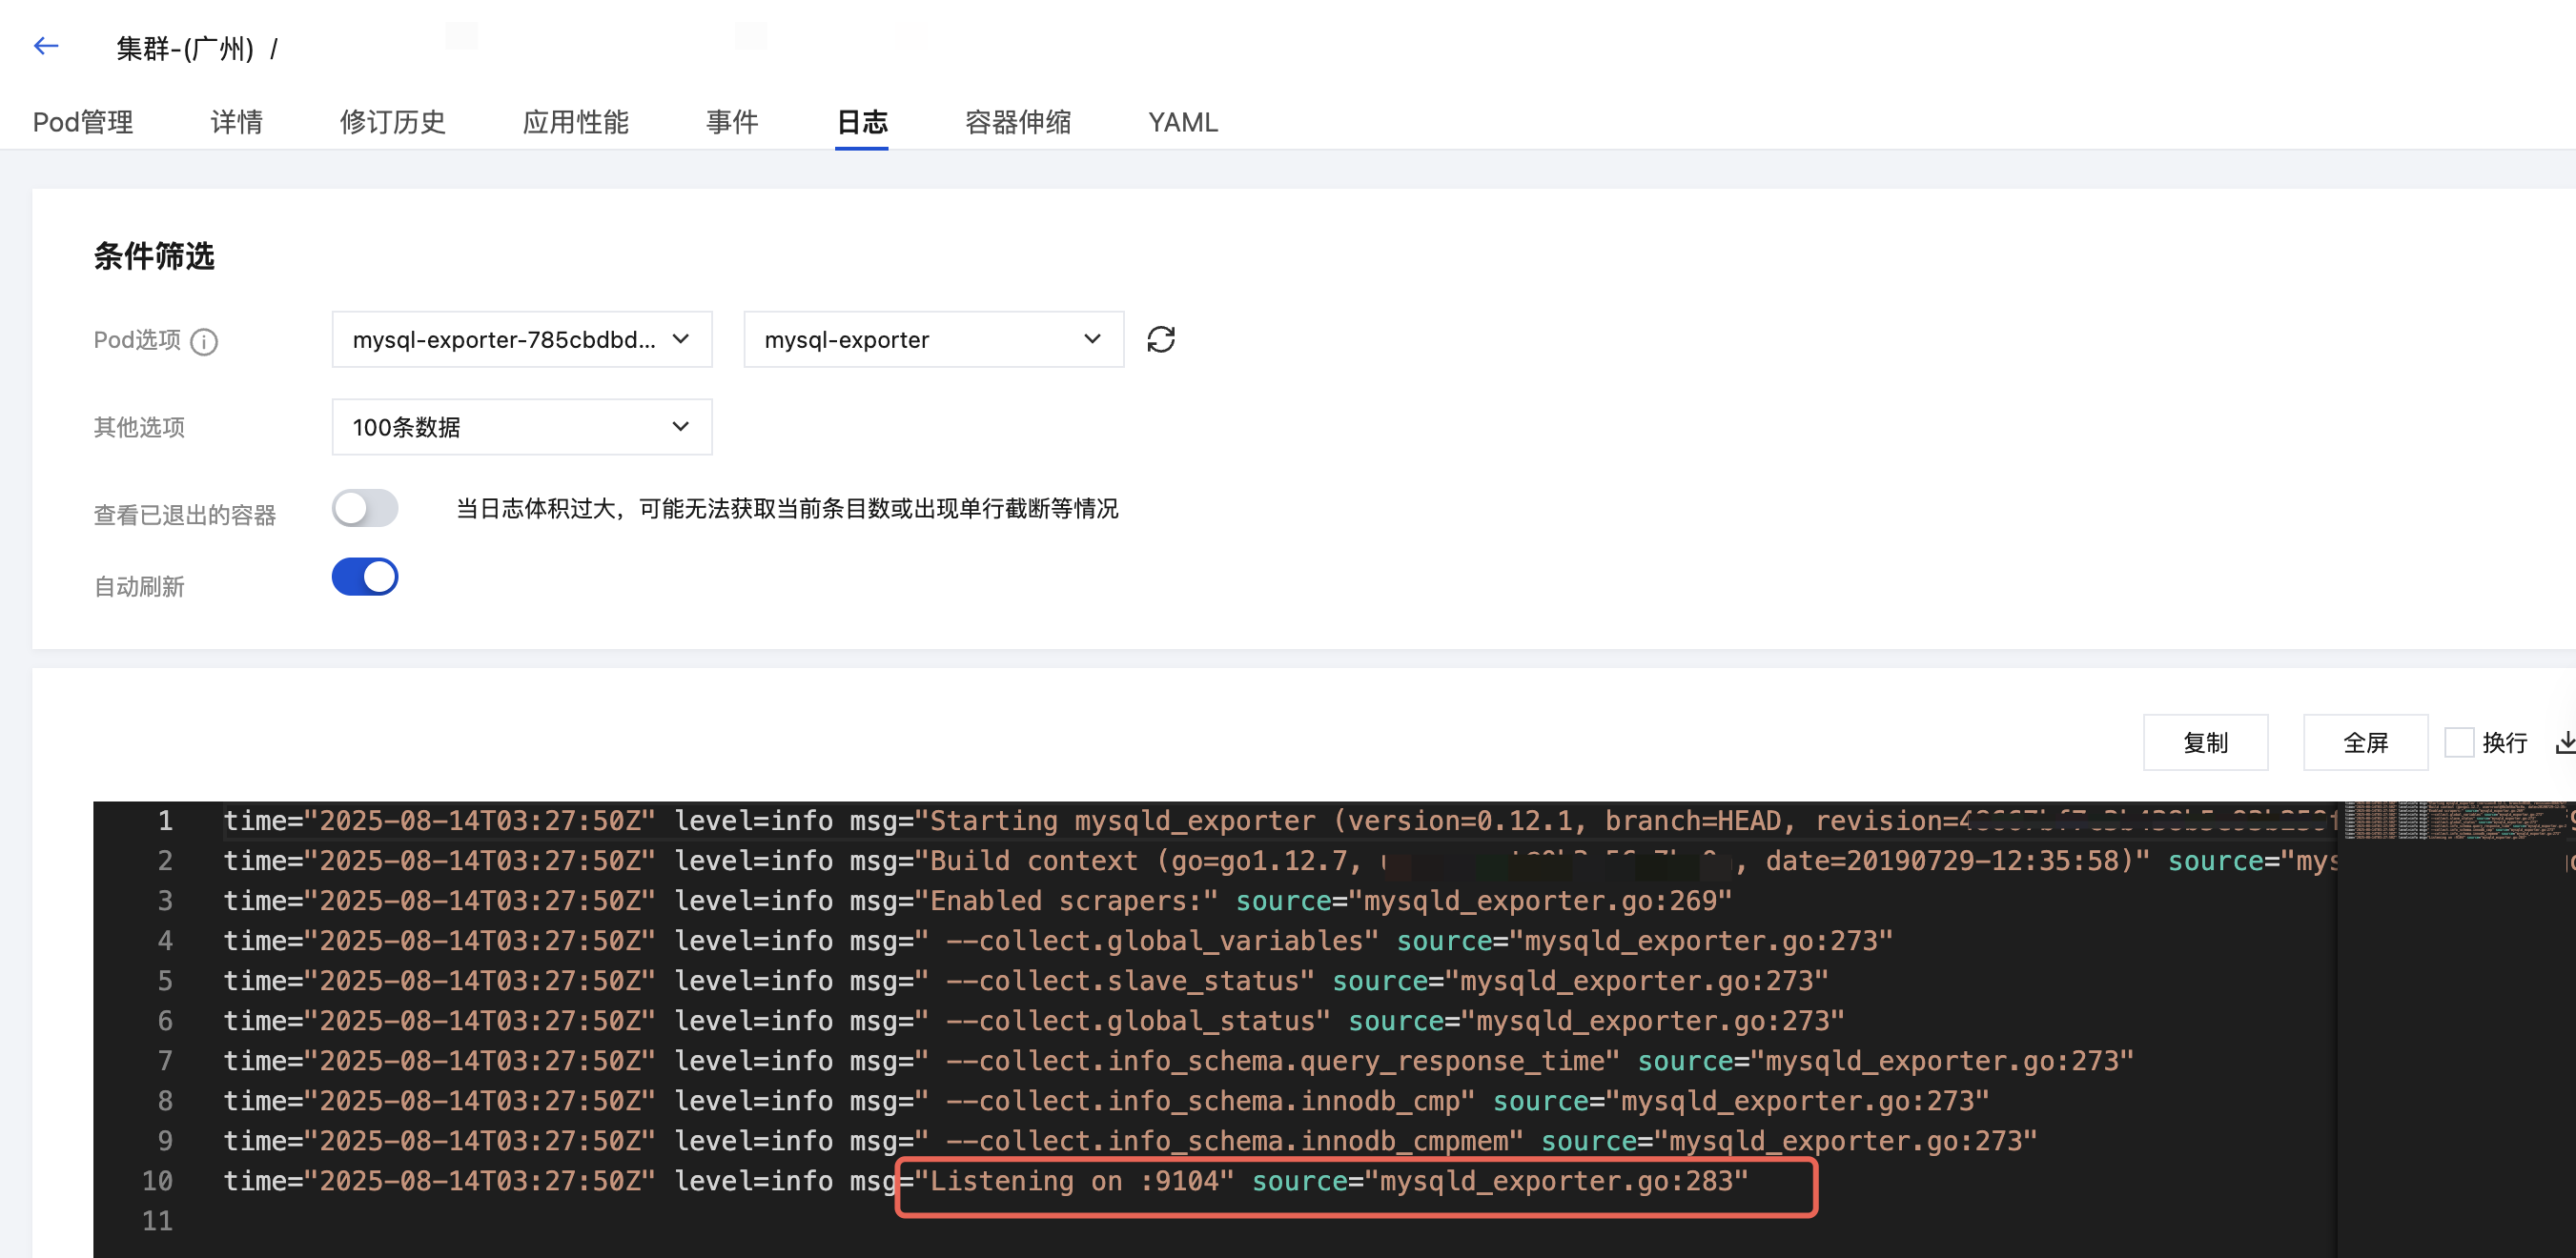
6.2 单击日志页签,可以查看到 Exporter 成功启动并暴露对应的访问地址,如下图所示:
6.3 单击 Pod 管理页签进入 Pod 页面。
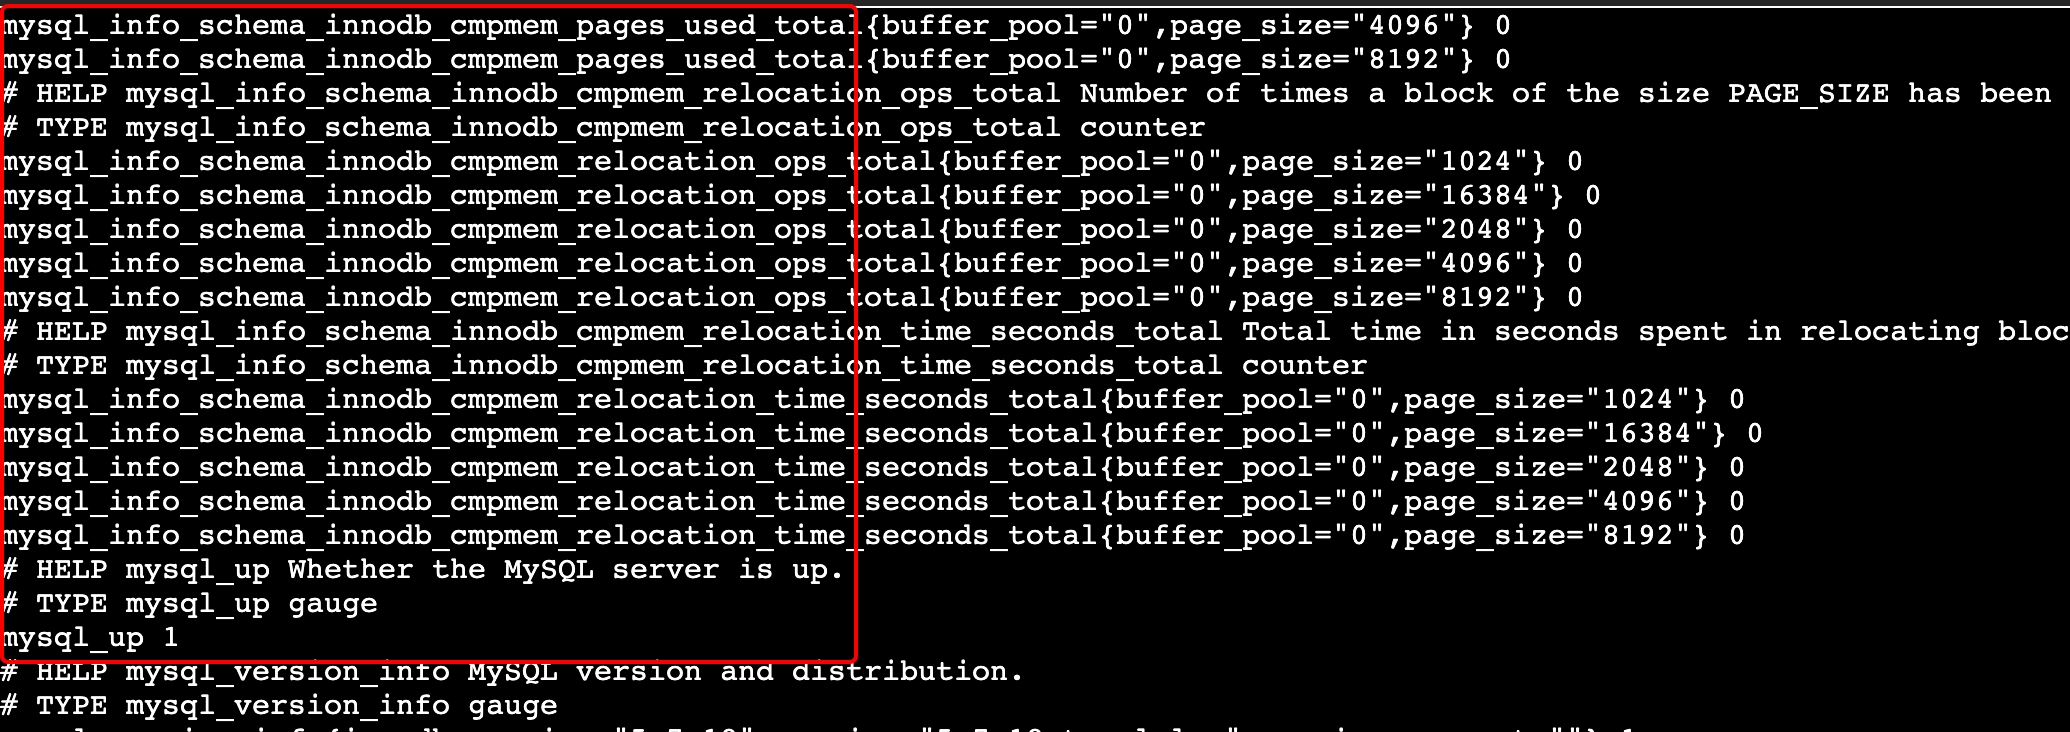
6.4 在右侧的操作项下单击登录,即可登录 Pod,在命令行窗口中执行以下 wget 命令,可以正常得到对应的 MySQL 指标。如发现未能得到对应的数据,请检查连接串是否正确,具体如下:
wget -O- localhost:9104/metrics
执行结果如下图所示:
步骤3:添加采集任务
1. 登录 Prometheus 监控服务控制台,选择对应 Prometheus 实例进入管理页面。
2. 选择数据采集 > 集成容器服务,选择已经关联的集群,通过数据采集配置 > 新建自定义监控 > YAML 编辑来添加采集配置。
3. 通过服务发现添加 PodMonitors 来定义 Prometheus 抓取任务,YAML 配置示例如下:
apiVersion: monitoring.coreos.com/v1kind: PodMonitormetadata:name: mysql-exporter # 填写一个唯一名称namespace: cm-prometheus # 按量实例: 集群的 namespace; 包年包月实例(已停止售卖): namespace 固定,不要修改spec:podMetricsEndpoints:- interval: 30sport: metric-port # 填写pod yaml中Prometheus Exporter对应的Port的Namepath: /metrics # 填写Prometheus Exporter对应的Path的值,不填默认/metricsrelabelings:- action: replacesourceLabels:- instanceregex: (.*)targetLabel: instancereplacement: 'cdb-xxxxxx' # 调整成对应的 MySQL 实例 ID- action: replacesourceLabels:- instanceregex: (.*)targetLabel: ipreplacement: '1.x.x.x' # 调整成对应的 MySQL 实例 IPnamespaceSelector: # 选择要监控pod所在的namespacematchNames:- mysql-demoselector: # 填写要监控pod的Label值,以定位目标podmatchLabels:k8s-app: mysql-exporter
查看监控
前提条件
操作步骤
1. 登录 Prometheus 监控服务控制台,选择对应 Prometheus 实例进入管理页面。
2. 选择数据采集 > 集成中心,进入集成中心页面,找到并单击 MySQL,选择 Dashboard > Dashboard 操作下的安装/升级 Dashboard,单击安装/升级安装对应的 Grafana Dashboard。
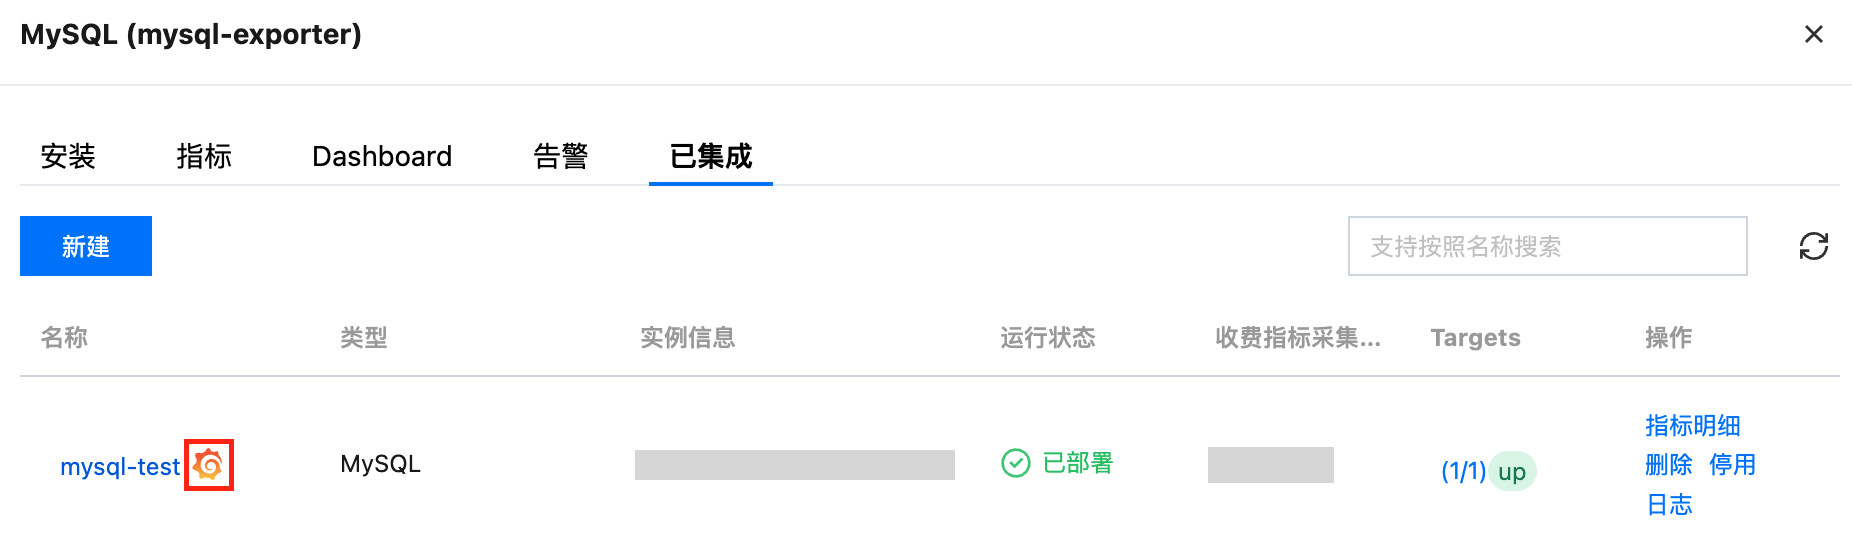
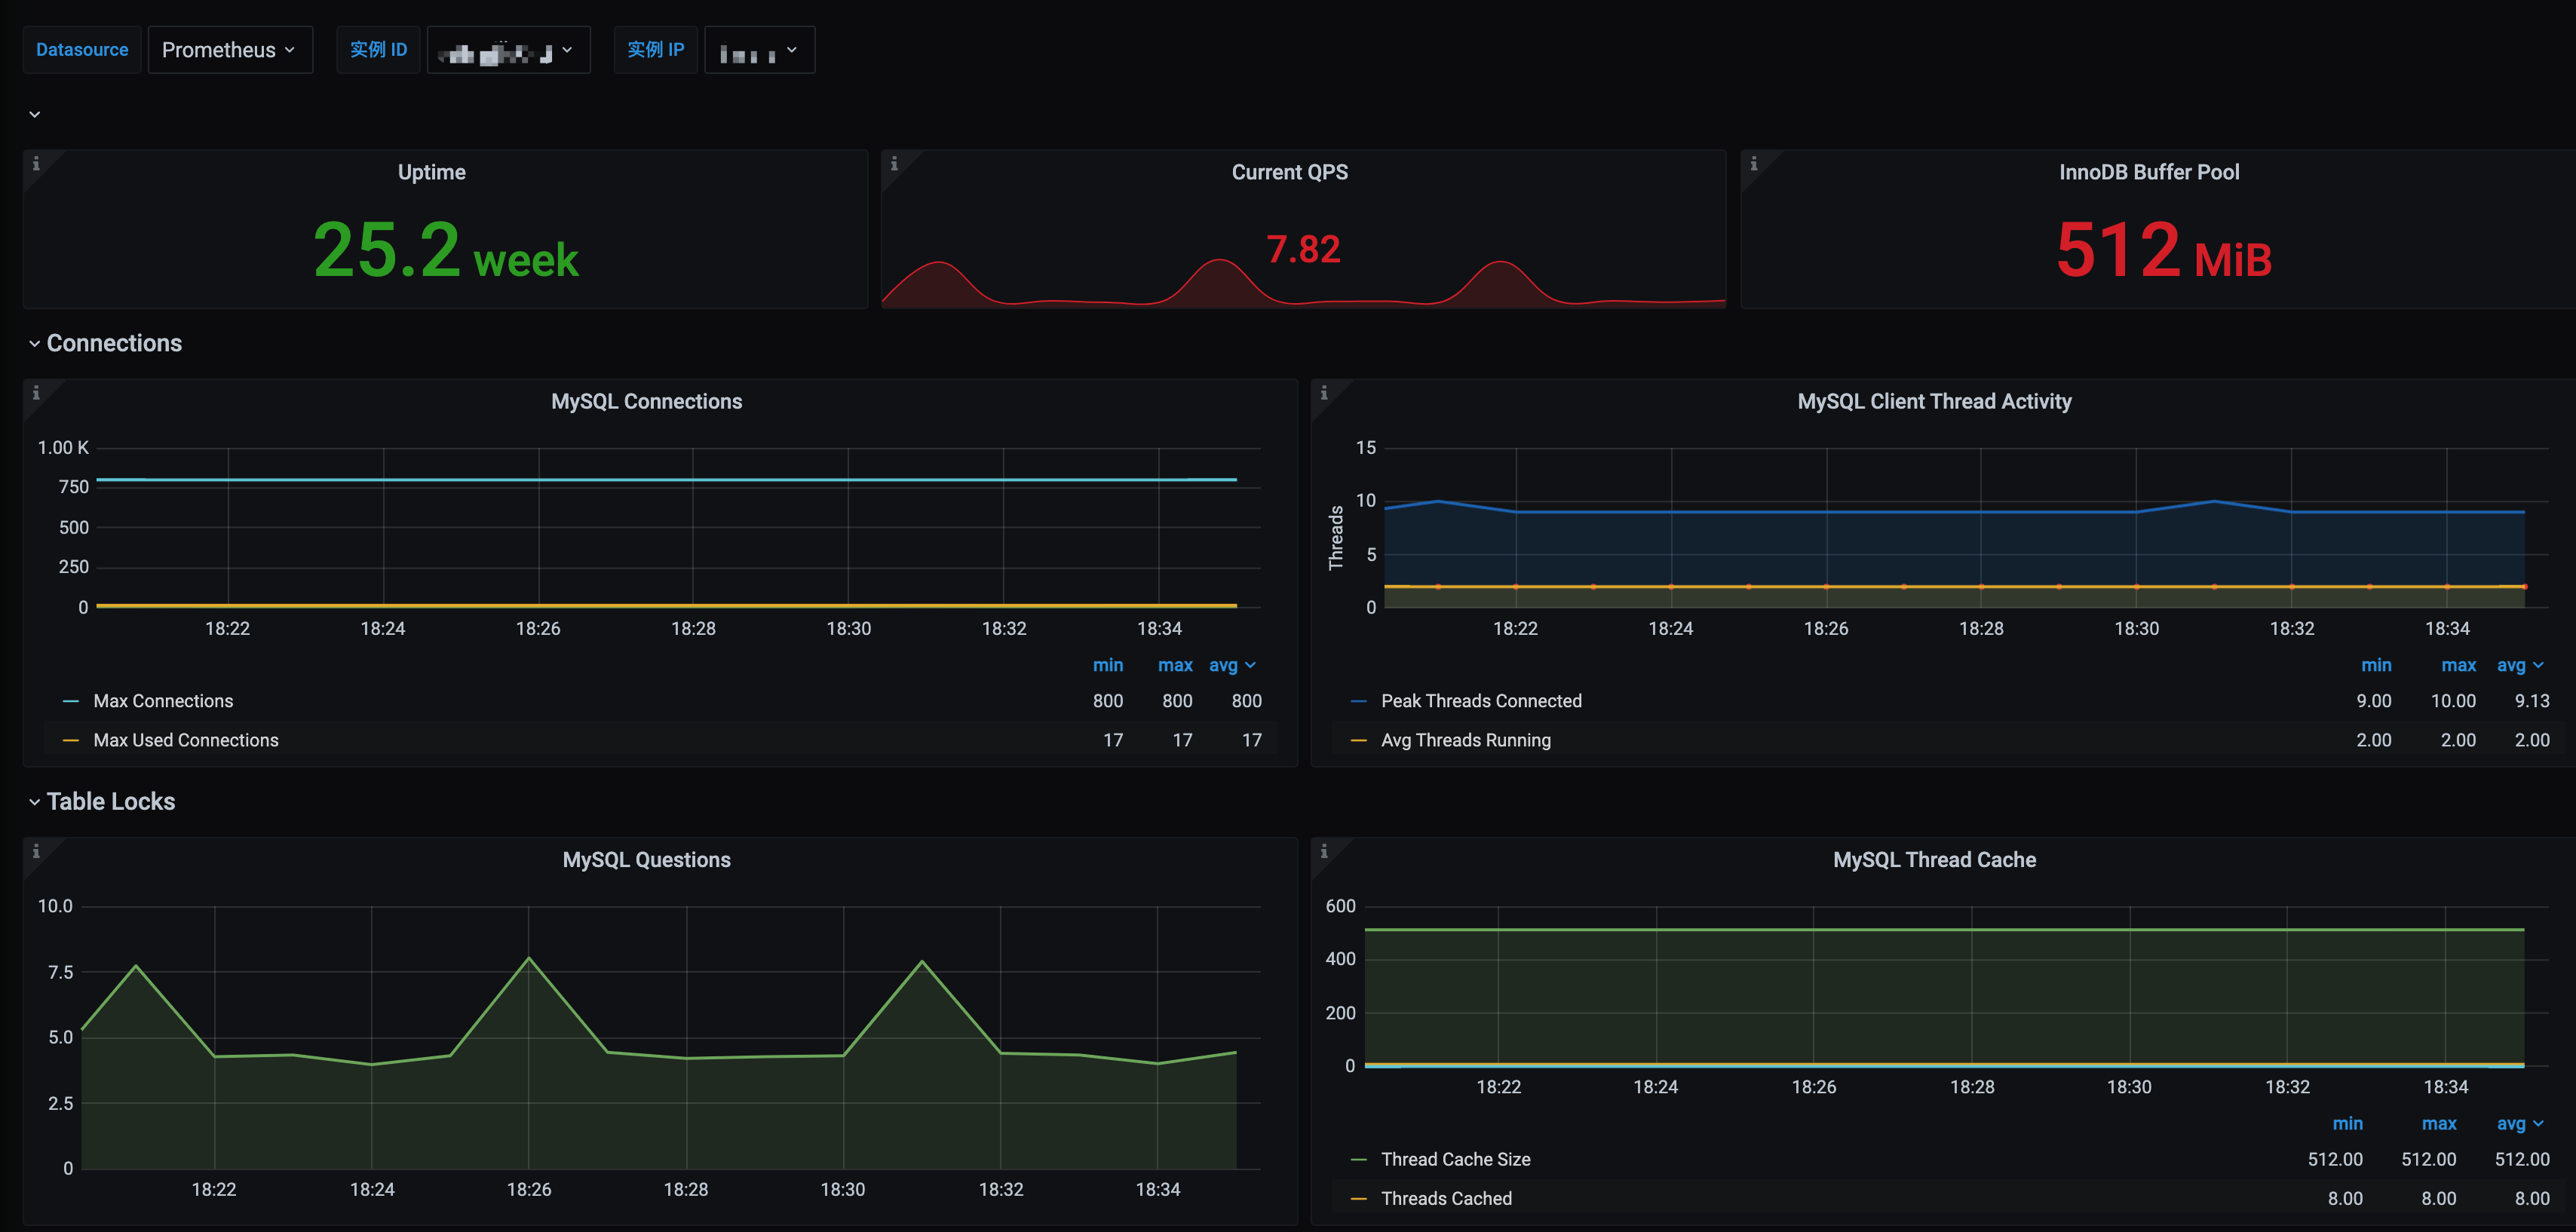
3. 选择已集成,在已集成列表中单击 Grafana 图标即可自动打开 MySQL 监控大盘,查看实例相关的监控数据,如下图所示:
配置告警
附录:MySQL Exporter 采集参数说明
MySQL Exporter 使用各种
Collector 来控制采集数据的启停,具体参数如下:名称 | MySQL 版本 | 描述 |
collect.auto_increment.columns | 5.1 | 在 information_schema 中采集 auto_increment 和最大值。 |
collect.binlog_size | 5.1 | 采集所有注册的 binlog 文件大小。 |
collect.engine_innodb_status | 5.1 | 从 SHOW ENGINE INNODB STATUS 中采集状态数据。 |
collect.engine_tokudb_status | 5.6 | 从 SHOW ENGINE TOKUDB STATUS 中采集状态数据。 |
collect.global_status | 5.1 | 从 SHOW GLOBAL STATUS(默认开启)中采集状态数据。 |
collect.global_variables | 5.1 | 从 SHOW GLOBAL VARIABLES(默认开启)中采集状态数据。 |
collect.info_schema.clientstats | 5.5 | 如果设置了 userstat=1,设置成 true 来开启用户端数据采集。 |
collect.info_schema.innodb_metrics | 5.6 | 从 information_schema.innodb_metrics 中采集监控数据。 |
collect.info_schema.innodb_tablespaces | 5.7 | 从 information_schema.innodb_sys_tablespaces 中采集监控数据。 |
collect.info_schema.innodb_cmp | 5.5 | 从 information_schema.innodb_cmp 中采集 InnoDB 压缩表的监控数据。 |
collect.info_schema.innodb_cmpmem | 5.5 | 从 information_schema.innodb_cmpmem 中采集 InnoDB buffer pool compression 的监控数据。 |
collect.info_schema.processlist | 5.1 | 从 information_schema.processlist 中采集线程状态计数的监控数据。 |
collect.info_schema.processlist.min_time | 5.1 | 线程可以被统计所维持的状态的最小时间。(默认:0) |
collect.info_schema.query_response_time | 5.5 | 如果 query_response_time_stats 被设置成 ON,采集查询相应时间的分布。 |
collect.info_schema.replica_host | 5.6 | 从 information_schema.replica_host_status 中采集状态数据。 |
collect.info_schema.tables | 5.1 | 从 information_schema.tables 中采集状态数据。 |
collect.info_schema.tables.databases | 5.1 | 设置需要采集表状态的数据库, 或者设置成 ' *' 来采集所有的。 |
collect.info_schema.tablestats | 5.1 | 如果设置了 userstat=1,设置成 true 来采集表统计数据。 |
collect.info_schema.schemastats | 5.1 | 如果设置了 userstat=1,设置成 true 来采集 schema 统计数据。 |
collect.info_schema.userstats | 5.1 | 如果设置了 userstat=1,设置成 true 来采集用户统计数据。 |
collect.perf_schema.eventsstatements | 5.6 | 从 performance_schema.events_statements_summary_by_digest 中采集监控数据。 |
collect.perf_schema.eventsstatements.digest_text_limit | 5.6 | 设置正常文本语句的最大长度。 (默认:120) |
collect.perf_schema.eventsstatements.limit | 5.6 | 事件语句的限制数量。(默认:250) |
collect.perf_schema.eventsstatements.timelimit | 5.6 | 限制事件语句 'last_seen' 可以保持多久,单位为秒。 (默认:86400) |
collect.perf_schema.eventsstatementssum | 5.7 | 从 performance_schema.events_statements_summary_by_digest summed 中采集监控数据。 |
collect.perf_schema.eventswaits | 5.5 | 从 performance_schema.events_waits_summary_global_by_event_name 中采集监控数据。 |
collect.perf_schema.file_events | 5.6 | 从 performance_schema.file_summary_by_event_name 中采集监控数据。 |
collect.perf_schema.file_instances | 5.5 | 从 performance_schema.file_summary_by_instance 中采集监控数据。 |
collect.perf_schema.indexiowaits | 5.6 | 从 performance_schema.table_io_waits_summary_by_index_usage 中采集监控数据。 |
collect.perf_schema.tableiowaits | 5.6 | 从 performance_schema.table_io_waits_summary_by_table 中采集监控数据。 |
collect.perf_schema.tablelocks | 5.6 | 从 performance_schema.table_lock_waits_summary_by_table 中采集监控数据。 |
collect.perf_schema.replication_group_members | 5.7 | 从 performance_schema.replication_group_members 中采集监控数据。 |
collect.perf_schema.replication_group_member_stats | 5.7 | 从 from performance_schema.replication_group_member_stats 中采集监控数据。 |
collect.perf_schema.replication_applier_status_by_worker | 5.7 | 从 performance_schema.replication_applier_status_by_worker 中采集监控数据。 |
collect.slave_status | 5.1 | 从 SHOW SLAVE STATUS(默认开启)中采集监控数据。 |
collect.slave_hosts | 5.1 | 从 SHOW SLAVE HOSTS 中采集监控数据。 |
collect.heartbeat | 5.1 | |
collect.heartbeat.database | 5.1 | 数据库心跳检测的数据源。(默认:heartbeat) |
collect.heartbeat.table | 5.1 | 表心跳检测的数据源。(默认:heartbeat) |
collect.heartbeat.utc | 5.1 | 对当前的数据库服务器使用 UTC 时间戳 ( pt-heartbeat is called with --utc)。(默认:false) |
全局配置参数
名称 | 描述 |
config.my-cnf | 用来读取数据库认证信息的配置文件 .my.cnf 位置。 (默认:~/.my.cnf) |
log.level | 日志级别。(默认:info) |
exporter.lock_wait_timeout | 为链接设置 lock_wait_timeout(单位:秒)以避免对元数据的锁时间太长。(默认:2) |
exporter.log_slow_filter | 添加 log_slow_filter 以避免抓取的慢查询被记录。 说明: 不支持 Oracle MySQL。 |
web.listen-address | web 端口监听地址。 |
web.telemetry-path | metrics 接口路径。 |
version | 打印版本信息。 |
heartbeat 心跳检测
如果开启
collect.heartbeat,mysqld_exporter 会通过心跳检测机制抓取复制延迟数据。文档反馈