tencent cloud

TencentDB for DBbrain

Release Notes and Announcements
Release Notes
Announcements
Product Introduction
Overview
Features
Strengths
Use Cases
Feature List
Region List
Purchase Guide
Operation Guide
Cloud Access Management
Self-Built Database Access
Instance Overview
Instance Management
Monitoring and Alarms
Health Report and Kill Session Report Management
MySQL/TDSQL-C for MySQL Performance Optimization
TDSQL for MySQL/MariaDB Performance Optimization
Distributed cache database (Distributed Cache) diagnostic optimization
MongoDB Performance Optimization
Full-Link Analysis
Practical Tutorial
Fixing High CPU Utilization on MySQL Instance
Fixing Lock Conflict on MySQL Instance
How to Address High CPU Utilization Issues in Distributed Cache Instances
Fixing High CPU Utilization in MongoDB Instance
Fixing Short Node Oplog Retention Period in MongoDB Instance
API Documentation
History
Introduction
Introduction
API Category
Making API Requests
Session Killing APIs
Exception Detection APIs
Other APIs
Redis related APIs
Health Report Email Sending APIs
Space Analysis APIs
Slow Log Analysis APIs
Security Audit APIs
Database Audit APIs
Data Types
Error Codes
DBbrain APIs 2019-10-16
FAQs
Self-Built Database Issues
MySQL Performance
Product
Service Level Agreement
Glossary
Contact Us

Latency Analysis

PDF
Focus Mode
Font Size
Last updated: 2026-03-19 17:23:59
The Tencent Cloud Distributed Cache latency analysis feature helps you understand the database latency in real time. Through latency analysis, you can quickly view the total requests, CPU usage, and history of the current instance and locate time-consuming commands, time-consuming command execution time, overall latency distribution, and access command hits.

Viewing the latency analysis result

1. Log in to the DBbrain Console.
2. In the left sidebar, choose Performance Optimization.
3. At the top of the page, select the corresponding database and instance ID, then select Latency Analysis > Latency Analysis tab.

4. On the Latency Analysis page, you can switch between real-time and historical views to check latency analysis data.
Real-time view: Displays the analysis results at each time point in real-time.
Historical view: Displays the analysis results in the last 30 minutes, last 6 hours, last 24 hours, or a custom time range.

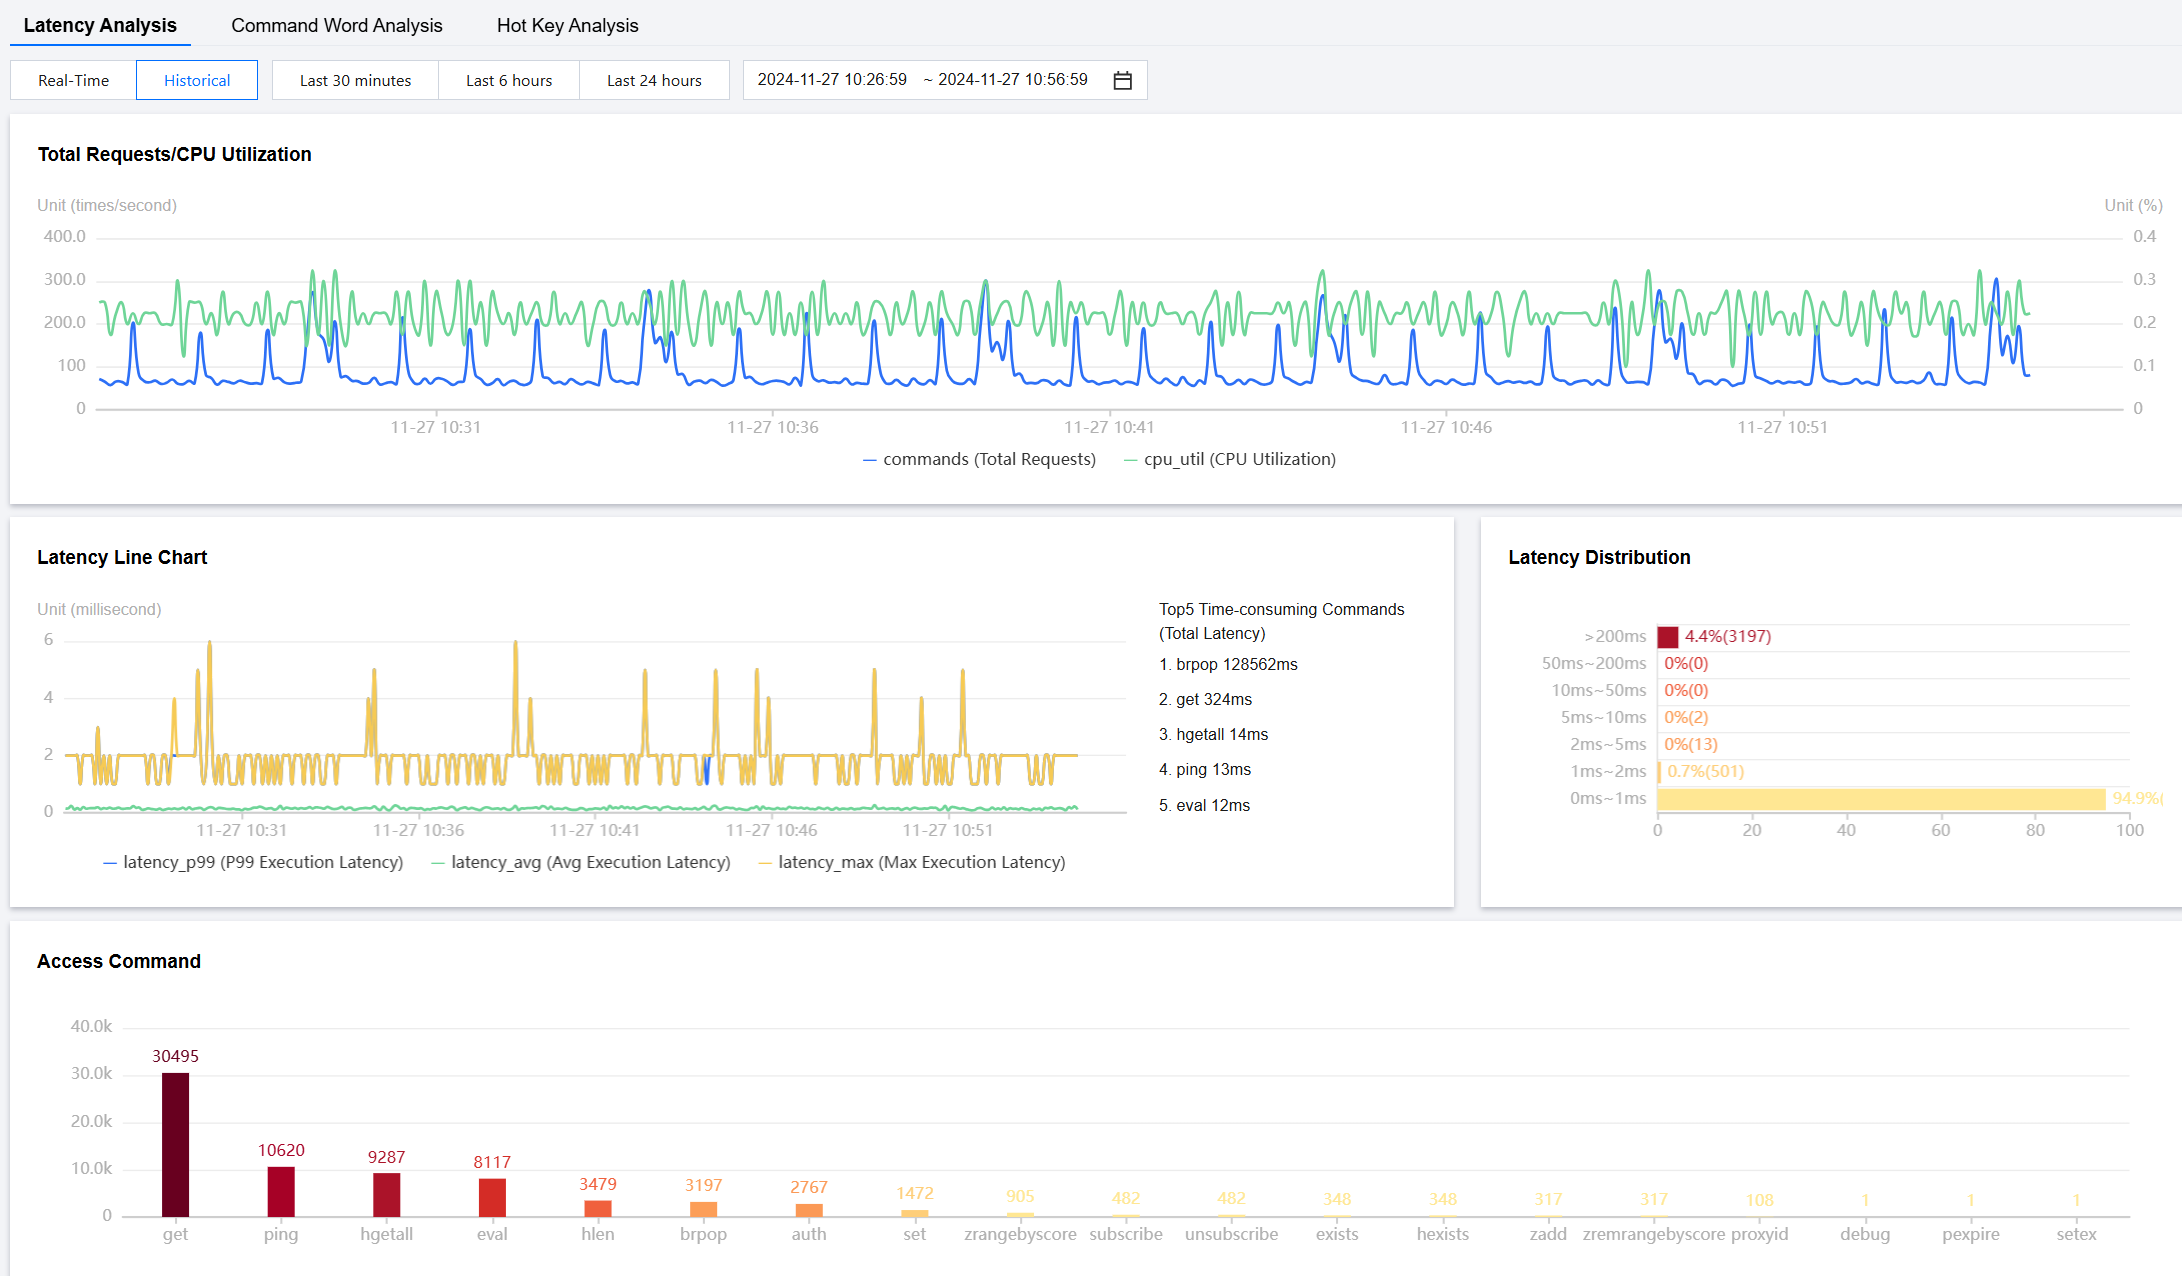
The latency distribution displays the percentage of data across different latency ranges, allowing users to quickly perceive the overall latency of their business operations. The Command area displays time-consuming commands and the the number of hits.

Help and Support

Was this page helpful?

Help us improve! Rate your documentation experience in 5 mins.

Feedback