Release Notes
Announcements
Category | Category Child Items | Chinese Metric Name | English Metric Name | Unit | Metric Meaning |
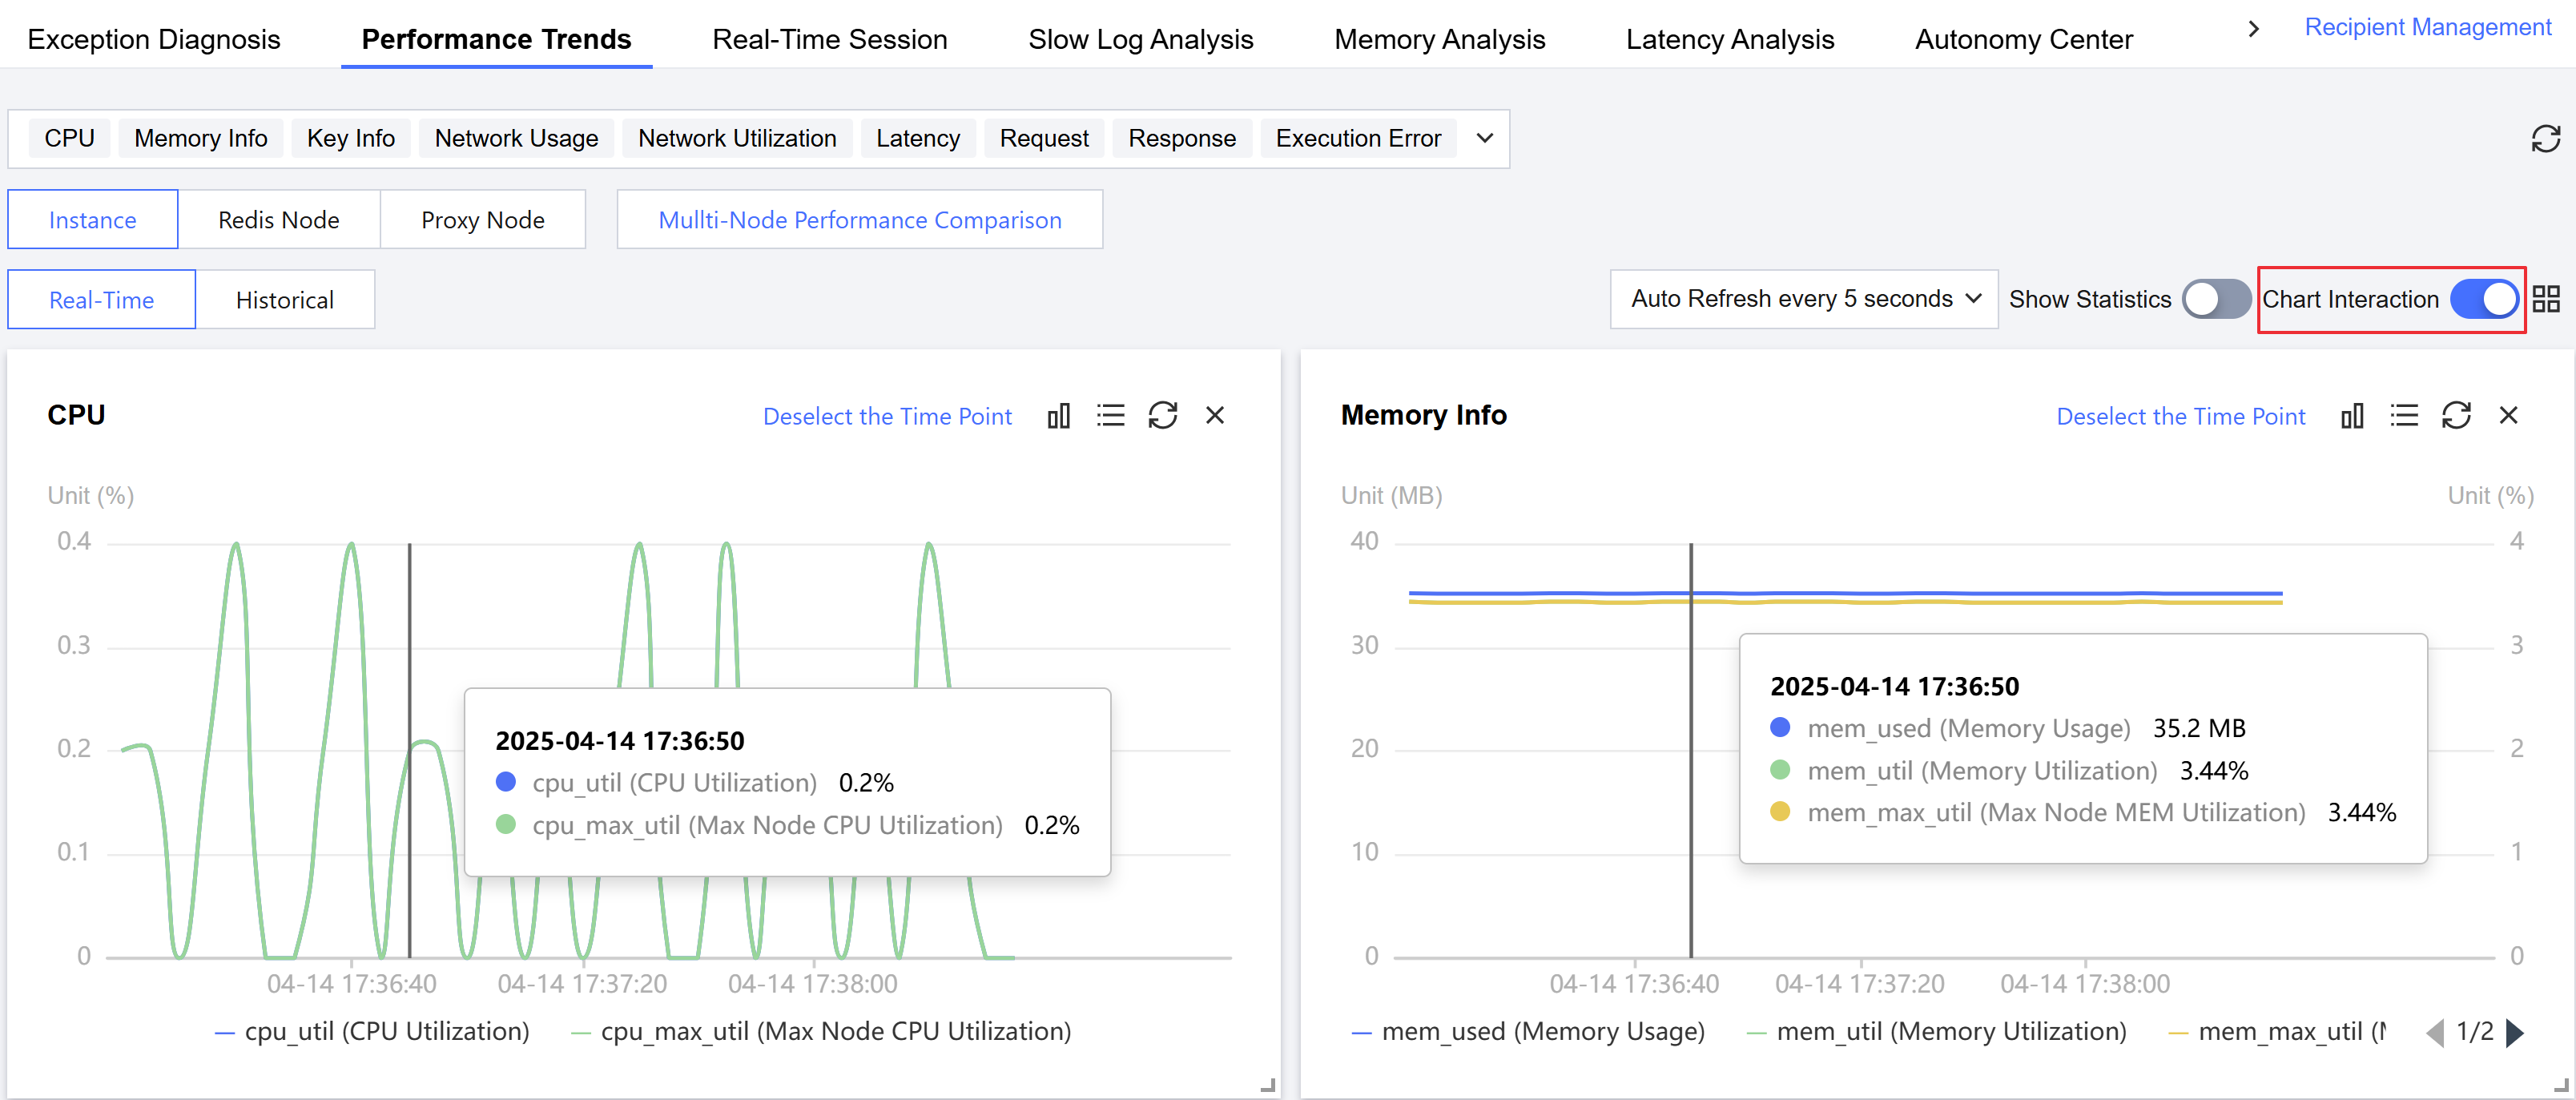
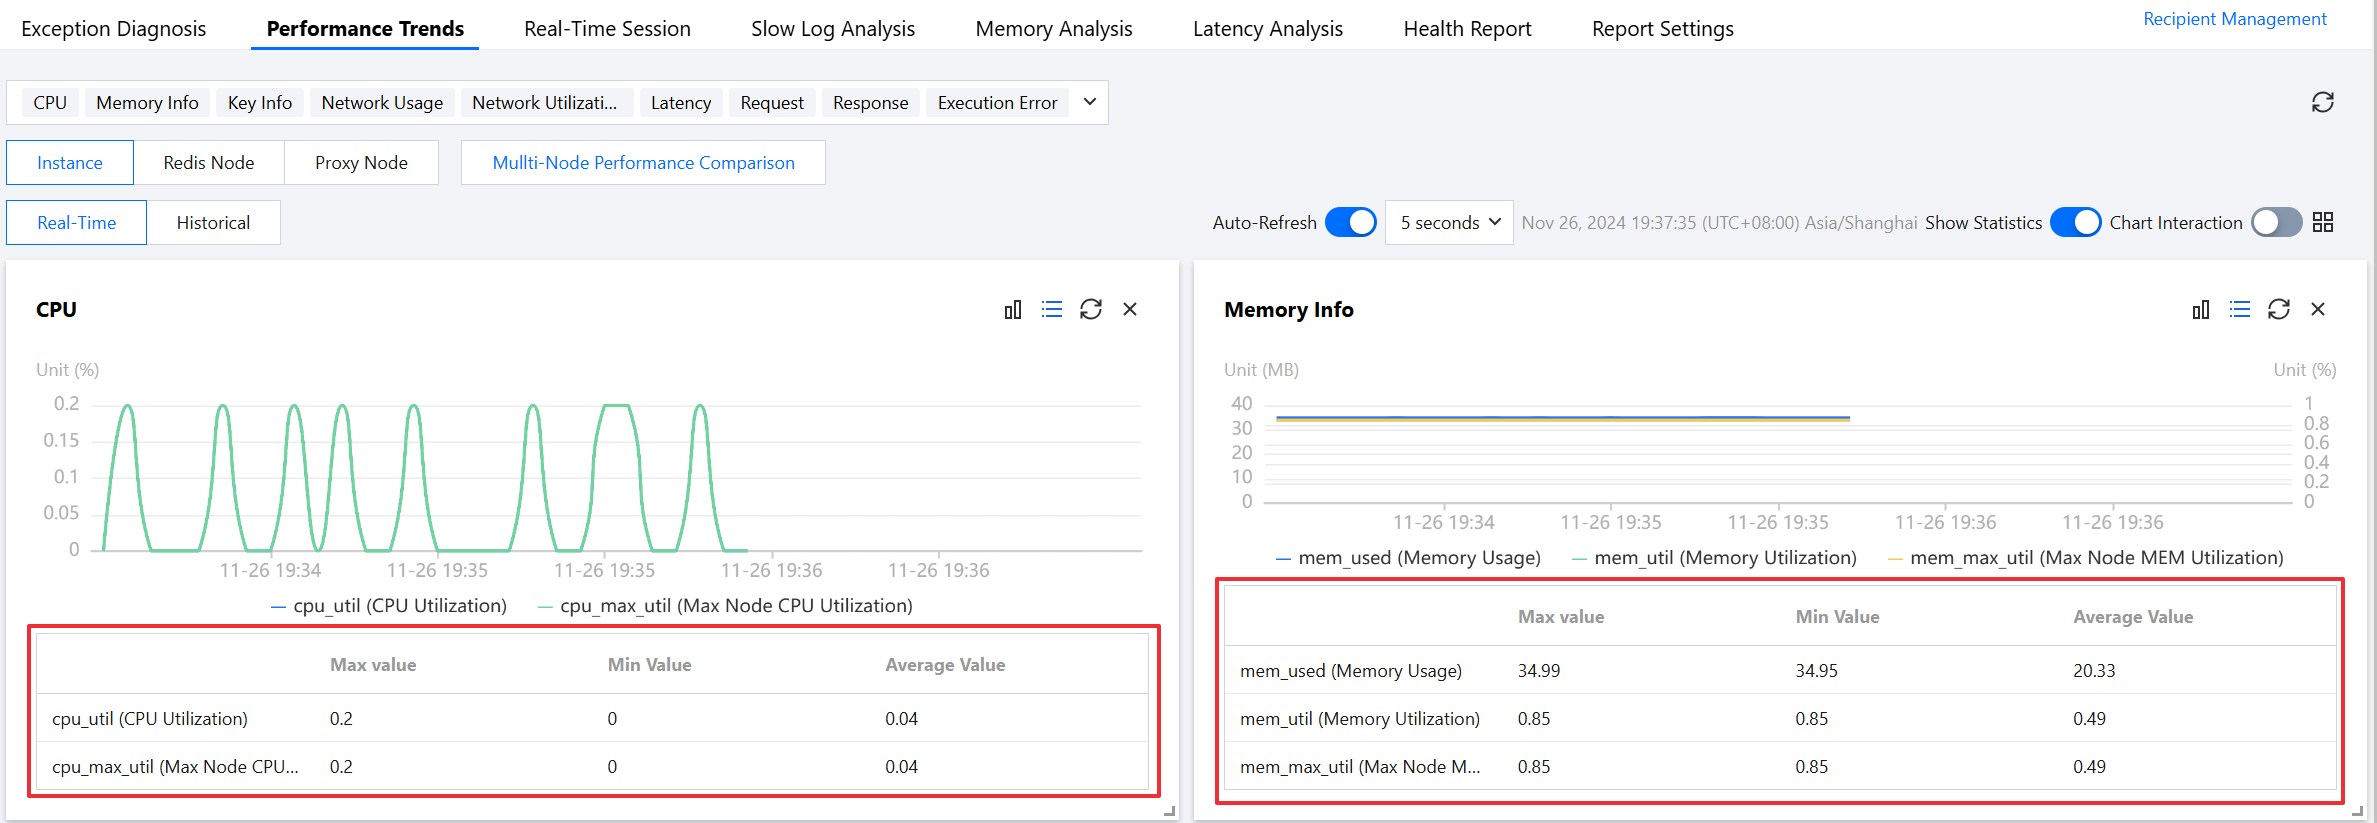
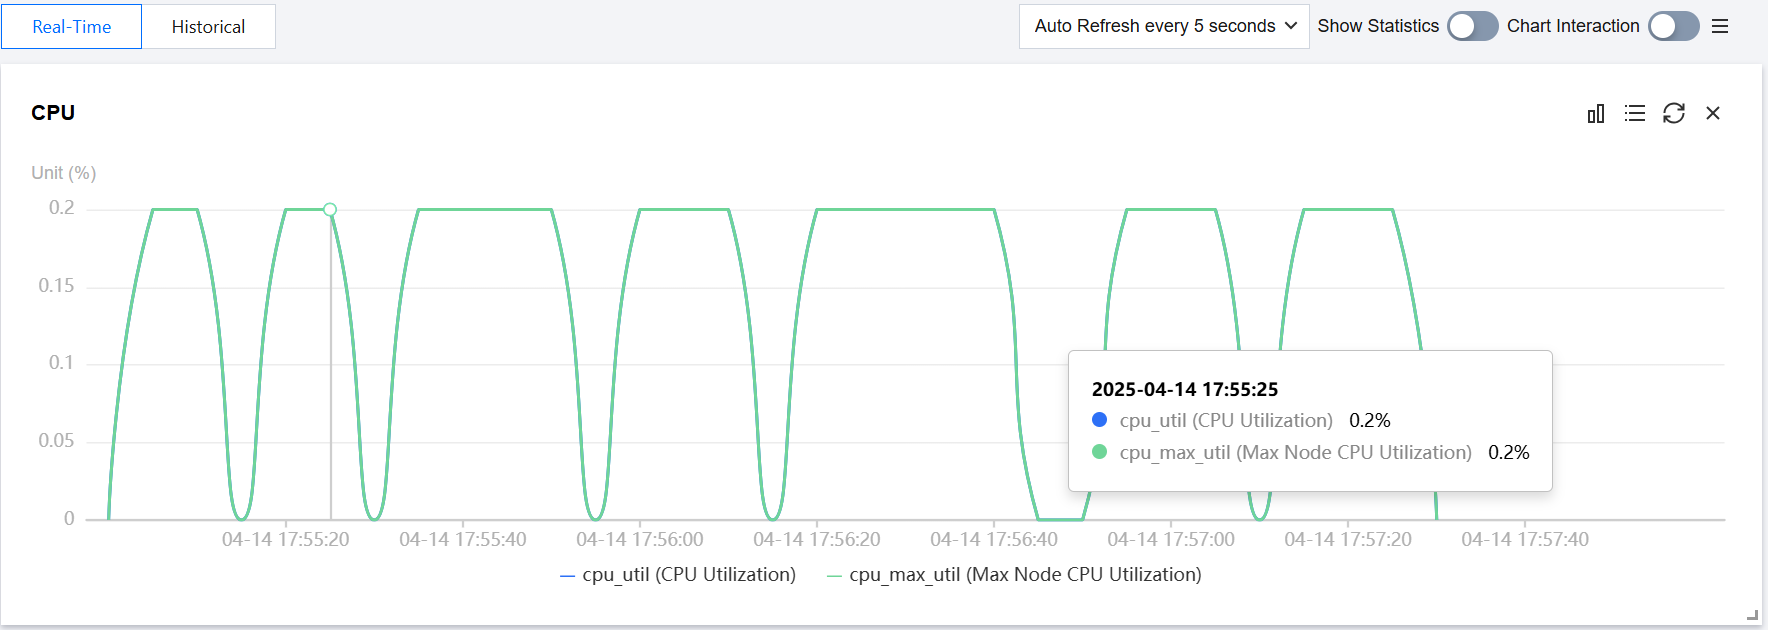
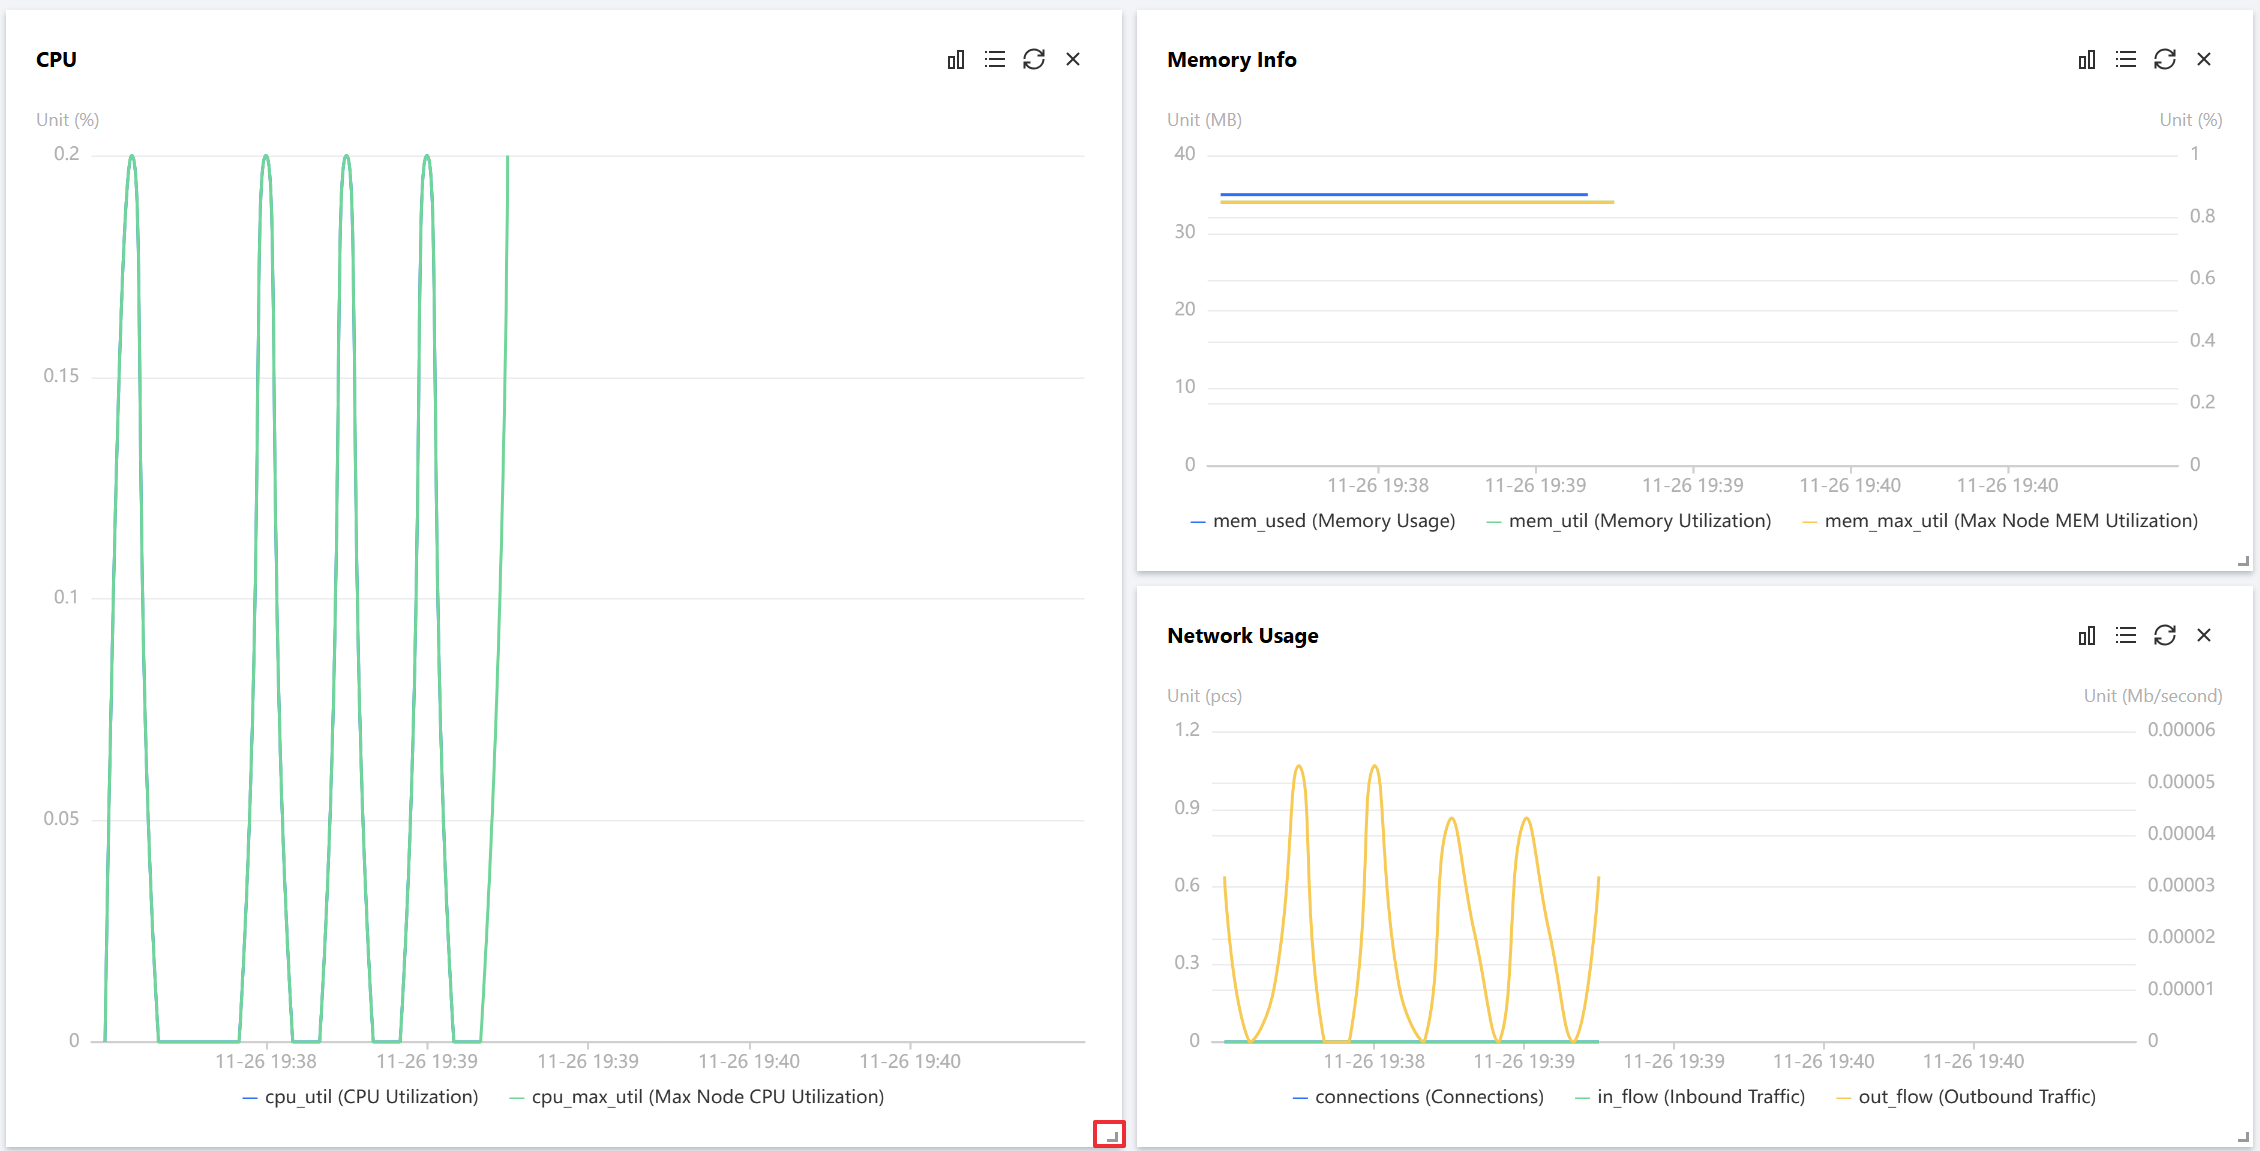
Instance | CPU | CPU Utilization | cpu_util | % | Average CPU utilization. |
| | Max Node CPU Utilization | cpu_max_util | % | Maximum CPU utilization of nodes (shards or replicas) in the instance. |
| Memory Info | Memory Usage | mem_used | MB | Memory capacity actually used, including data and cache. |
| | Memory Utilization | mem_util | % | The proportion of actually used memory to total applied memory. |
| | Max Node MEM Utilization | mem_max_util | % | Maximum memory utilization of nodes (shards or replicas) in the instance. |
| Latency | Avg Execution Latency | latency_avg | millisecond | The average execution latency from the Proxy to the Tencent Cloud Distributed Cache Server. |
| | Max Execution Latency | latency_max | millisecond | The maximum execution latency from the Proxy to the Tencent Cloud Distributed Cache Server. |
| | P99 Execution Latency | latency_p99 | millisecond | The 99% execution latency from the Proxy to the Tencent Cloud Distributed Cache Server. |
| | Avg Read Latency | latency_read | millisecond | The average execution latency of read commands from the Proxy to the Tencent Cloud Distributed Cache Server. |
| | Avg Write Latency | latency_write | millisecond | The average execution latency of write commands from the Proxy to the Tencent Cloud Distributed Cache Server. |
| | Avg Latency of Other Commands | latency_other | millisecond | The average execution latency of commands other than read and write commands from the Proxy to the Tencent Cloud Distributed Cache Server. |
| Key Info | Total keys | keys | pcs | The total number of keys stored in an instance (first-level keys). |
| | Expired Keys | expired | pcs | The number of keys evicted within the time window, corresponding to the expired_keys output by the info command. |
| | Evicted Keys | evicted | pcs | The number of keys evicted within the time window, corresponding to the evicted_keys output by the info command. |
| Network Usage | Connections | connections | pcs | The number of TCP connections to an instance. |
| | Inbound Traffic | in_flow | Mb/second | Private network inbound traffic. |
| | Outbound Traffic | out_flow | Mb/second | Private network outbound traffic. |
| Network Utilization | Connection Utilization | connections_util | % | The ratio of the actual TCP connection count to the maximum connection count. |
| | Inbound Traffic Utilization | in_bandwidth_util | % | The ratio of the actually used private network inbound traffic to the maximum traffic. |
| | Outbound Traffic Utilization | out_bandwidth_util | % | The ratio of the actually used private network outbound traffic to the maximum traffic. |
| | Inbound Traffic Throttling Trigger | in_flow_limit | times | The number of times for which inbound traffic exceeds the maximum bandwidth. |
| | Outbound Traffic Throttling Trigger | out_flow_limit | times | The number of times for which outbound traffic exceeds the maximum bandwidth. |
| Request | Total Requests | commands | times/second | Average CPU utilization. |
| | Read Request | cmd_read | times/second | Maximum CPU utilization of nodes (shards or replicas) in the instance. |
| | Write Request | cmd_write | times/second | The number of times for which write command executed per second. |
| | Other Requests | cmd_other | times/second | The number of times for which commands executed per second excluding read and write commands. |
| | Big Value Request | cmd_big_value | times/second | The number of times for which commands executed per second with request size exceeding 32 KB. |
| | Key Requests | cmd_key_count | pcs/second | The number of key requests per second. |
| | Mget Requests | cmd_cmget | times/second | The number of requests executed per second using Mget. |
| Response | Slow Query | cmd_slow | times | The number of times for which commands with execution latency is greater than the slowlog-log-slower-than configuration. |
| | Read Request Hit | cmd_hits | times | The number of read requests for existing keys, corresponding to the keyspace_hits metric reported by the info command. |
| | Read Request Miss | cmd_miss | times | The number of read requests for keys that do not exist, corresponding to the keyspace_misses metric reported by the info command. |
| | Read Request Hit Rate | cmd_hits_ratio | % | Key Hit / (Key Hit + Key Miss). This metric reflects the cache miss rate. When the access is 0, this value is null. |
| Execution Error | Execution Error | cmd_err | times/second | The number of times for which a command execution error occurred, such as non-existent commands or parameter errors. |
Redis Node | CPU | CPU Utilization | cpu_util | % | Average CPU utilization. |
| Memory Info | Memory Usage | mem_used | MB | Memory capacity actually used, including data and cache. |
| | Memory Utilization | mem_util | % | The proportion of actually used memory to total applied memory. |
| Key Info | Total Keys | keys | pcs | The total number of keys stored in an instance (first-level keys). |
| | Expired Keys | expired | pcs | The number of keys evicted within the time window, corresponding to the expired_keys output by the info command. |
| | Evicted Keys | evicted | pcs | The number of keys evicted within the time window, corresponding to the evicted_keys output by the info command. |
| Replication Delay | Replication Delay | repl_delay | B | The relative command latency length of the replica node to the primary node. |
| Network Usage | Connections | connections | pcs | The number of connections from the proxy to the node. |
| | Connection Utilization | connections_util | % | Node connection utilization. |
| Request | Total Requests | commands | times/second | QPS, number of times for which commands executed. |
| | Read Request | cmd_read | times/second | The number of times for which read command executed. |
| | Write Request | cmd_write | times/second | The number of times for which write command executed. |
| | Other Requests | cmd_other | times/second | The number of times for which commands executed other than read and write commands. |
| Response | Slow Query | cmd_slow | times | The number of times for which commands with execution latency is greater than the slowlog-log-slower-than configuration. |
| | Read Request Hit | cmd_hits | times | The number of read requests for existing keys, corresponding to the keyspace_hits metric reported by the info command. |
| | Read Request Miss | cmd_miss | times | The number of read requests for keys that do not exist, corresponding to the keyspace_misses metric reported by the info command. |
| | Read Request Hit Rate | cmd_hits_ratio | % | Key Hit / (Key Hit + KeyMiss), this metric can reflect the situation of Cache Miss. |
Proxy node | CPU | CPU Utilization | cpu_util | % | Proxy CPU utilization. |
| Traffic | Inbound Traffic | in_flow | Mb/second | Private network inbound traffic. |
| | Outbound Traffic | out_flow | Mb/second | Private network outbound traffic. |
| Request | Total Requests | proxy_commands | times/second | The number of commands executed by the proxy. |
| | Key Requests | cmd_key_count | pcs/second | The number of keys accessed by the command. |
| | Mget Request | cmd_mget | times/second | The number of times for which Mget command executed. |
| | Execution Error | cmd_err | times/second | The number of times for proxy command execution errors, such as non-existent commands or parameter errors. |
| | Big Value Requests | cmd_big_value | times/second | The number of times for which requests executed larger than 32 KB per second. |
| Network Usage | Connections | connections | pcs | The number of TCP connections to an instance. |
| | Connections per Sec | client_connections_received_per_second | times/second | The number of TCP connections established per second. |
| | Disconnections per Sec | client_connections_closed_per_second | times/second | The number of TCP connections disconnected per second. |
| | Abnomal Disconnections per Sec | client_connections_aborted_per_second | times/second | The number of abnormal TCP disconnections per second. |
| Network Utilization | Connection Utilization | connections_util | % | The ratio of the actual TCP connection count to the maximum connection count. |
| | Inbound Traffic Utilization | in_bandwidth_util | % | The ratio of the actually used private network inbound traffic to the maximum traffic. |
| | Outbound Traffic Utilization | out_bandwidth_util | % | The ratio of the actually used private network outbound traffic to the maximum traffic. |
| | Inbound Traffic Throttling Trigger | in_flow_limit | times | The number of times for which inbound traffic triggered traffic throttling. |
| | Outbound Traffic Throttling Trigger | out_flow_limit | times | The number of times for which outbound traffic triggered traffic throttling. |
| Latency | Avg Execution latency | latency_avg | millisecond | The average execution latency from the Proxy to the Tencent Cloud Distributed Cache Server. |
| | Max Execution Latency | latency_max | millisecond | The maximum execution latency from the Proxy to the Tencent Cloud Distributed Cache Server. |
| | P99 Execution Latency | latency_p99 | millisecond | The 99% execution latency from the Proxy to the Tencent Cloud Distributed Cache Server. |
| | Avg Read Latency | latency_read | millisecond | The average execution latency of read commands from the Proxy to the Tencent Cloud Distributed Cache Server. |
| | Avg Write Latency | latency_write | millisecond | The average execution latency of write commands from the Proxy to the Tencent Cloud Distributed Cache Server. |
| | Avg Latency of Other Commands | latency_other | millisecond | The average execution latency of commands other than read and write commands from the Proxy to the Tencent Cloud Distributed Cache Server. |


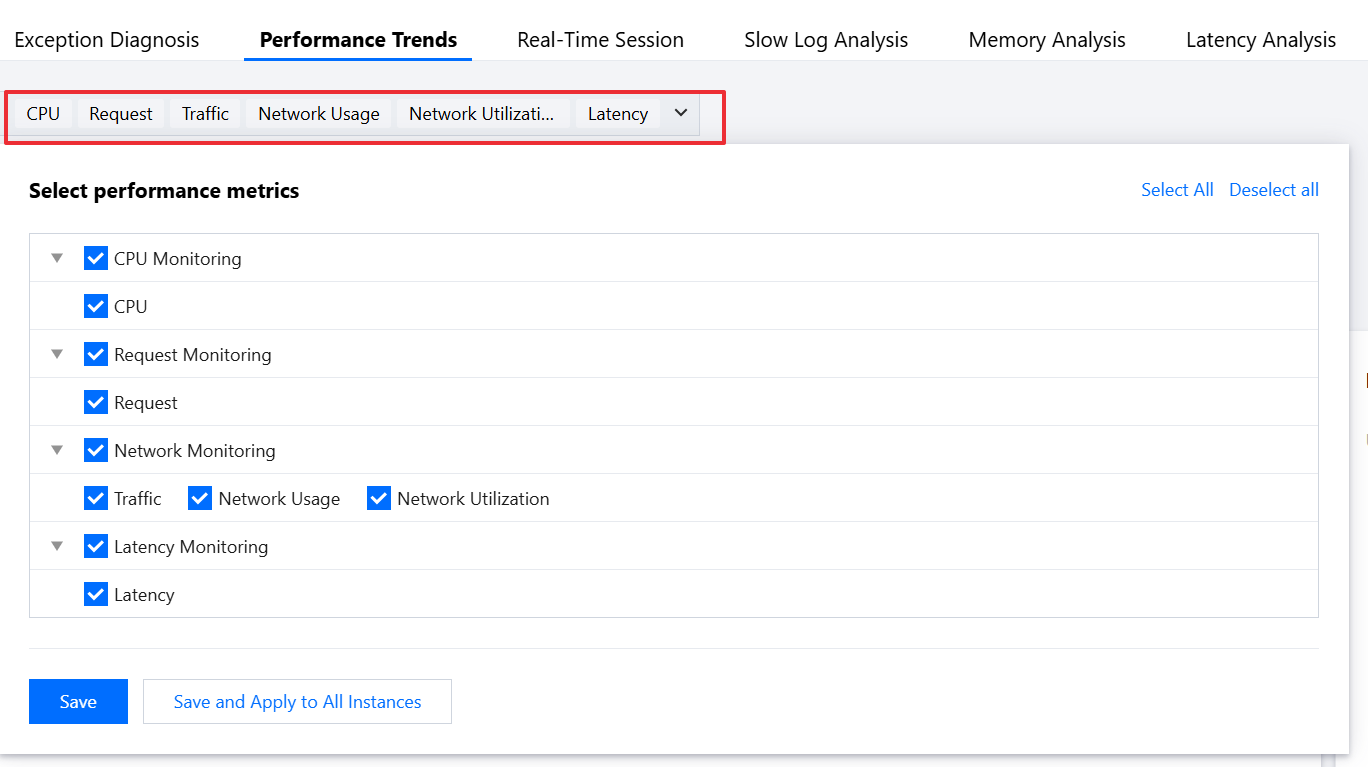

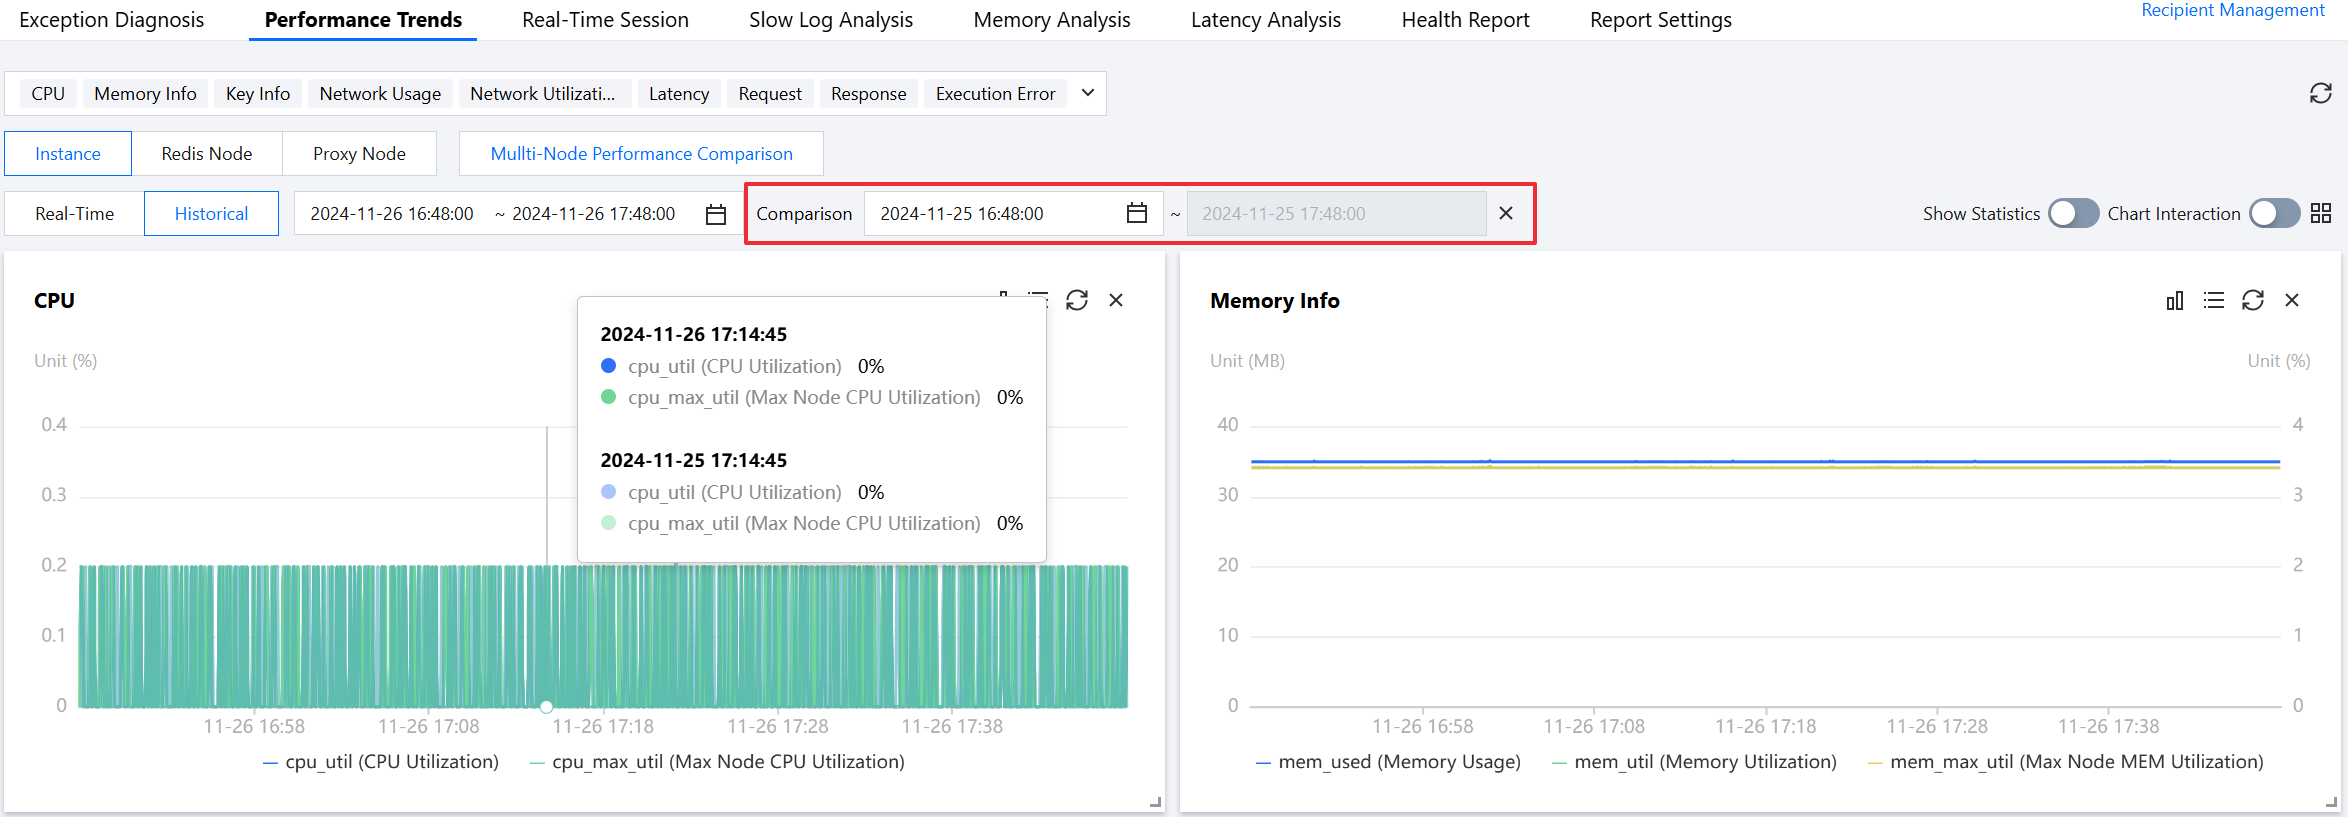

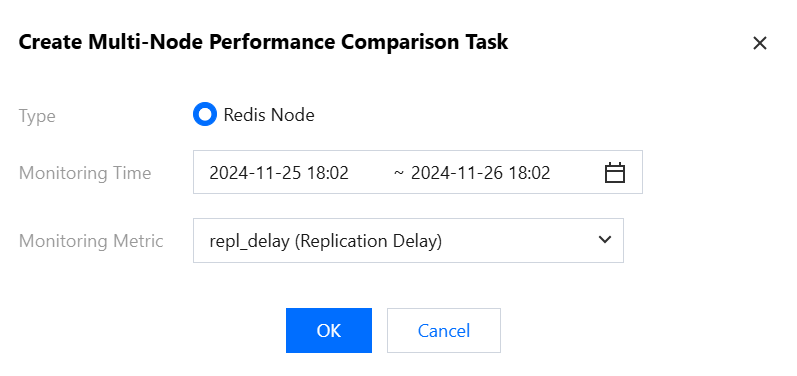

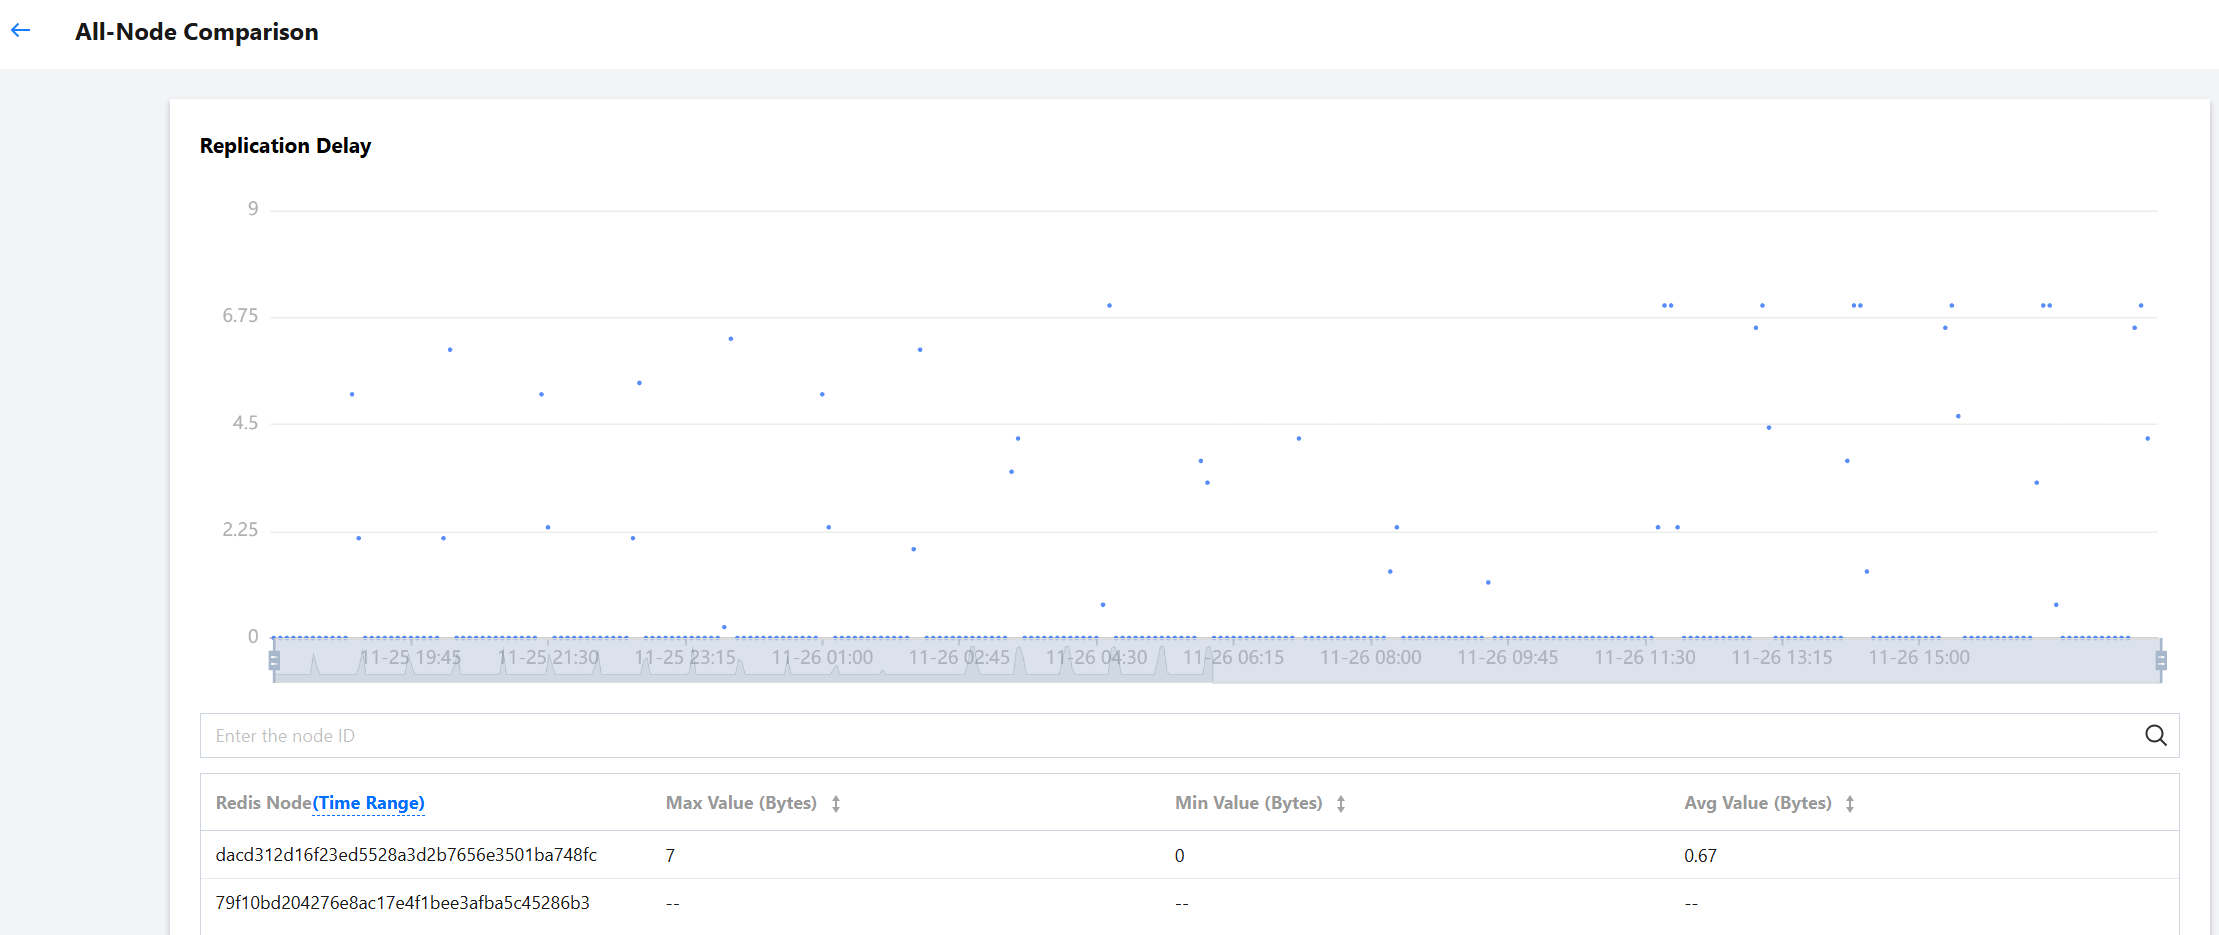



Was this page helpful?
You can also Contact sales or Submit a Ticket for help.
Help us improve! Rate your documentation experience in 5 mins.
Feedback