Query Cache
Feature Overview
Query Cache is a feature designed by MySQL to enhance database query performance. When a query statement is executed, this feature stores the query text and its corresponding result set in the query cache. If the same query is received later, the database first checks the query cache, and if a matching result is found, it returns it directly without re-parsing, optimizing, or executing the query, significantly reducing query response time. However, due to performance-related issues with MySQL's native query cache, TDSQL-C for MySQL has redesigned the query cache feature to address these shortcomings, offering an improved solution that effectively enhances database query performance.
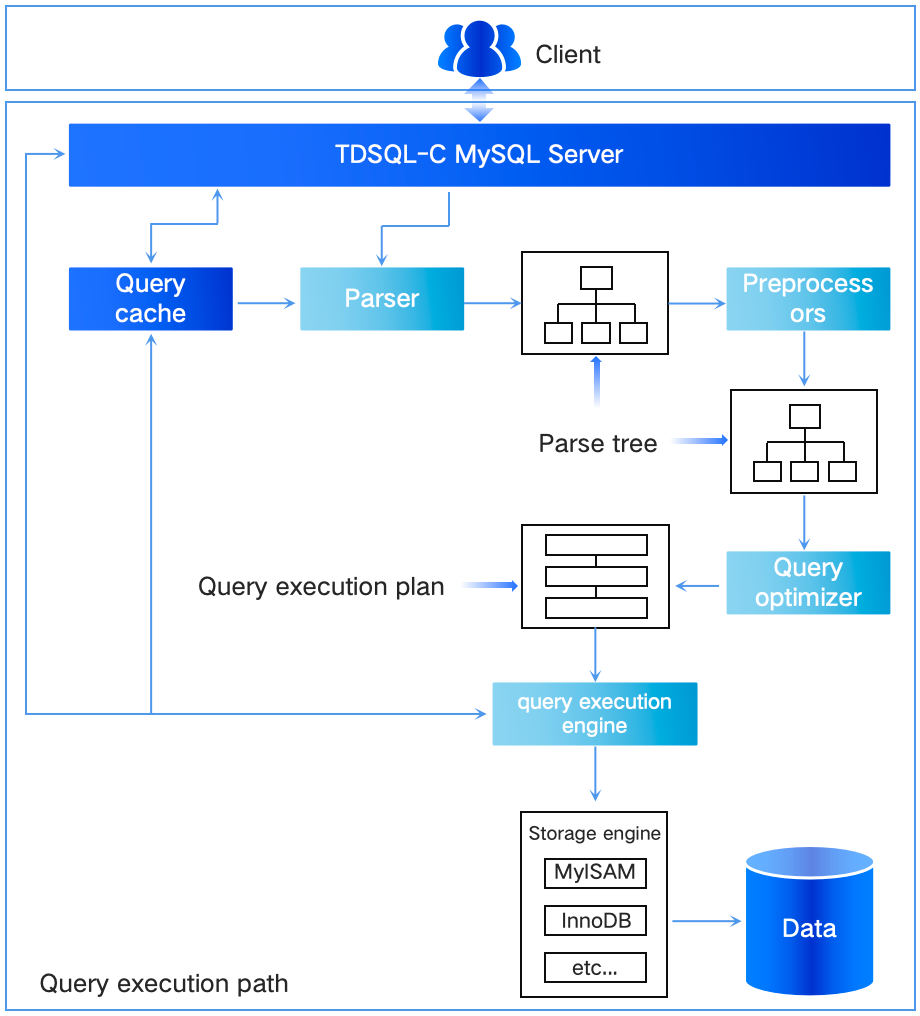
The issues with MySQL's native query cache feature:
The hit rate of the query cache and hash query performance are limited.
The query cache can waste cache space.
Configuring query cache parameters is difficult.
Optimization and description provided by TDSQL-C for MySQL to address the above issues:
Optimization Scenario | Description | Value |
Query cache partition optimization | Partitioning of Query Cache/Meta Hash is performed, mapping different types or ranges of queries precisely to specific partitions. This reduces the probability of hash collisions and accelerates the query cache positioning and retrieval process. | Improves the hash performance and hit rate of the query cache, significantly reducing CPU resource consumption in high-concurrency query scenarios, and more efficiently responding to a large number of query requests. |
Read-only node table opening optimization | Deep optimization is performed on the table opening operation during the read-only node query cache validity verification process. This reduces unnecessary cache invalidation caused by table operations, ensuring that the query cache remains effective in more scenarios. | Improves the actual utilization of the cache and the overall query performance of the system. |
Intelligent cache control based on hit rate | When the query cache hit rate is low, the intelligent cache control mechanism is automatically activated. It limits the number of concurrent queries and adjusts the sampling frequency appropriately, allowing the majority of queries to bypass the query cache. Only dedicated threads handle sampling and hit rate estimation. Once the hit rate improves, the query cache feature is re-enabled. | Prevents resource waste and performance degradation caused by a large number of queries flooding the cache system under low hit rate conditions. It reduces the space occupied by ineffective query caches and maintains stable and efficient system operation across different hit rate scenarios. |
Cache insertion and eviction overhead optimization | Optimize the cache replacement algorithm and memory management policy to reduce the frequency and resource consumption of cache insertion and eviction operations. Perform cache replacement based on proper policies, prioritizing the retention of high-frequency and important query cache results. | Reduces system performance fluctuations caused by frequent cache insertion and eviction, allowing the query cache to make the most efficient use of limited memory resources and providing continuous, stable query acceleration support. |
LRU cache policy optimization | The Query Cache LRU cache policy is finely tuned based on the query size and number of hits, prioritizing the storage of high-frequency and scalar query results. This helps avoid space waste caused by the slow cache query. | Improves cache space utilization and the system's query response performance under specific loads, ensuring that cache resources are allocated to the most valuable query tasks. |
Dynamic cache switch control | Dynamically disables the query cache when the system faces write load pressure, and enable it again within seconds after the read-write load stops. | Prevents issues related to query cache invalidation and performance degradation caused by frequent data updates. It improves the adaptability and flexibility of the query cache, allowing the system to maintain good performance in complex read-write load environments. |
Dynamic cache capacity adjustment | Supports dynamically resizing the query cache size, with the adjustment process not blocking ongoing read-write requests. The cache size is adjusted flexibly based on real-time load demands and resource availability. | Addresses performance bottlenecks caused by an improperly fixed cache size, avoiding sharp performance declines or interruptions due to cache capacity adjustments. This ensures continuous, stable, and efficient query acceleration services for the system. |
Supported Versions
Kernel version TXSQL 8.0 3.1.17.001 and later.
Use Cases
Query Cache, as a read caching system, is suitable for business load scenarios where a small amount of data is frequently read or where the workload remains read-only for extended periods.
Note:
If your business load scenario does not involve frequent reads or if each table in the database is frequently updated, using the query cache feature may result in some performance overhead.
Feature Usage Recommendations
When there are frequent reads, you can determine whether to adjust the query_cache_size to improve read performance by monitoring the status of Qcache_free_memory (remaining cache space) and Qcache_hit_rate (recent query hit rate).
When there is limited remaining cache space and the recent query hit rate is relatively low, you can improve the cache system's hit rate and enhance read performance by appropriately increasing the query_cache_size.
If increasing the query_cache_size does not significantly improve the cache hit rate, it indicates that the current load has a broad access range without a clear hotspot. You can also monitor the Qcache_queries_in_cache (number of cached queries) status to determine if the current system's cached queries can cover the frequent reads in business scenarios.
It is not recommended to set query_cache_size to more than 10% of the instance's memory, as a relatively large value of query_cache_size may pose the risk of out-of-memory (OOM).
Use Limits
Note:
The current version of Query Cache is incompatible with Database Audit. If the query cache feature is enabled, Database Audit cannot be enabled; you should disable the query cache first to enable Database Audit. Similarly, if Database Audit is enabled, the query cache feature cannot be enabled; you should disable Database Audit first to enable the query cache feature.
Use Instructions
You can use and manage the query cache feature through the following parameters. For instructions on setting the parameters, see Setting Instance Parameters.
Parameter Name | Restart Required | Global or Not | Default Value | Value Range | Supported Nodes | Description |
query_cache_limit | no | No | 1048576 | 0 - ulong_max* | Read-write instance Read-only instances | Query result sets larger than this value will not be cached. Unit: Bytes. |
query_cache_size | no | No | 1048576 | 1048576 - ulong_max* | Read-write instance Read-only instances | The size of memory available for Query Cache in the system (memory space will only be used when in use). Unit: Bytes. The value should be a multiple of 1,024. Note: In a Sysbench POC scenario, it is recommended to set the query_cache_size to more than 20% of the table size. For normal scenarios, the recommended value is around 5% of the Buffer Pool. If the business does not have read-only tables or if the hotspots are not obvious, it is recommended to reduce the value of query_cache_size. |
query_cache_type | See the description column for details. | No | OFF | OFF/ON/DEMAND | Read-write instance Read-only instances | Value: OFF – Indicates that the feature is disabled. Value: ON – Indicates that all results are cached, unless the SELECT statement uses sql_no_cache to disable query cache. Value: DEMAND – Indicates that only SELECT statements with queries explicitly specified to be cached using sql_cache are cached. Note: If the query cache is initially disabled (with query_cache_type=0 in the configuration file), it cannot be dynamically enabled and requires a restart with the my.cnf configuration file to enable the query cache. However, the query cache can always be dynamically disabled. |
query_cache_wlock_invalidate | no | No | OFF | ON/OFF | Read-write instance Read-only instances | When a write lock occurs on a table, whether the query cache related to that table should be invalidated first: ON: Yes OFF: No |
*ulong_max = 18446744073709551615
The following are the newly added statuses for the query cache. You can query the Query Cache-related status using the following command syntax.
SHOW STATUS LIKE 'Qcache%';
Status | Description |
Qcache_hits | The number of query cache hits. |
Qcache_hit_rate | The recent query hit rate, which is the proportion of queries that hit the query cache out of the last 10,000 queries (Qcache_search_times increases by 10,000). |
Qcache_search_times | The number of query cache searches (queries that are throttled or unable to use the cache are not counted). |
Qcache_total_times | The total number of times queries accessed the query cache (situations such as traffic throttling are also recorded). |
Qcache_free_memory | The remaining space in the query cache. |
Qcache_inserts | The number of times result sets are successfully cached. |
Qcache_not_cached | The number of times result sets are not cached. |
Qcache_queries_in_cache | The number of queries cached in the query cache. |
Qcache_lowmem_prunes | The number of query cache entries evicted due to the LRU cache policy. |
Performance Testing
Test Environment
Number of secondary nodes: 1 read-write instance and 1 read-only instance.
Cluster configuration: 8 cores and 16 GB.
Testing tool: Sysbench 1.0.20.
Database kernel version: TXSQL 8.0 3.1.15.004.
Data volume:
Full cache scenario: The data volume of Sysbench is approximately 1.4 GB, with a total of 25,000 x 250 tables.
Large I/O scenario: The data volume of Sysbench is approximately 54 GB, with a total of 800,000 x 300 tables.
Testing Objectives, Scenarios, Steps, and Results
Testing Objective | Testing Scenarios | Testing Steps and Results |
The performance improvement of query cache in read scenarios. | The performance improvement brought by Query Cache under different data volumes. | |
The impact of query cache size (query_cache_size) on performance. | The performance improvement brought by Query Cache under different query_cache_size values and data volumes. |
Testing Scenario 1: Performance Improvement of Query Cache in Read Scenarios
Testing steps
1. Enable the query cache feature (set the parameter query_cache_type to ON) and set the query_cache_size value to 1073741824 (which equals 1,024 MB).
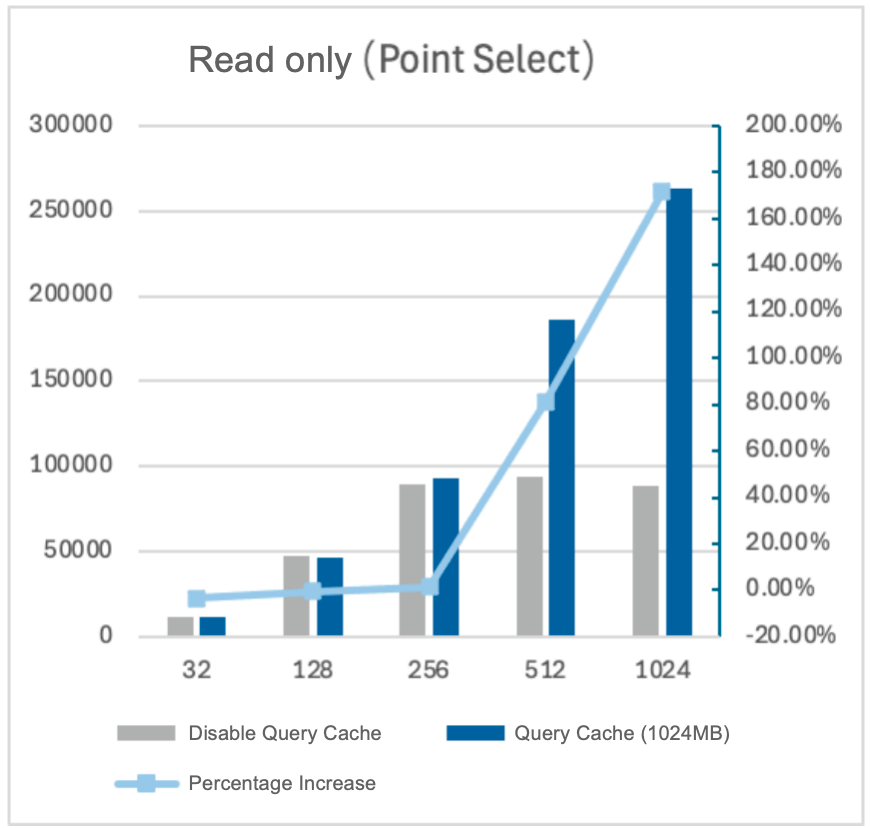
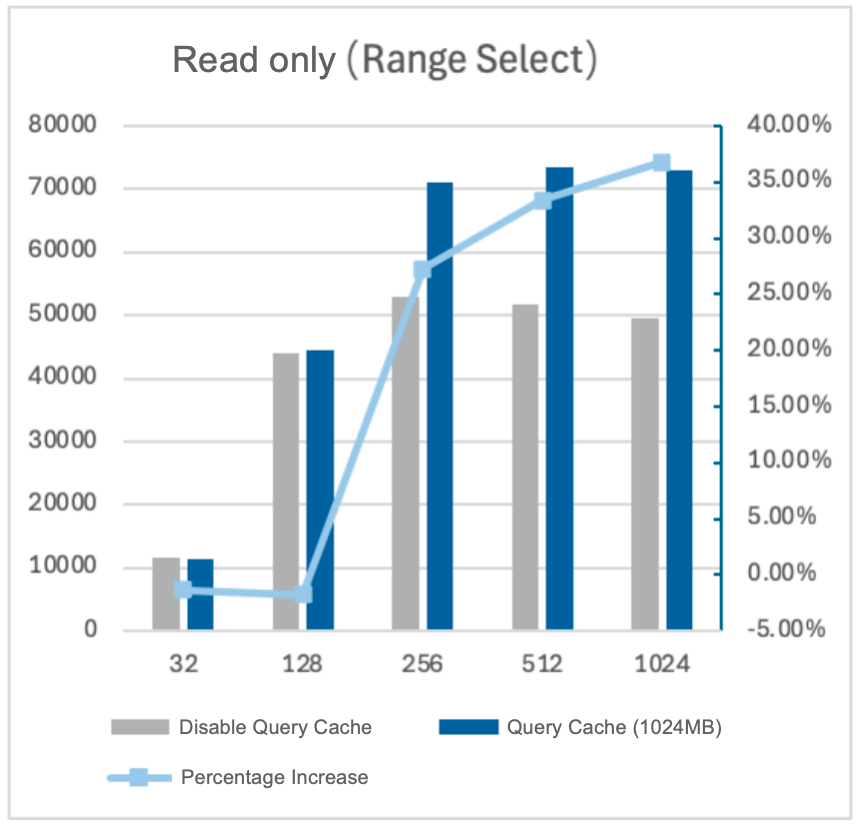
2. In the full cache scenario, record the cluster's QPS under different levels of concurrency. The data volume of Sysbench is approximately 1.4 GB, with a total of 25,000 x 250 tables.
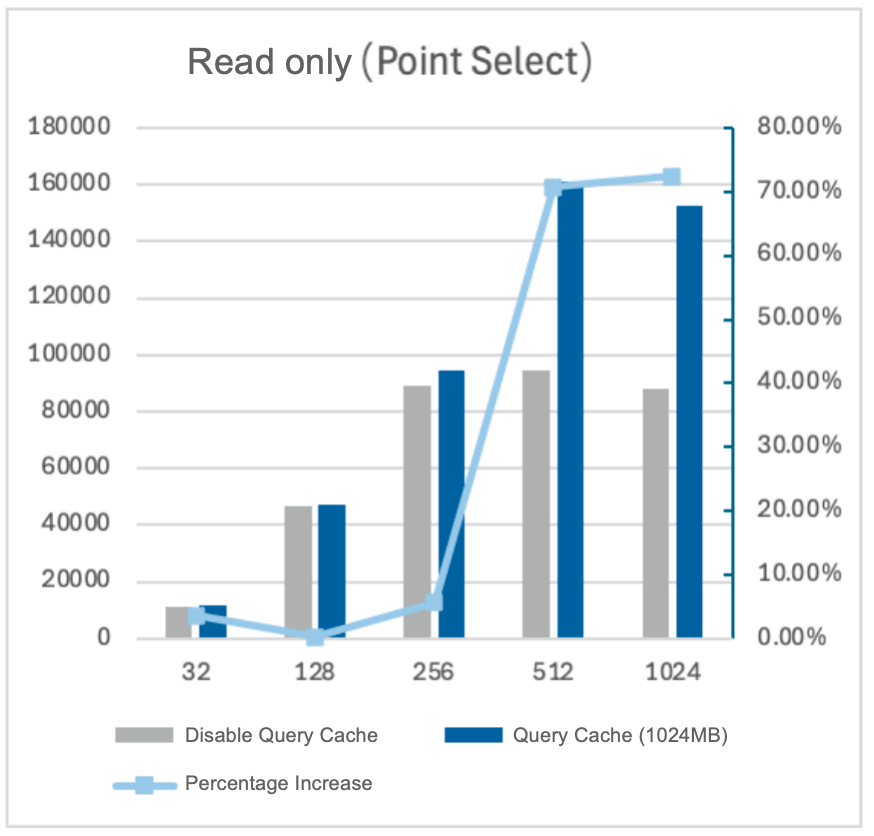
3. In the large I/O scenario, record the cluster's QPS under different levels of concurrency. The data volume of Sysbench is approximately 54 GB, with a total of 800,000 x 300 tables.
Testing results
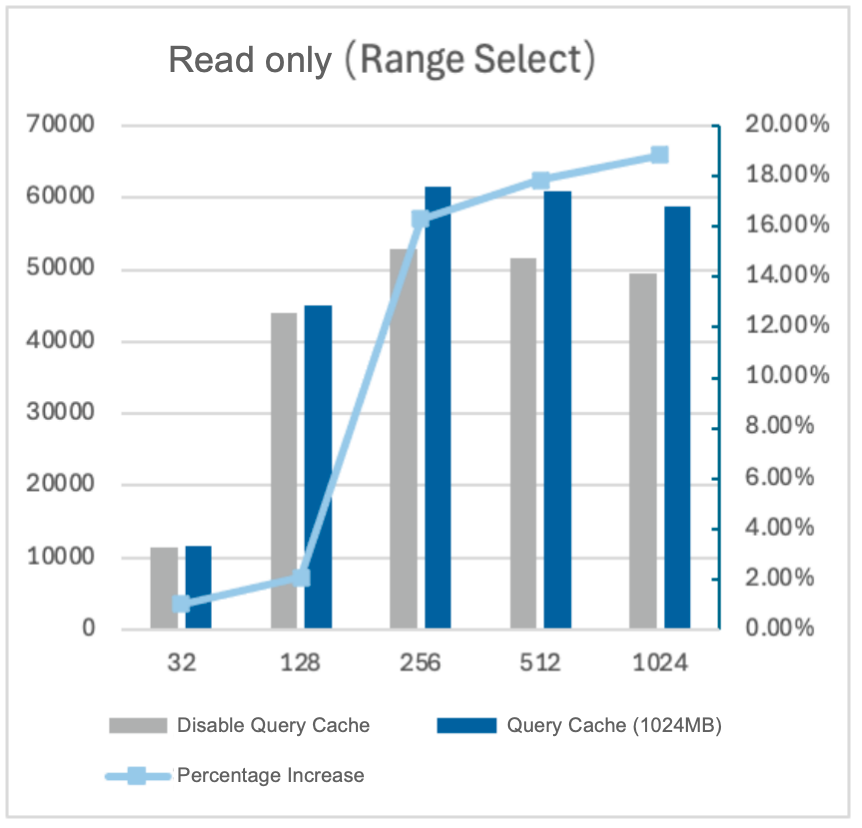
1. In the full cache scenario, with 16 GB of machine memory and a data size of 1.4 GB, enabling Query Cache resulted in a performance improvement of approximately 171% for point queries and 36% for range queries.
2. In the large I/O scenario, with 16 GB of machine memory and a data size of 54 GB, enabling Query Cache resulted in a performance improvement of approximately 36% for point queries and 10% for range queries.
Testing Scenario 2: Impact of Query Cache Size on Performance
Testing steps
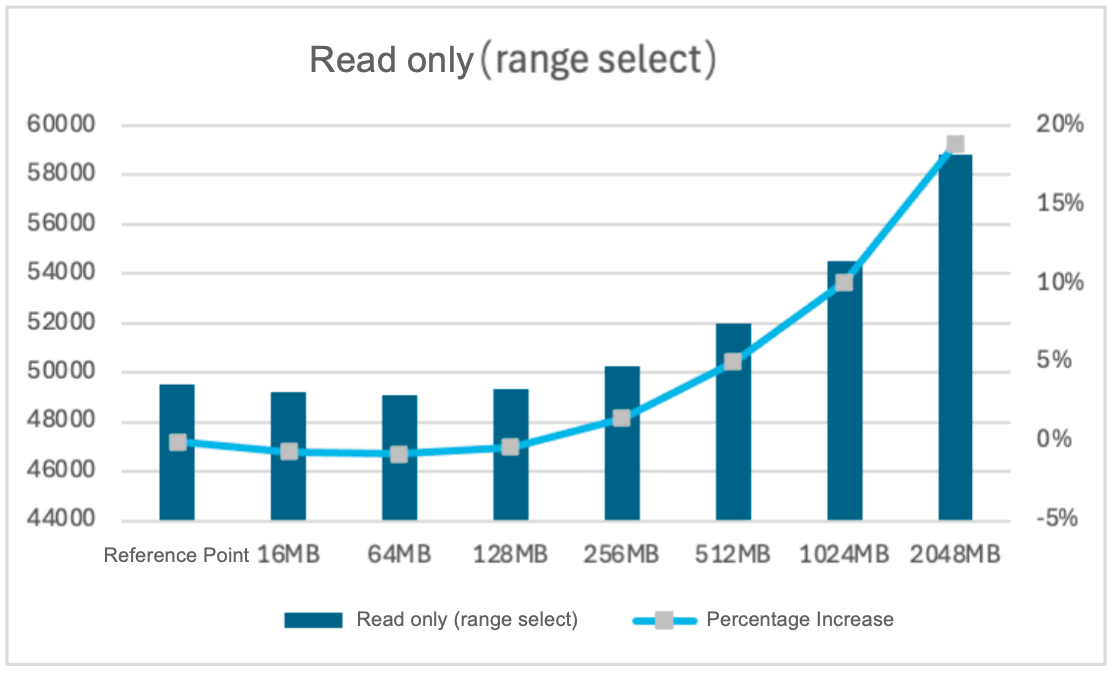
1. Set the concurrency level to 1,024 and enable the query cache (set the parameter query_cache_type to ON).
2. In the full cache scenario, adjust the query cache size (query_cache_size) and perform performance testing, recording the cluster's QPS.
3. In the large I/O scenario, adjust the query cache size (query_cache_size) and perform performance testing, recording the cluster's QPS.
Testing results
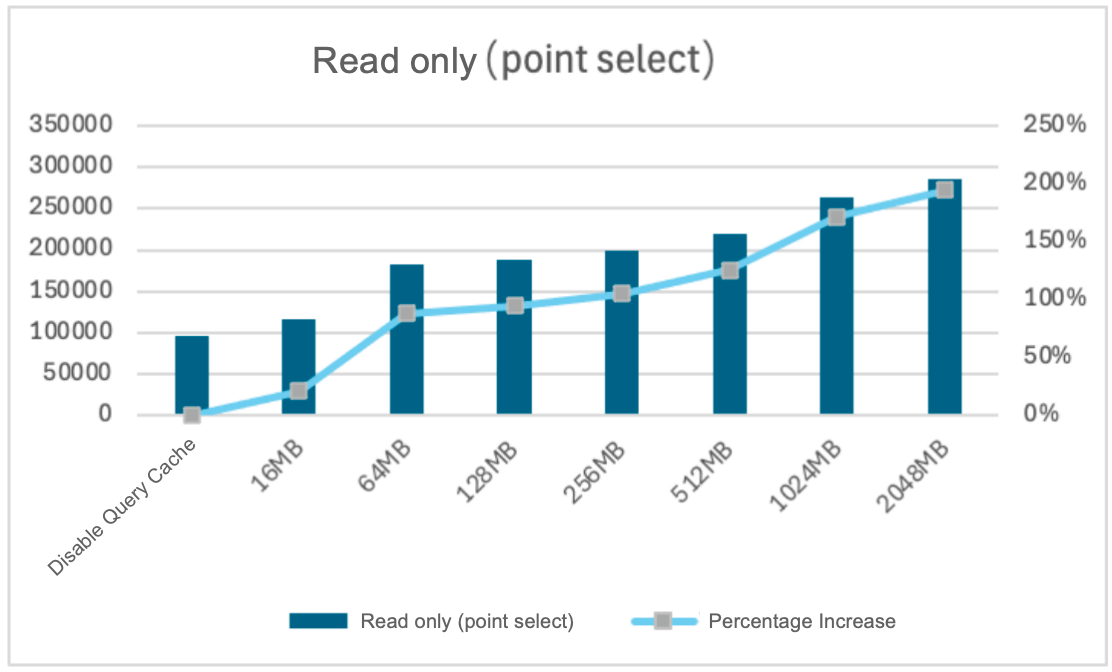
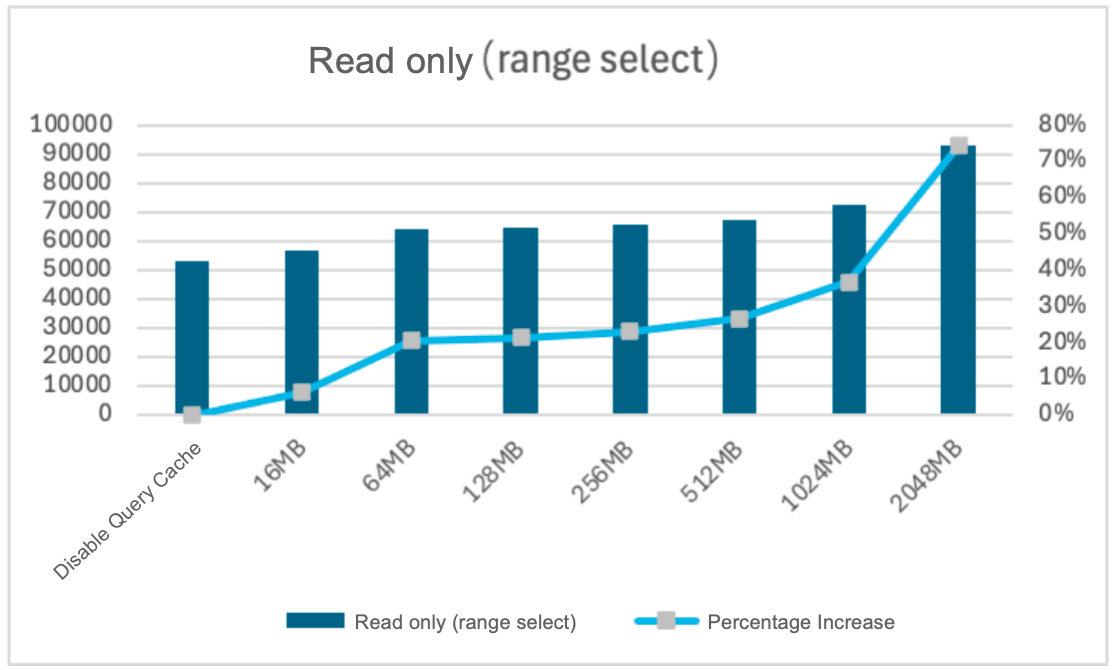
1. In the full cache scenario, as the query cache size increases, performance gradually improves. When the query cache is set to 2,048 MB, the performance improvement for point queries (Point Select) is approximately 194%, and for range queries (Range Select), the improvement is approximately 74%.
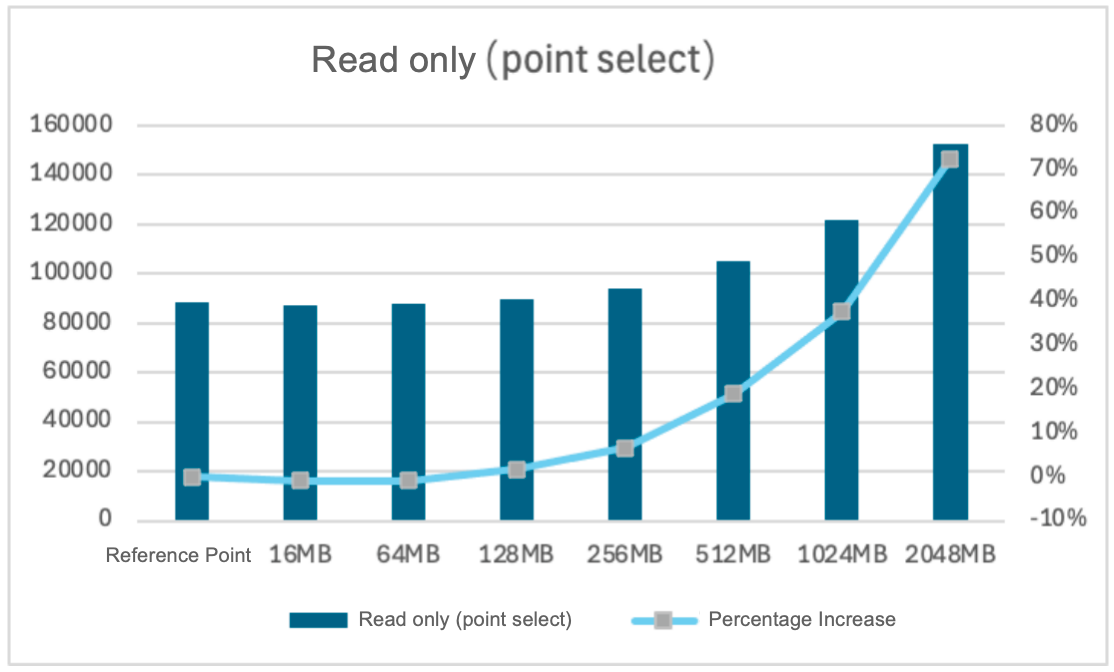
2. In the large I/O scenario, as the query cache size increases, performance gradually improves. When the query cache is set to 2,048 MB, the performance improvement for point queries (Point Select) is approximately 72%, and for range queries (Range Select), the improvement is approximately 19%.
Help and Support
Was this page helpful?
You can also Contact sales or Submit a Ticket for help.
Help us improve! Rate your documentation experience in 5 mins.
Feedback