Release Notes
Announcements

Monitoring Metric | Description |
Heaped messages | Activemessages, which indicates the total number of messages that are in “Active” status in the queue in the selected time range. The metric value is approximate. |
Invisible messages | A message will be made invisible (in “Inactive” status) after being fetched by the consumer. It will become visible (in “Active” status) again if it is not consumed after the VisibilityTimeout. |
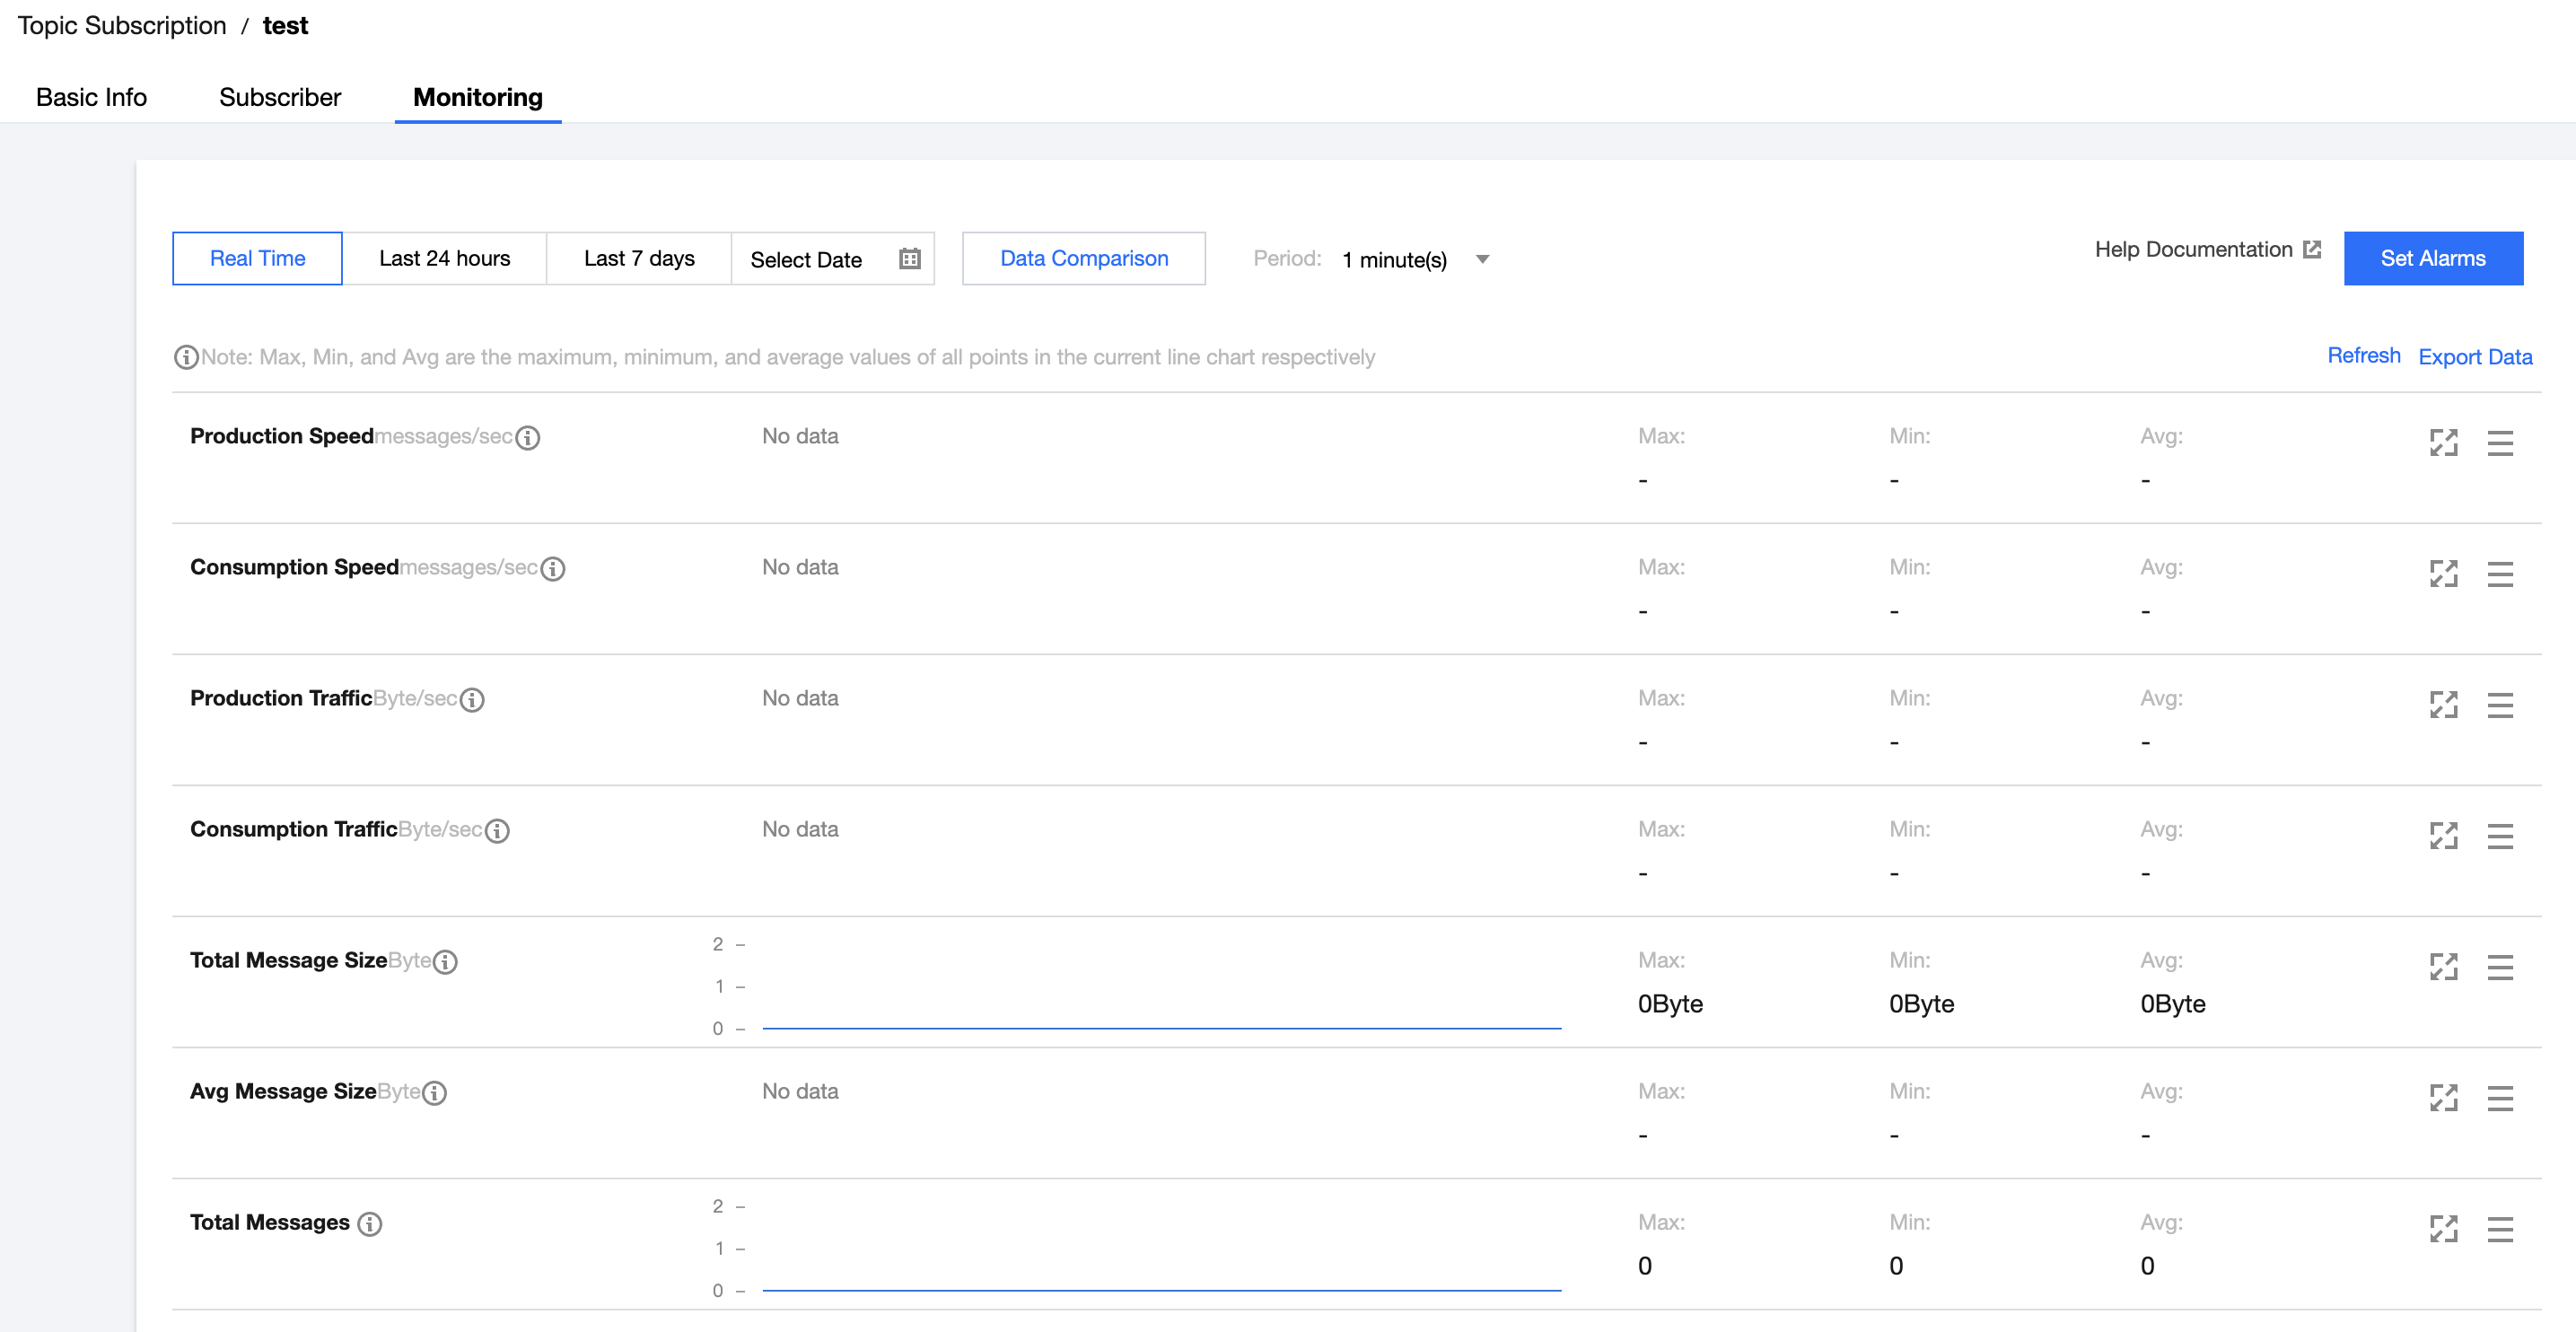
Production rate (messages/sec) | The number of messages produced by all producers in the queue per second in the selected time range. |
Production rate (messages/sec) | The number of messages consumed by all consumers in the queue per second in the selected time range. |
Production traffic (bytes/sec) | The size of messages produced by all producers in the queue per second in the selected time range. |
Consumption traffic (bytes/sec) | The size of messages consumed by all consumers in the queue per second in the selected time range. |
Total message size (bytes) | The total data size of current messages |
Average message size (bytes) | The average data size of current messages |
Total number of messages | The total number of current messages |
Was this page helpful?
You can also Contact sales or Submit a Ticket for help.
Help us improve! Rate your documentation experience in 5 mins.
Feedback