Network Detection and Response Switch
Configure Network Detection and Response Switch
1. Log in to the CFW console, in the left sidebar, click Network Detection and Response.
Note:
Go to CFW purchase page to purchase the Network Detction and Response feature.
To try out, you can submit a ticket to apply for a trial of the Network Detction and Response feature.
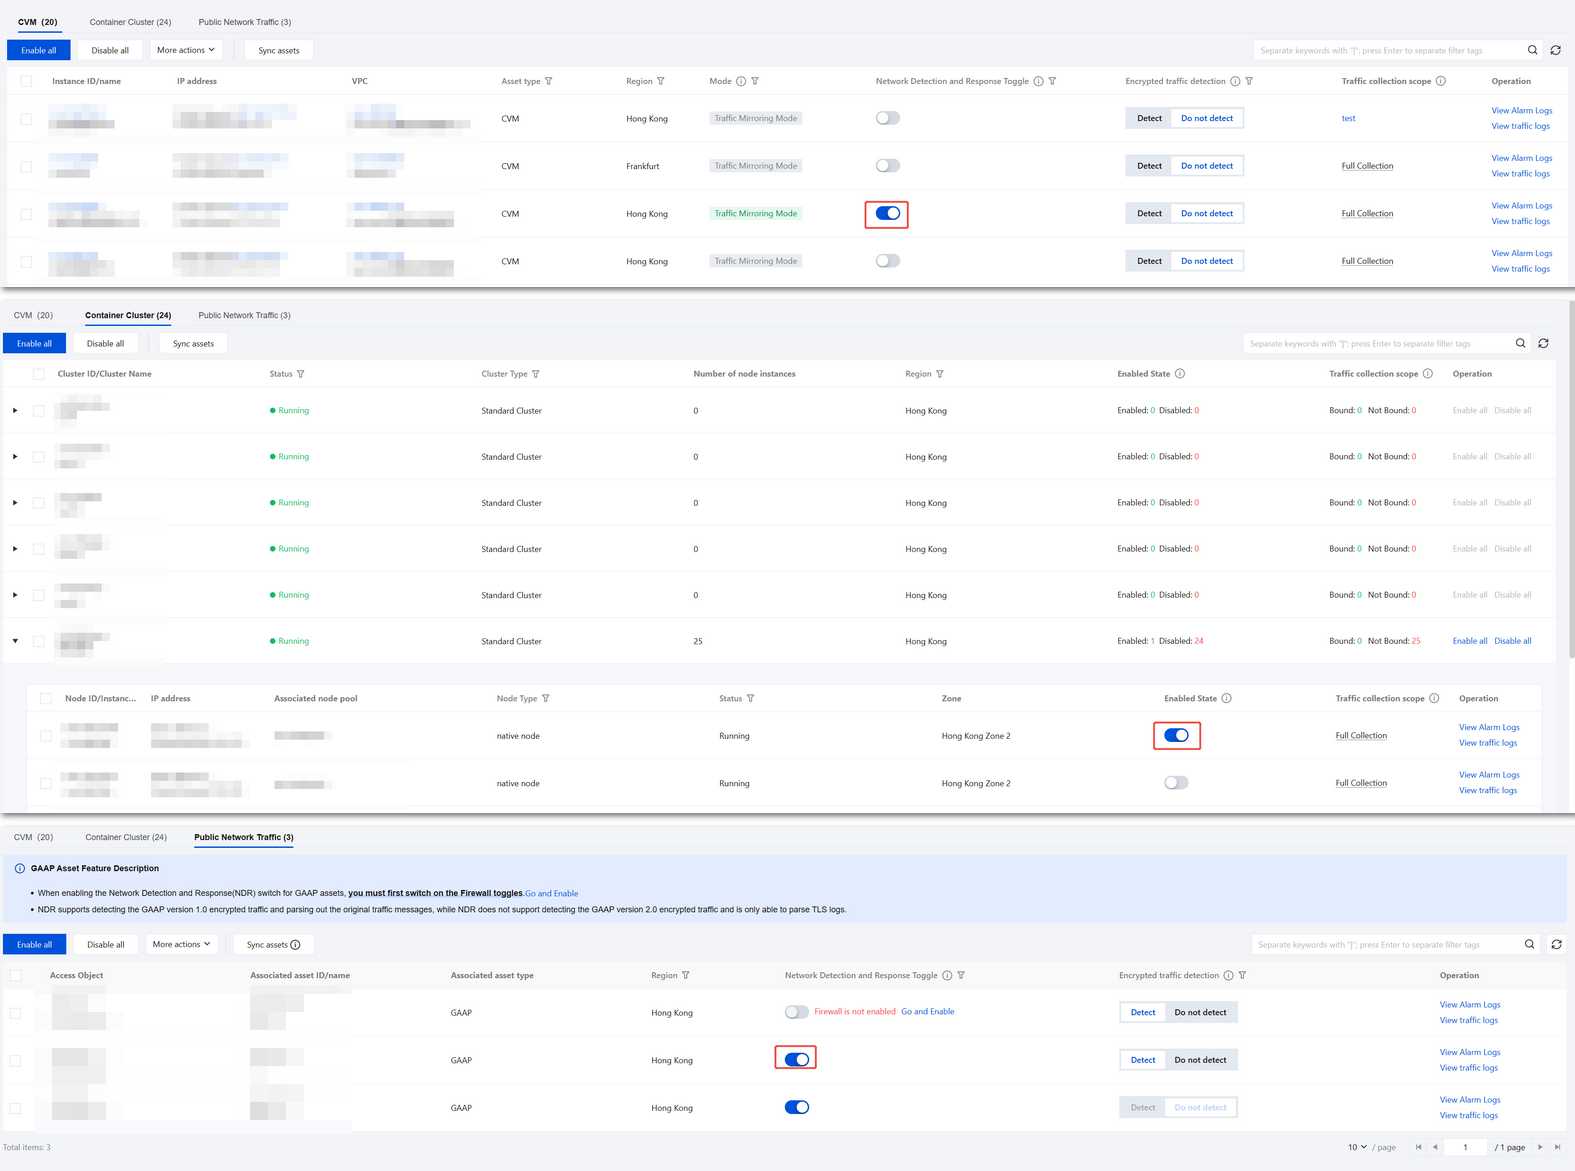
2. On the Network Detection and Response page, container clusters support enabling the NDR analysis switch based on nodes, while CVM and public network traffic support enabling the NDR analysis switch based on assets.
After the Network Detction and Response switch is enabled, CFW mirrors outbound/inbound server traffic to perform the following analyses:
All traffic will pass through the Intrusion Defense engine for detection and analysis based on rules, and alarms will be triggered.
Logs record all traffic entering and exiting the server, including packet headers (Header) and payloads (Payload). For non-encrypted traffic, the Payload will be analyzed and interpreted to restore the protocol and application, with each packet recorded up to a maximum of 1000 bytes.
CVM supports enabling the Encrypted Traffic Detection feature, which can analyze and detect encrypted traffic. For more details, see Encrypted Traffic Detection.
Note:
If you need to enable Network Detection and Response for the public network traffic of GAAP assets, please first enable the corresponding CFW switches for the assets. You can click Go and Enable to quickly jump to the CFW console and complete the configuration.
If enabling the NDR analysis switch fails, the page will display a red warning icon and exception information, indicating that the current detection is unavailable. The exception information and guidance include:
Failure Reason Categories | Solution |
The current region does not support the traffic analysis service. | The Traffic Analysis service is not deployed in the current region. Please submit a ticket to confirm regional support and assess deployment feasibility. |
The subnet ID of the asset instance does not exist. | The subnet ID of the asset instance is detected as invalid or deleted. Please go to VPC Firewall to verify the subnet information. Click Synchronize Assets and try again. |
The IP address format of the asset instance is invalid. | The IP address format of the asset instance does not comply with the specifications. Please go to VPC Firewall, click Synchronize Assets, and try again. |
The current operating system type is not supported. | The current operating system is not supported. Please go to technical solution to confirm compatibility. |
Endpoint TAT not detected. | The instance does not have Endpoint TAT installed. Please see TAT Deployment Guide and retry after completing the installation. |
Network bandwidth has reached the upper limit. | Real-time bandwidth has reached the purchased limit. Recommendation: 1. Disable the non-essential traffic analysis switch. 2. Go to Renewal Center to upgrade the full traffic detection specification or wait for traffic to decrease and try again. |
The number of enabled asset instances has reached the upper limit. | |
Single machine bandwidth overloaded operation | Current server real-time bandwidth utilization >40% (which means real-time bandwidth usage and mirror traffic together exceed 80% of total bandwidth). The system has automatically restricted the traffic analysis feature. Recommendation: 1. Wait for 10 minutes and retry. 2. Go to CVM to upgrade the instance specification. |
The current instance type does not support traffic mirroring mode. | The current instance model does not support traffic mirroring mode. Please submit a ticket to request adding model adaptation. |
The traffic mirroring feature is not enabled. | The current account has not been added to the allowlist for VPC traffic mirroring service. Please submit a ticket to apply (specify VPCID and region information). |
Associated traffic mirroring resources already exist. | An existing traffic mirroring instance has been detected. Go to Mirror Traffic to delete the capture ENI and retry. |
The number of traffic mirrors exceeds the quota limitation. | By default, a single VPC supports 5 traffic mirroring instances. To scale out, please submit a ticket to request a quota adjustment (provide VPCID and required quantity). |
The server is temporarily unavailable. Please try again later. | Temporary unavailability of the server has been detected. Please wait 5 minutes and try again. If the issue persists, please submit a ticket to contact technical support. |
Network Detection and Response Settings
Basic Settings
1. On the NDR page, click Network Detection and Response Settings in the upper-right corner, then go to Basic Settings.
2. New Asset Traffic Analysis Settings, NDR Bandwidth Settings, and NDR Overage Handling can be configured here.
New Asset Traffic Analysis Settings: Allows you to set whether new assets Auto on all traffic detect and respond and Automatically enable encrypted traffic analysis.
When the asset type is set to All New Assets
When Enable is selected for the switch for Auto on all traffic detect and respond, traffic analysis will be automatically enabled upon discovery of new public/non-public network CVMs, containers, and public network traffic assets.
When Disable is selected for the switch for Auto on all traffic detect and respond traffic analysis will not be automatically enabled upon discovery of new assets (public/non-public network CVMs, containers, and public network traffic assets).
When Enable is selected for the switch for Automatically enable encrypted traffic analysis, encrypted traffic analysis will be automatically enabled upon discovery of new public/non-public network CVMs, containers, and public network traffic assets.
When Disable is selected for the switch for Automatically enable encrypted traffic analysis, encrypted traffic analysis will not be automatically enabled upon discovery of new assets (public/non-public network CVMs, containers, and public network traffic assets).
When the asset type is set to Only New Public Network Assets
When Enable is selected for the switch for Auto on all traffic detect and respond, traffic analysis will be automatically enabled upon discovery of new public network CVM assets and public network traffic assets; non-public network assets will not have traffic analysis automatically enabled.
When Disable is selected for the switch for Auto on all traffic detect and respond, traffic analysis will not be automatically enabled upon discovery of new assets (public/non-public network CVMs, containers, and public network traffic assets).
When Enable is selected for the switch for Automatically enable encrypted traffic analysis, traffic analysis will be automatically enabled upon discovery of new public network CVM assets and public network traffic assets; encrypted traffic analysis will not be automatically enabled for non-public network assets.
When Disable is selected for the switch for Automatically enable encrypted traffic analysis, encrypted traffic analysis will not be automatically enabled upon discovery of new assets (public/non-public network CVMs, containers, and public network traffic assets).
Network Detection and Response bandwidth settings
Total traffic is the sum of peak inbound and outbound traffic of all instances. Please ensure the traffic analysis bandwidth or elastic analysis bandwidth is larger than the total traffic.
Elastic Protection: Set elastic analysis bandwidth. Analyze when traffic is less than the elastic analysis bandwidth. Perform overage handling when traffic is larger than the elastic analysis bandwidth. For details on billing and excess traffic handling, see Bandwidth Details. You can adjust the elastic analysis bandwidth value as needed. Click Edit to modify, and after completion, click Confirm to Adjust to save the settings.

Network Detection and Response overage handling: Exceeding bandwidth for traffic analysis will not cause packet loss or impact traffic rates in customer services, but will disable the Network Detction and Response feature.
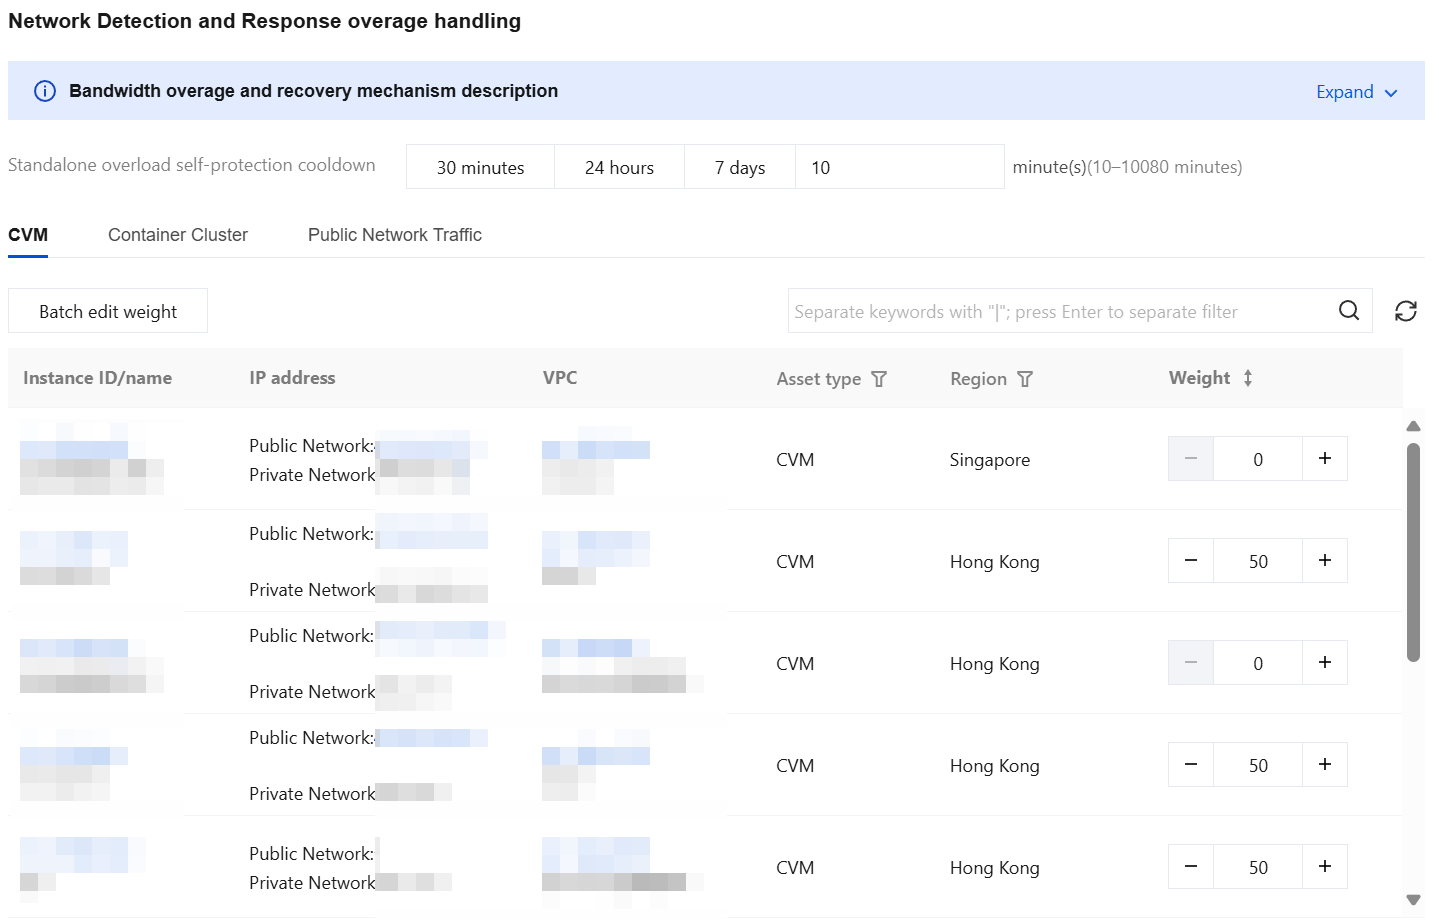
Bandwidth specification exceeded traffic throttling and recovery mechanism
Weight range: 0 - 100 (default 50), larger values represent higher priorities.
Traffic throttling mechanism: when real-time bandwidth exceeds purchase specs, the system automatically closes high-weight resolutions first (if weights are identical, close in descending order of peak bandwidth) until real-time bandwidth drops to within purchase specs.
The recovery mechanism: when real-time bandwidth ≤ purchase specs, the system preferentially enables high-weight resolution (if weights are identical, start in descending order of peak bandwidth), with auto on for Network Detection and Response.
Single machine bandwidth overload self-protection and recovery mechanism
Cooldown: default 24 hours, shortest 10 minutes, longest 7 days, customizable configuration.
Self-protection mechanism: Every 30s detect server bandwidth utilization. When server bandwidth utilization > 40% (due to mirror traffic, corresponding total bandwidth utilization > 80%), the system disables Network Detection and Response for this server.
Recovery mechanism: every 30s detect server bandwidth utilization. When server bandwidth utilization remains ≤ 40% during the last 2 minutes of cooldown, the system automatically activates Network Detection and Response.
You can perform batch edits on weights.
Bandwidth specification overage will trigger system banner alerts. Both overage alarms and handling notifications will be sent based on your configuration in Notification Setting.
Storage Settings
1. On the NDR page, click Network Dection and Response Settings in the upper-right corner, then go to Storage Settings.
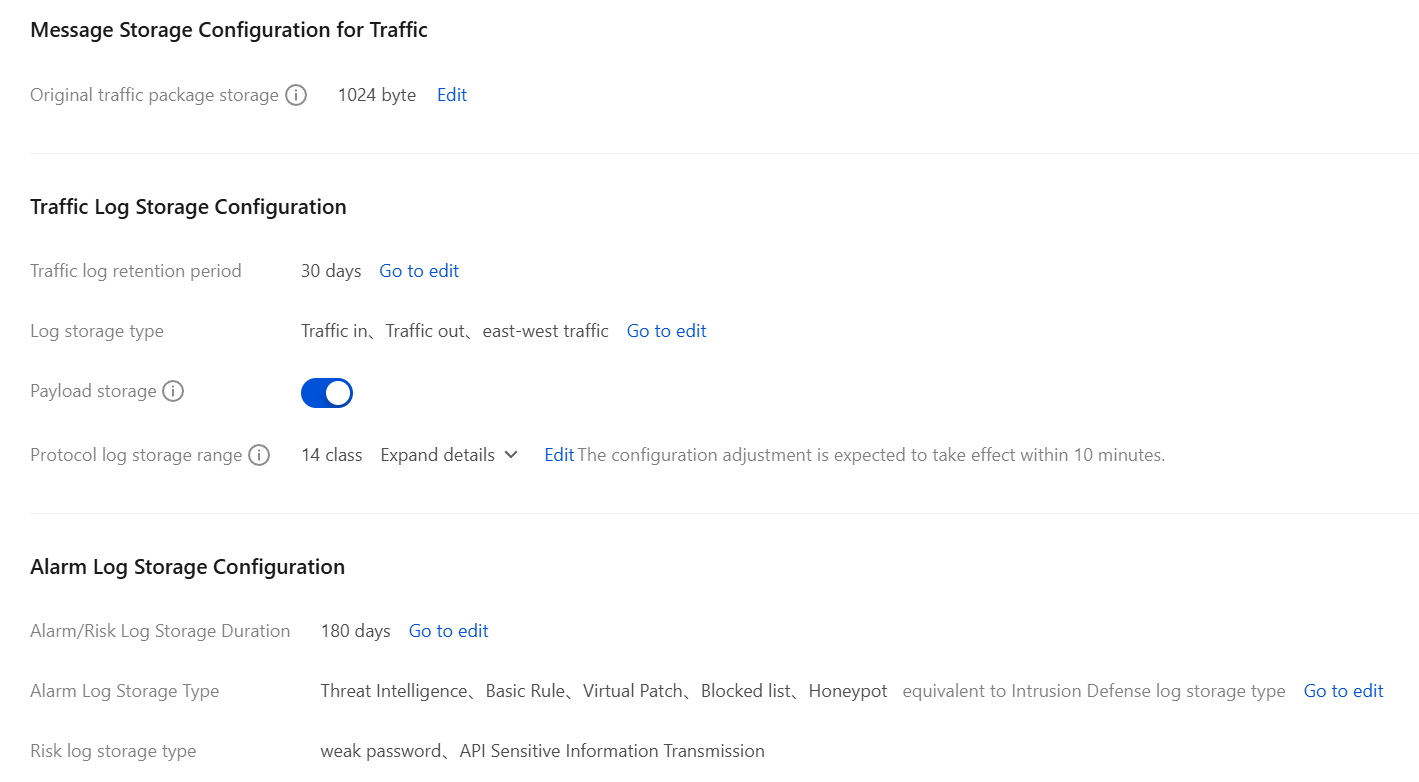
2. You can configure Traffic Message Storage, Traffic Log Storage, and Alarm Log Storage here.
Note:
Enterprise Edition or higher users can modify the log storage type and storage duration, with a limit of once per month and takes effect within approximately 10 minutes.
Parameter Name | Parameter Description | |
Traffic Message Storage Configuration | Original Traffic Package Storage | Supports setting the storage length for the req_hex, rsp_hex, http_request_body, and http_response_body fields, defaults to 1024 bytes. Optional values: 64, 128, 256, 512, 1024 bytes. |
Traffic Log Storage Configuration | Traffic Log Retention Period | Go to the Log Storage Type Configuration page; default is 180 days. Optional values: 7, 30, 60, 90, 180 days. |
Traffic | Log Storage Type | Go to the Log Storage Type Configuration page, where multiple selections can be made from
Traffic in、Traffic out and east-west traffic. |
| Payload Storage | When enabled: HTTP data parsing fully saved. When it is disabled: only HTTP request and response headers are retained; HTTP Payload details and TCP request/response packets are not retained. |
| Protocol Log Storage Range | Set the network protocol scope for storing Network Detection and Response traffic logs. Basic Protocol Class: ICMP, TCP, UDP Email: SMTP, SMTPS Internet Type HTTP, HTTPS, DNS File Transfer: FTP, SMB, FTP-DATA Log-in Authentication: TLS Remote Management Class: SSH, DCERPC |
Alarm Log Storage Configuration | Alarm/Risk Log Retention Period | Go to the Log Storage Type Configuration page; you can set the log retention period to 7, 30, 60, 90, or 180 days. |
| Alarm Log Storage Type | Go to the Log Storage Type Configuration page, where multiple selections can be made from Threat Intelligence, Basic Rule, Virtual Patch, Blocked list and Honeypot. |
| Risk Log Storage Type | Network Detection and Response risk logs do not support configuration of storage type. By default, for weak password and API Sensitive Information Transmission, they are selected and cannot be modified. |
File Detection Settings
1. On the NDR page, click Network Detection and Response Settings in the upper-right corner, then go to the page and select File Detection Settings.
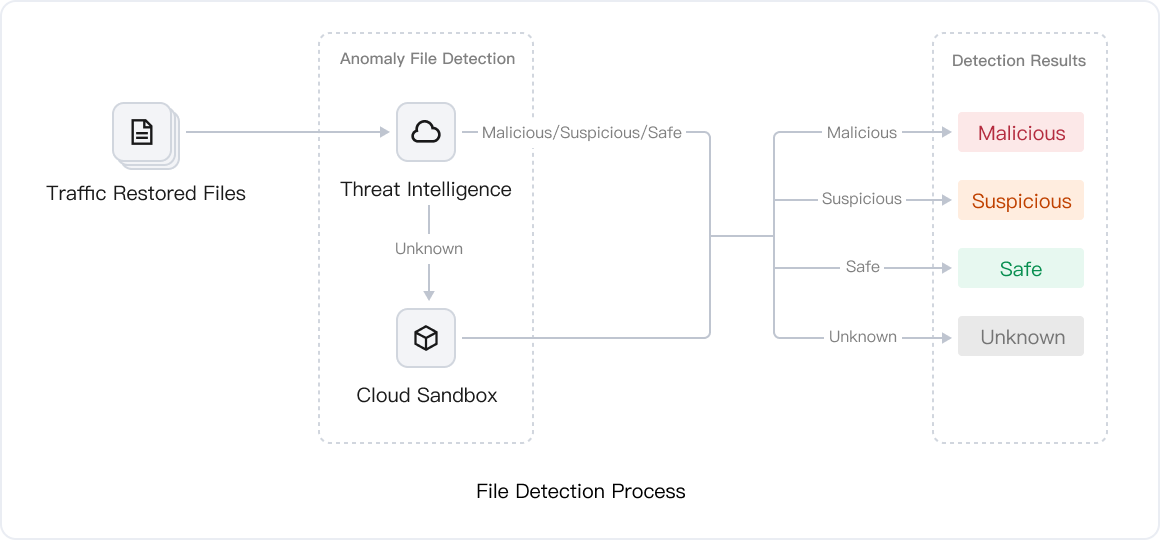
2. You can enable the Abnormal File Transfer Detection feature here. The Abnormal File Transfer Detection capability fully reconstructs files transmitted in network traffic, coordinates with Threat Intelligence and Cloud Sandbox dynamic behavior detection engines to perform deep scans on suspicious files, thereby accurately identifying and determining security threats.
Risk Analysis Settings
1. On the NDR page, click Network Detction and Response Settings in the upper-right corner, then go to the page and select Risk Analysis Settings.
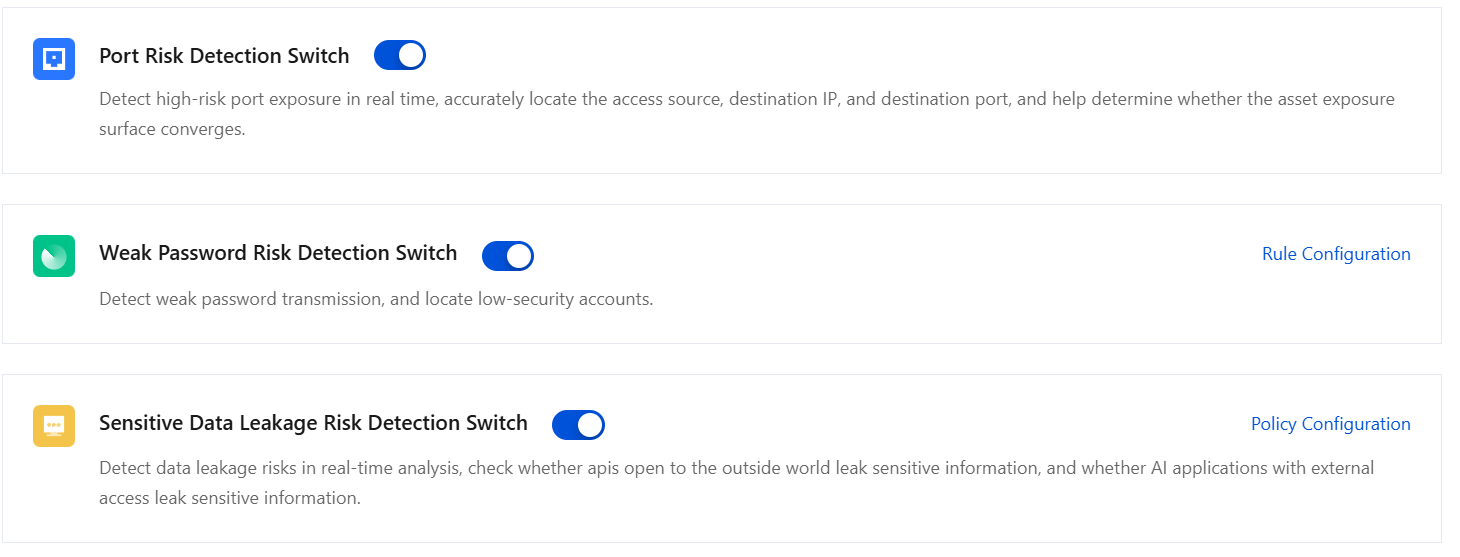
2. You can toggle the switches for Port Risk, Weak Password Risk, and Sensitive Data Leakage Risk here:
Port Risk Detection Switch: Detect high-risk port exposure in real time, accurately locate the access source, destination IP, and destination port, and help determine whether the asset exposure surface converges.
Weak Password Risk Detection Switch: Detect weak password transmission, and locate low-security accounts. Click Rule Configuration to view specific detection rules.
Sensitive Data Leak Risk Detection Switch: Detect data leakage risks in real-time analysis, check whether apis open to the outside world leak sensitive information, and whether AI applications with external access leak sensitive information. Click Policy Configuration to enable or disable specific detection policies.
Notification Settings
1. On the NDR page, click Network Detection and Response Settings in the upper-right corner, then go to the page and select Notification Setting.
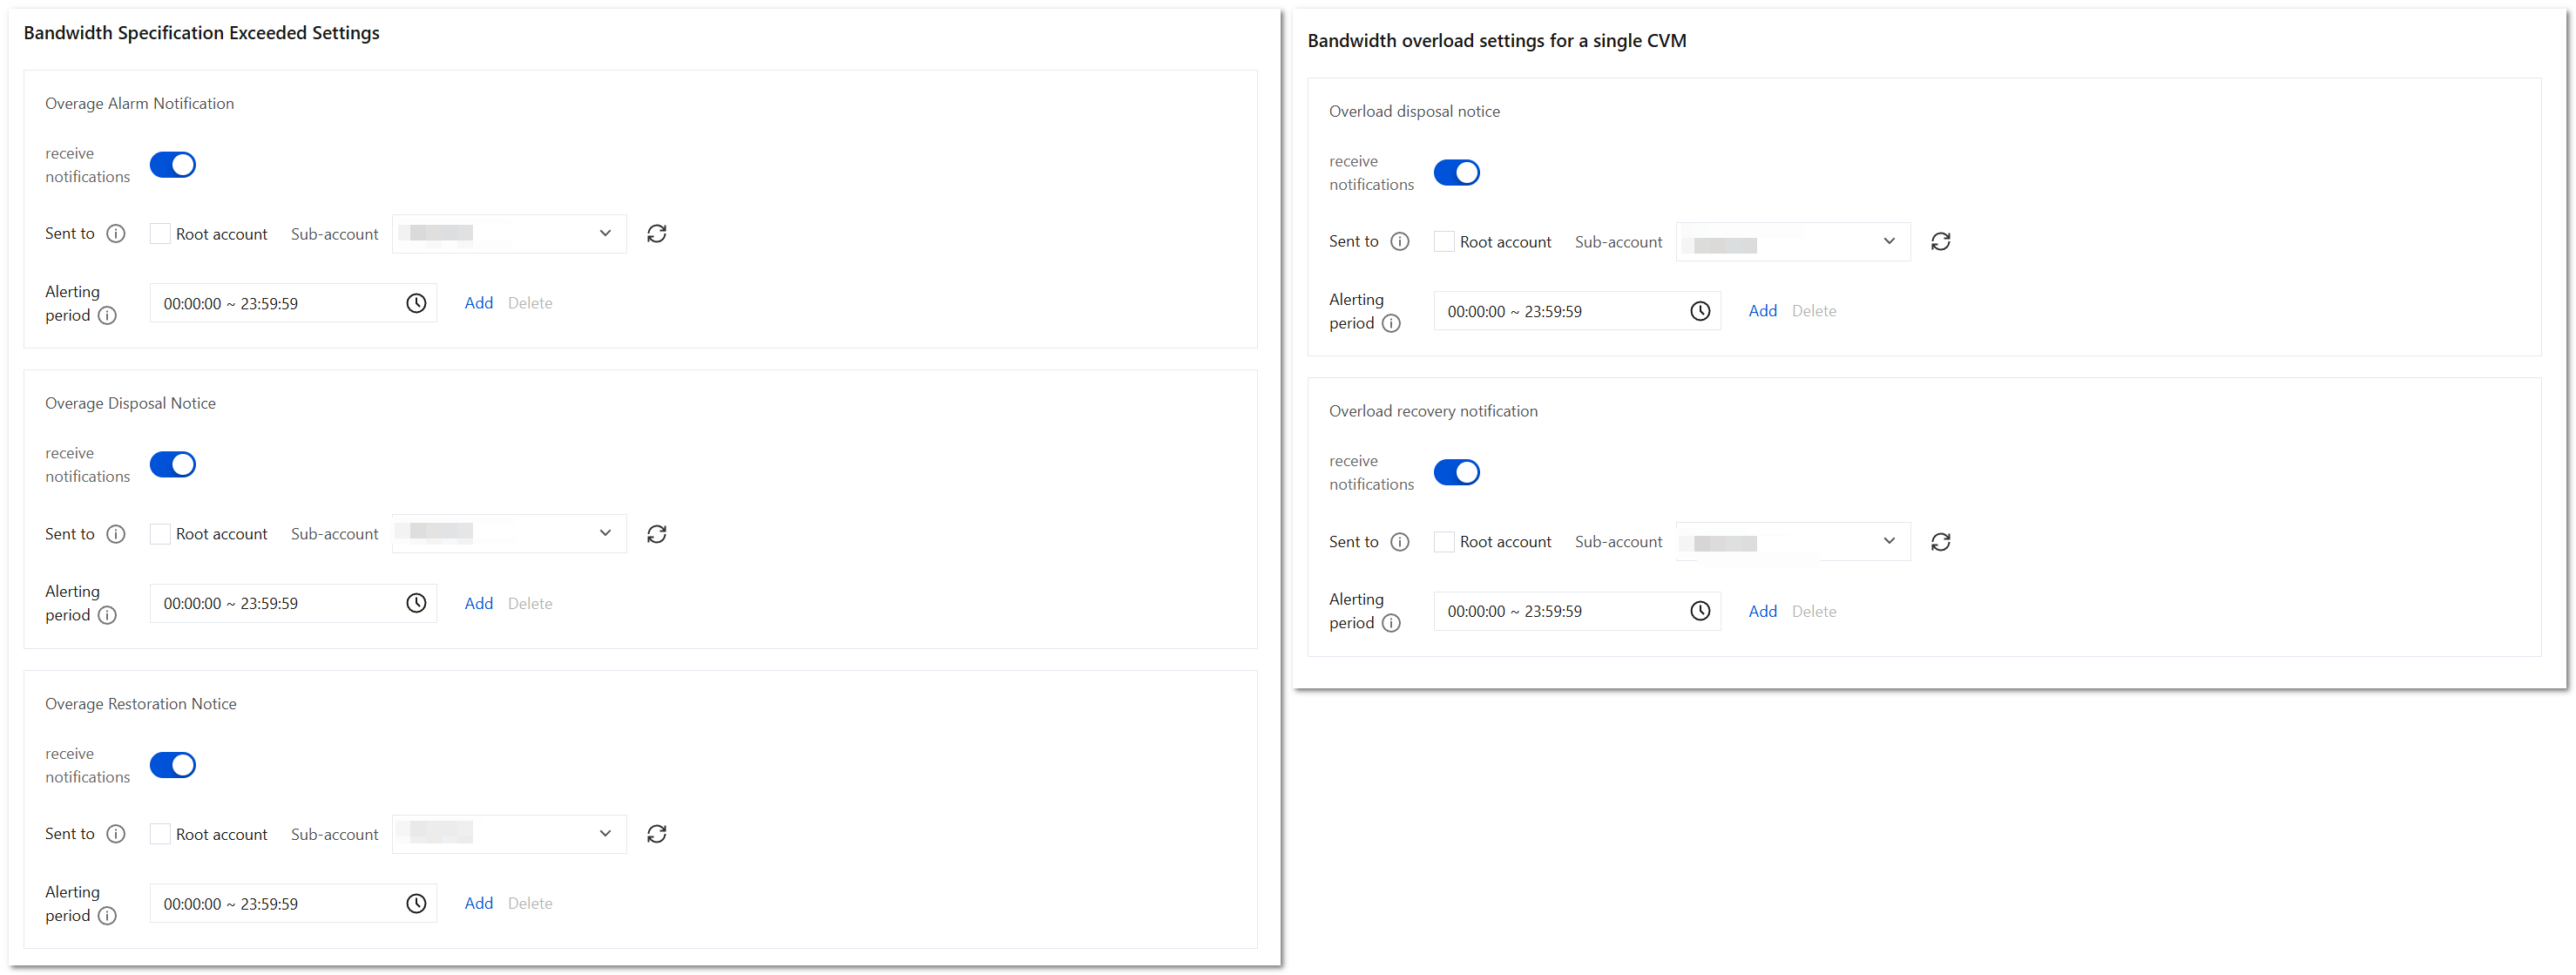
2. You can configure bandwidth specification overrun and single-machine bandwidth overload here:
receive notifications: When it is enabled, relevant alarm notifications will be received; when it is disabled, they will no longer be received.
Sent to: Select the sub-accounts to be notified from the sub-account list, and simultaneously select the master account for notification.
Alerting period: The time period to send alerts. Alerts triggered outside the time period will be ignored by default. The minimum time period is 1 hour. Up to five periods can be configured.
Log Parsing Settings
1. On the Network Detction and Response page, click Network Detction and Response Settings in the upper-right corner, go to and select Log Parsing Settings.
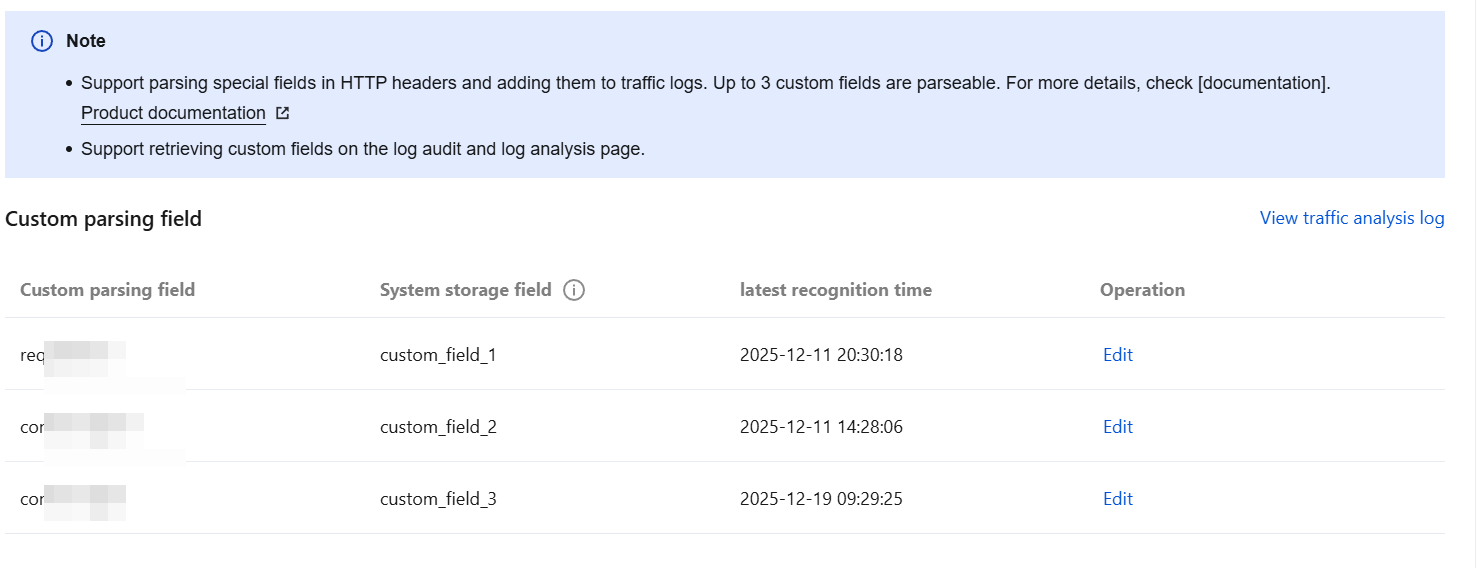
2. In the custom parsing field list, select the field to be edited and click Edit to parse special fields in HTTP Headers and add them to traffic logs. Currently, up to 3 custom fields can be parsed.
View Alarms Detected by Network Detction and Response
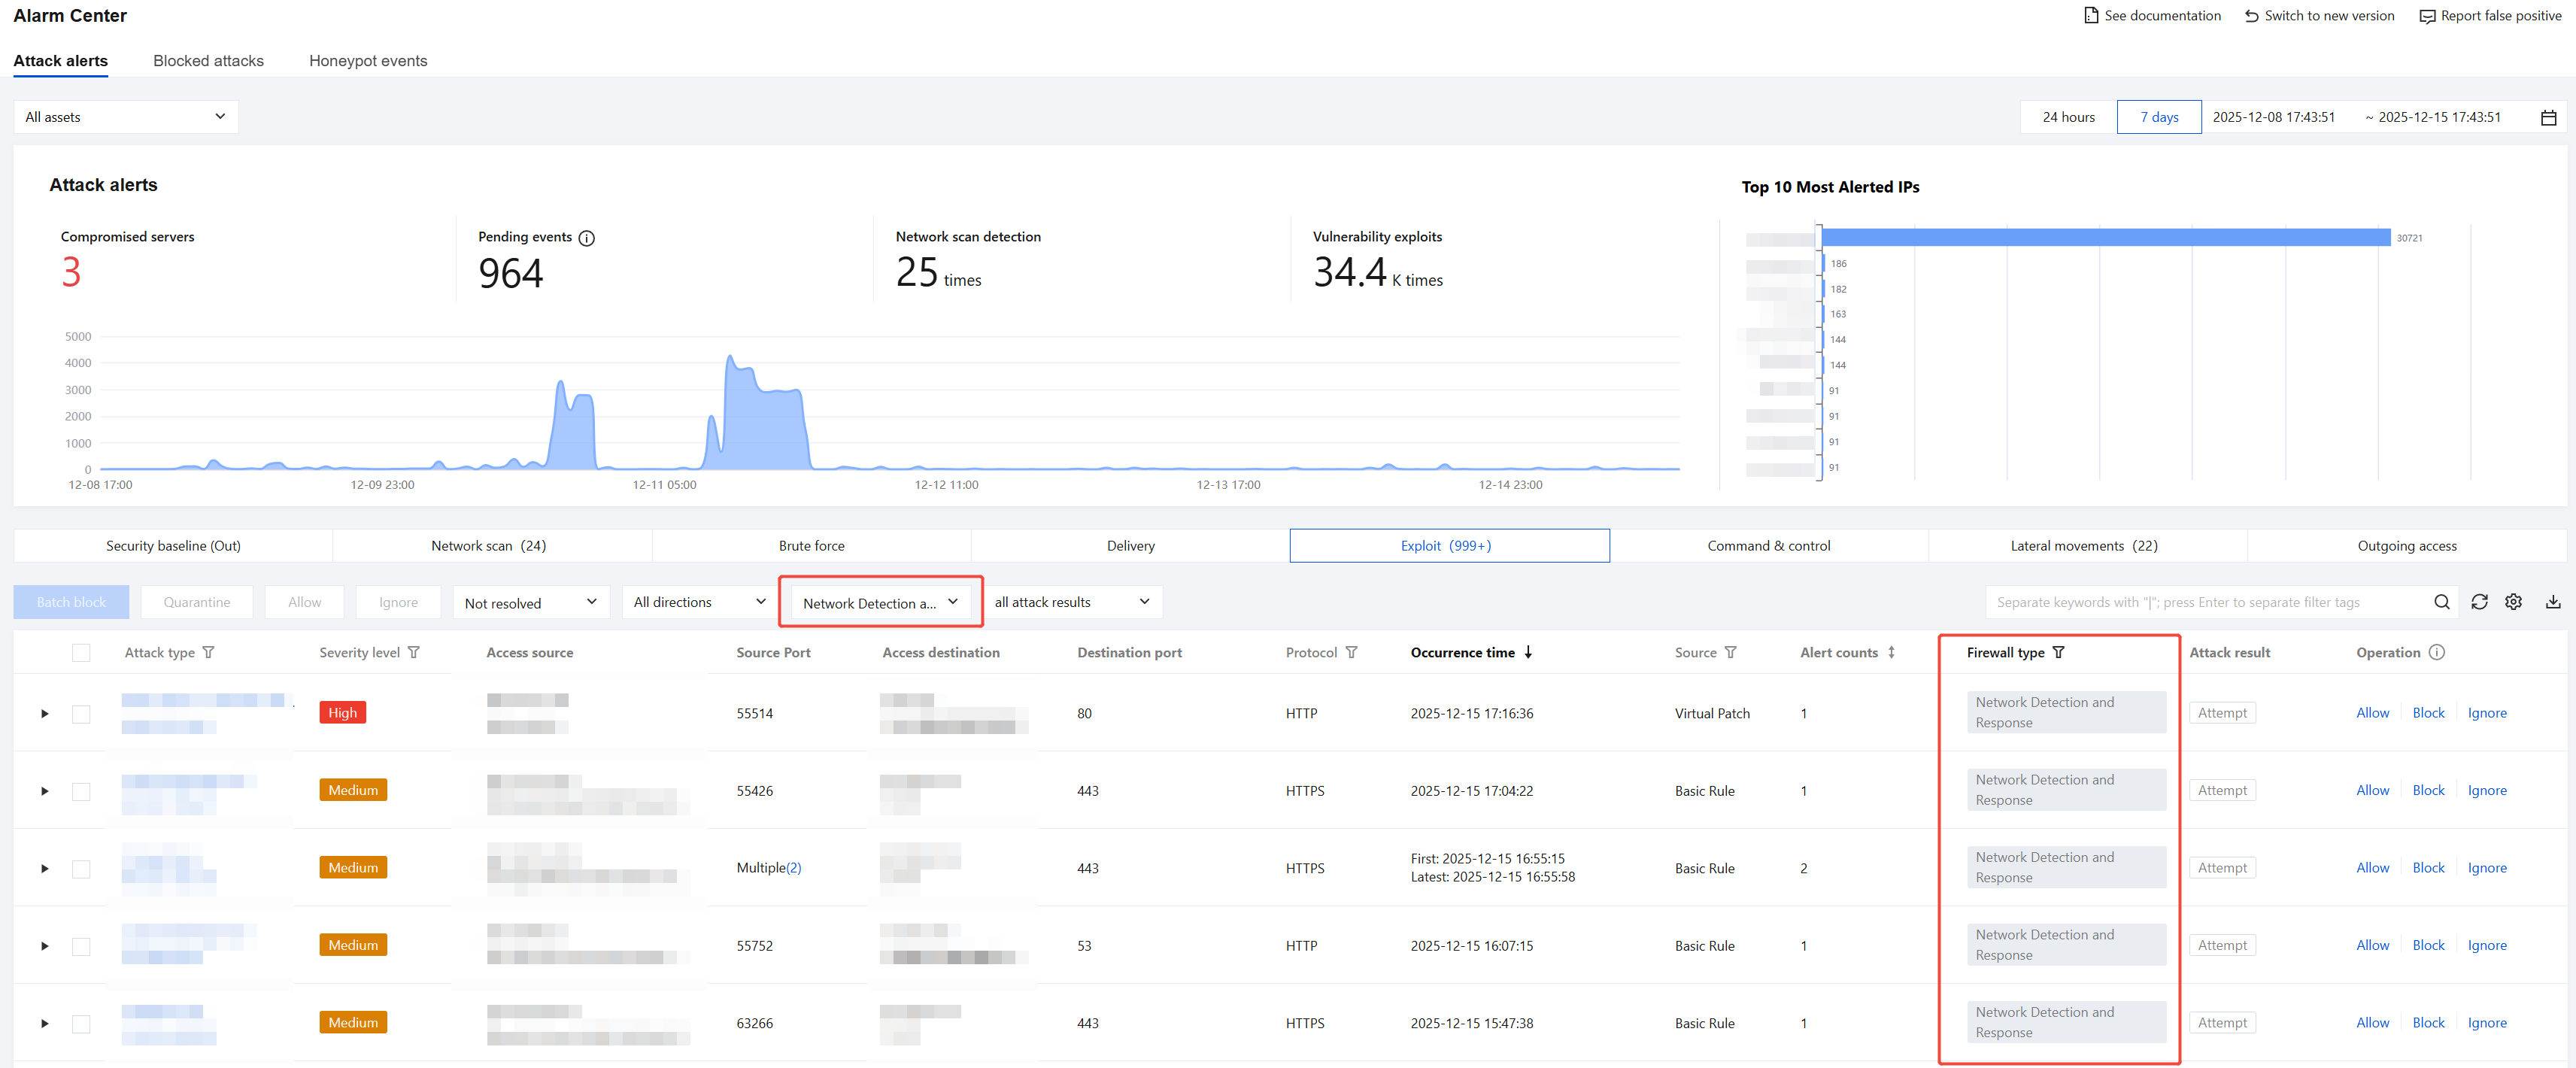
On the Alarm Center page, view threat alarms detected by Network Detction and Response. It supports analysis and detection of 8 alarm types including lateral movement and active outbound connections, and enables determination of attack results.
New Version of Alarm Center

Old Version of Alarm Center
View Logs Detected by Network Detction and Response
On the Network Detction and Response page, select the target CVM, container cluster, or public network traffic instance. Click View Alarm Logs or View Traffic Logs in the operation column to jump to the detailed alarm logs or traffic logs page for that instance. For specific operational guidance on the log page, see Viewing Network Detction and Response Logs.
On the Log Auditing > Network Detction and Response Logs page, you can view core log information related to Network Detction and Response, including: traffic analysis logs, traffic alarm logs, traffic risk logs, and detected file lists. The page provides basic log overview features. For specific operational guidance, see Viewing Network Detction and Response Logs.
On the Log Analysis page, you can obtain complete information of all Network Detction and Response logs stored in the past, quickly locate target logs based on custom search statements, and deeply mine the value of log data through reporting and statistical analysis services. The page supports advanced analysis and visualization features. For specific operational guidance, see Log Analysis.
Help and Support
Was this page helpful?
You can also Contact sales or Submit a Ticket for help.
Help us improve! Rate your documentation experience in 5 mins.
Feedback