2. On the instance list page, select the name of the instance that requires configuring data collection rules and enter its details page.
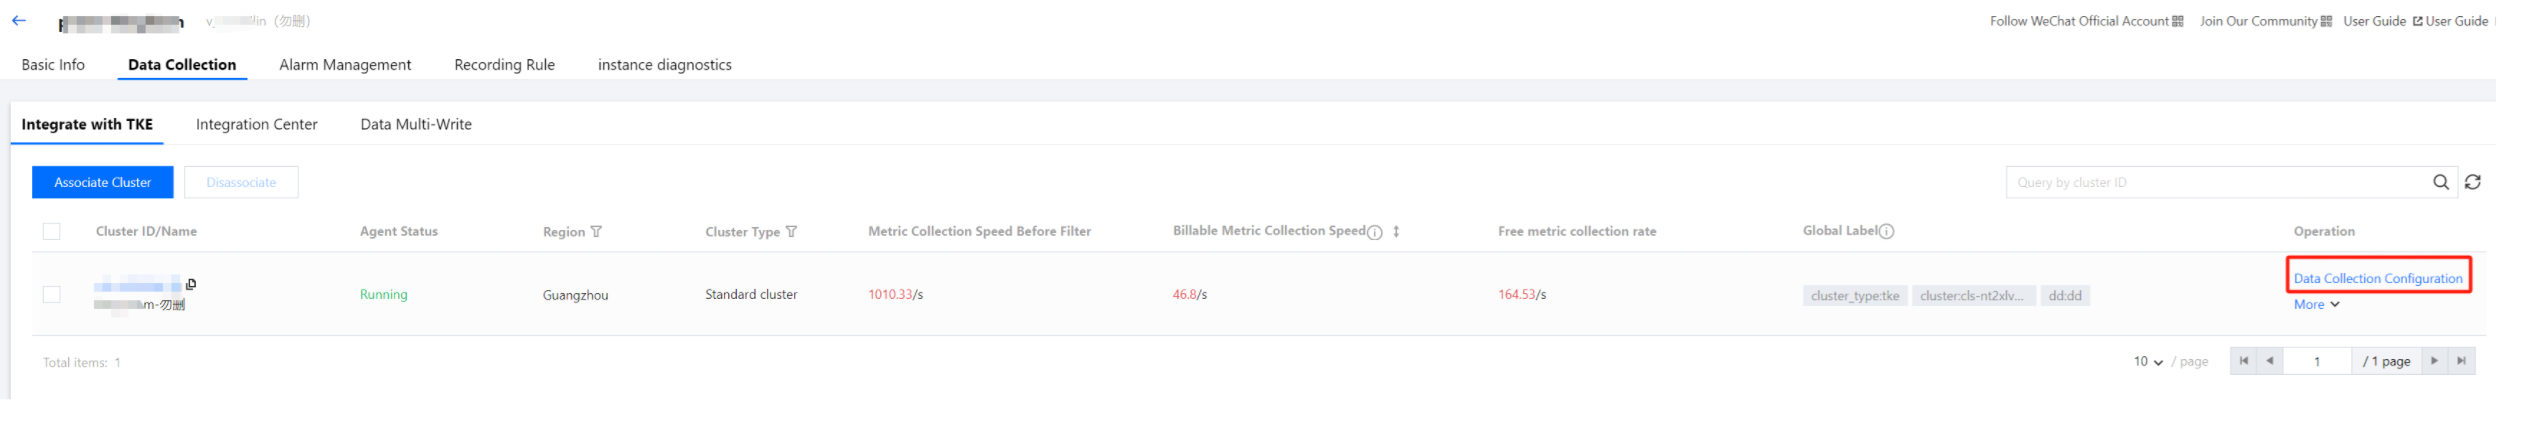
3. On the Data Collection > Integration with TKE page, click Data Collection Configuration on the right of the instance to enter the collection configuration list page.
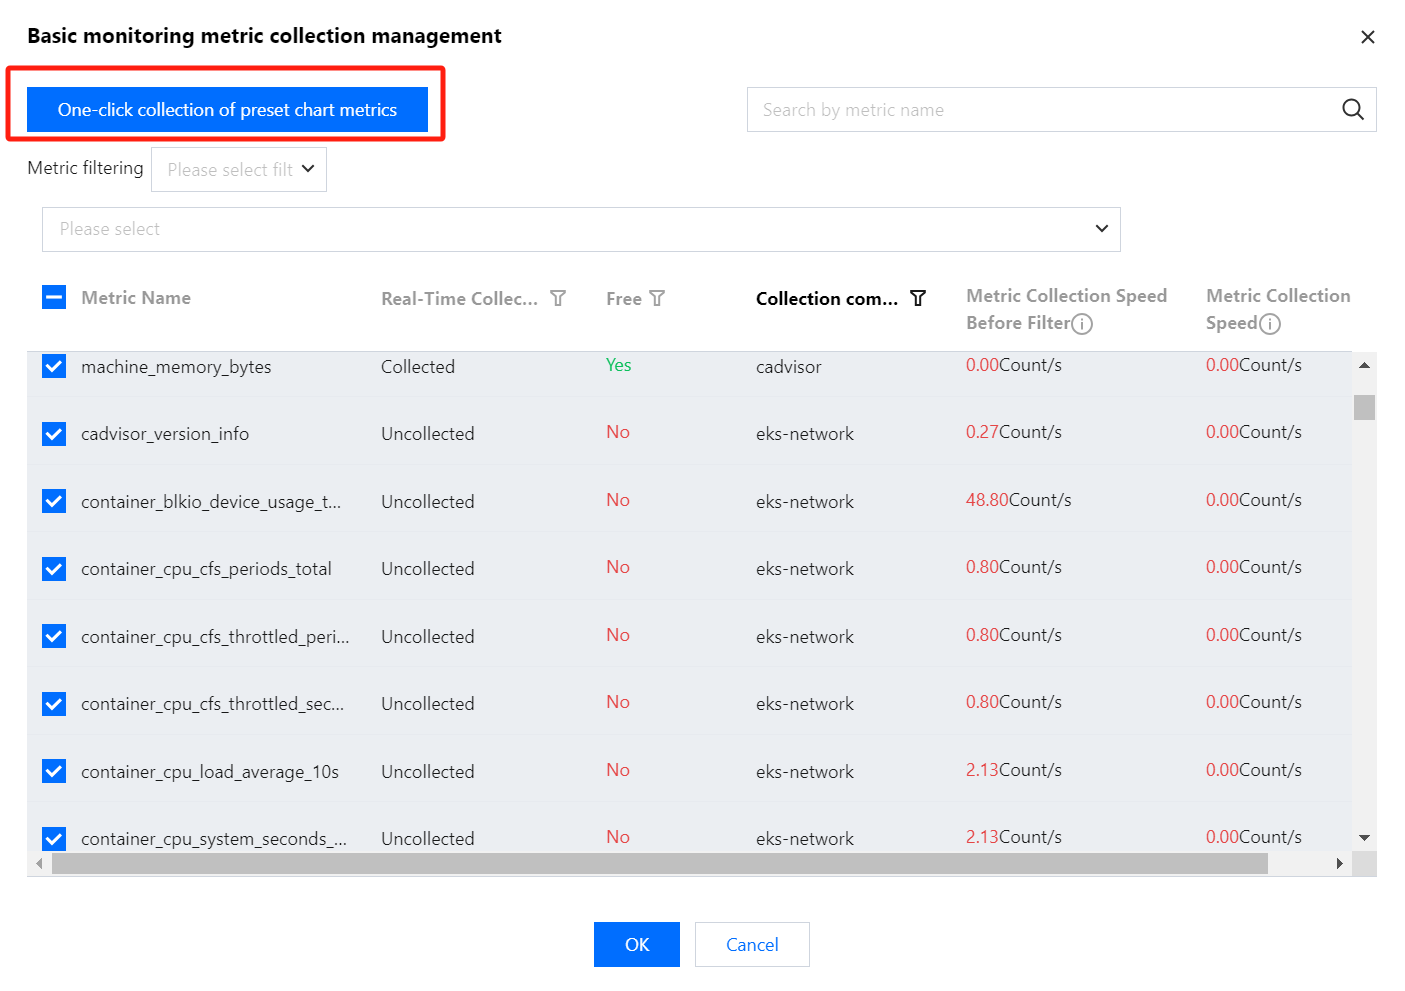
4. Click Metrics collection management at the top of the page to pop up the Basic Monitoring Metrics Collection Management page.
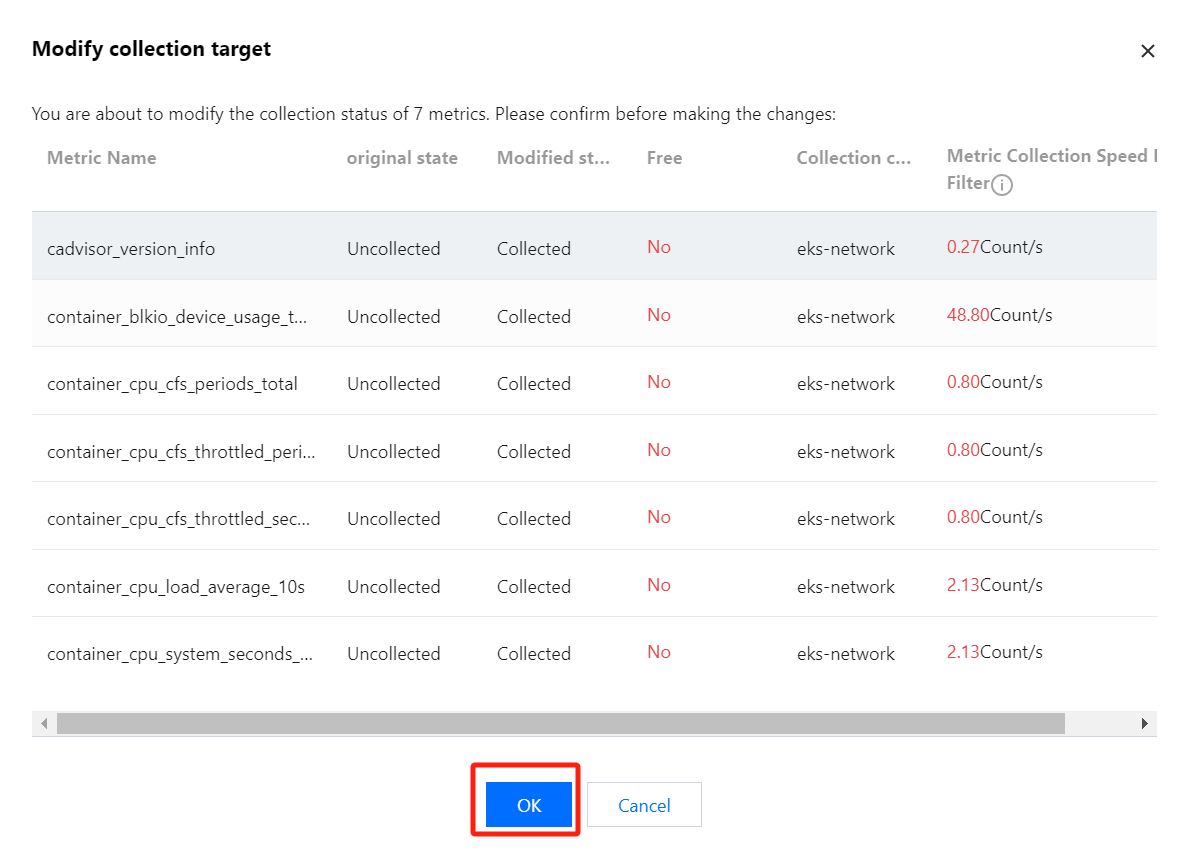
If you need to collect all container chart metrics, you can click One-click collection of preset chart metrics in the pop-up window, and then click OK in the pop-up confirmation window to collect all preset chart metrics.
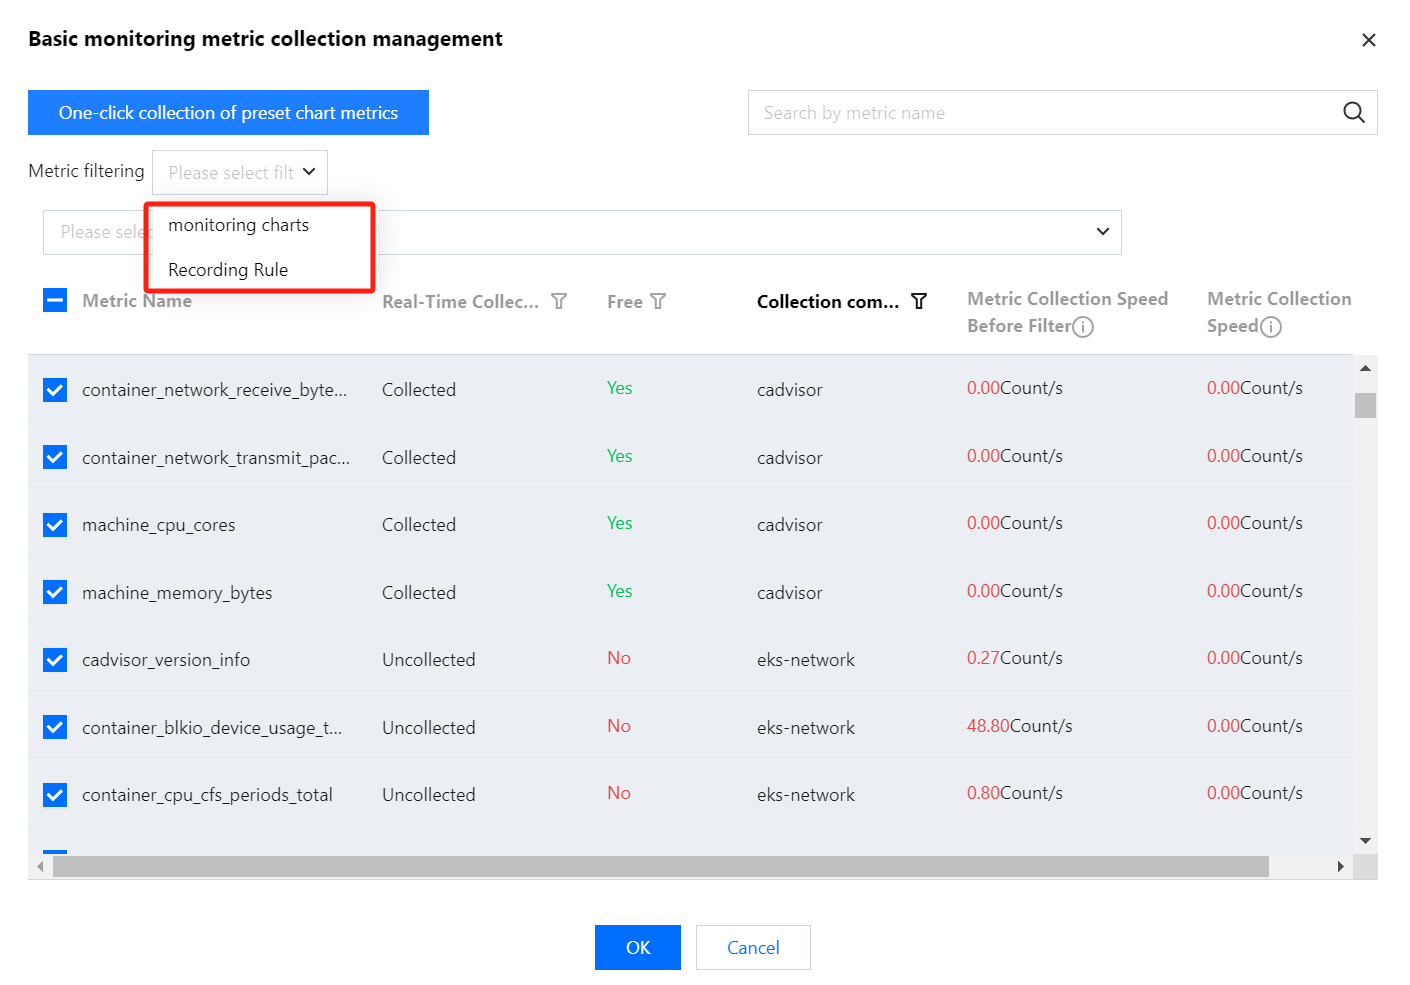
If only part of the metrics need to be collected, you can filter the metrics through, monitoring charts and RecordingRule, select the metrics you need, and then click OK. For details, see the following figure.
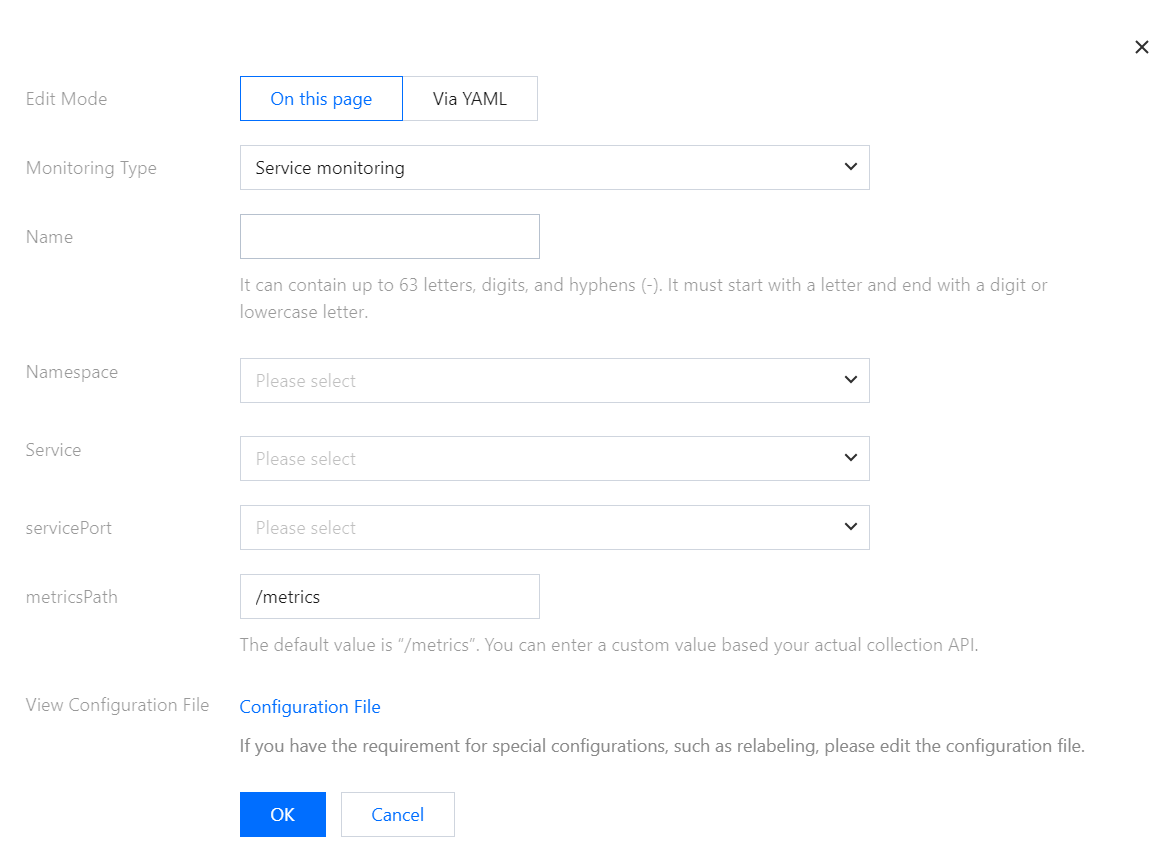
5. On the "Data Collection Configuration" page, click Customize Monitoring Configuration to add a new data collection configuration. TKE has preset some collection configuration files for collecting standard monitoring data. You can configure new data collection rules to monitor your business data in the following two ways:
Adding Configuration in the Console
Adding Configuration via YAML File
Monitoring Service
1. Click On thisPage.
2. In the "Create Collection Configuration" pop-up window, fill in the configuration information. For details, see the following figure.
1. Click ViaYAML.
2. In the pop-up window, select the monitoring type and fill in the corresponding configuration. You can complete the data collection configuration by submitting the corresponding YAML as per community usage.
Workload Monitoring: Corresponding configuration is PodMonitors.
Service Monitoring: Corresponding configuration is ServiceMonitors.
RawJobs Monitoring: Corresponding configuration is RawJobs.
6. Click OK to complete the configuration.
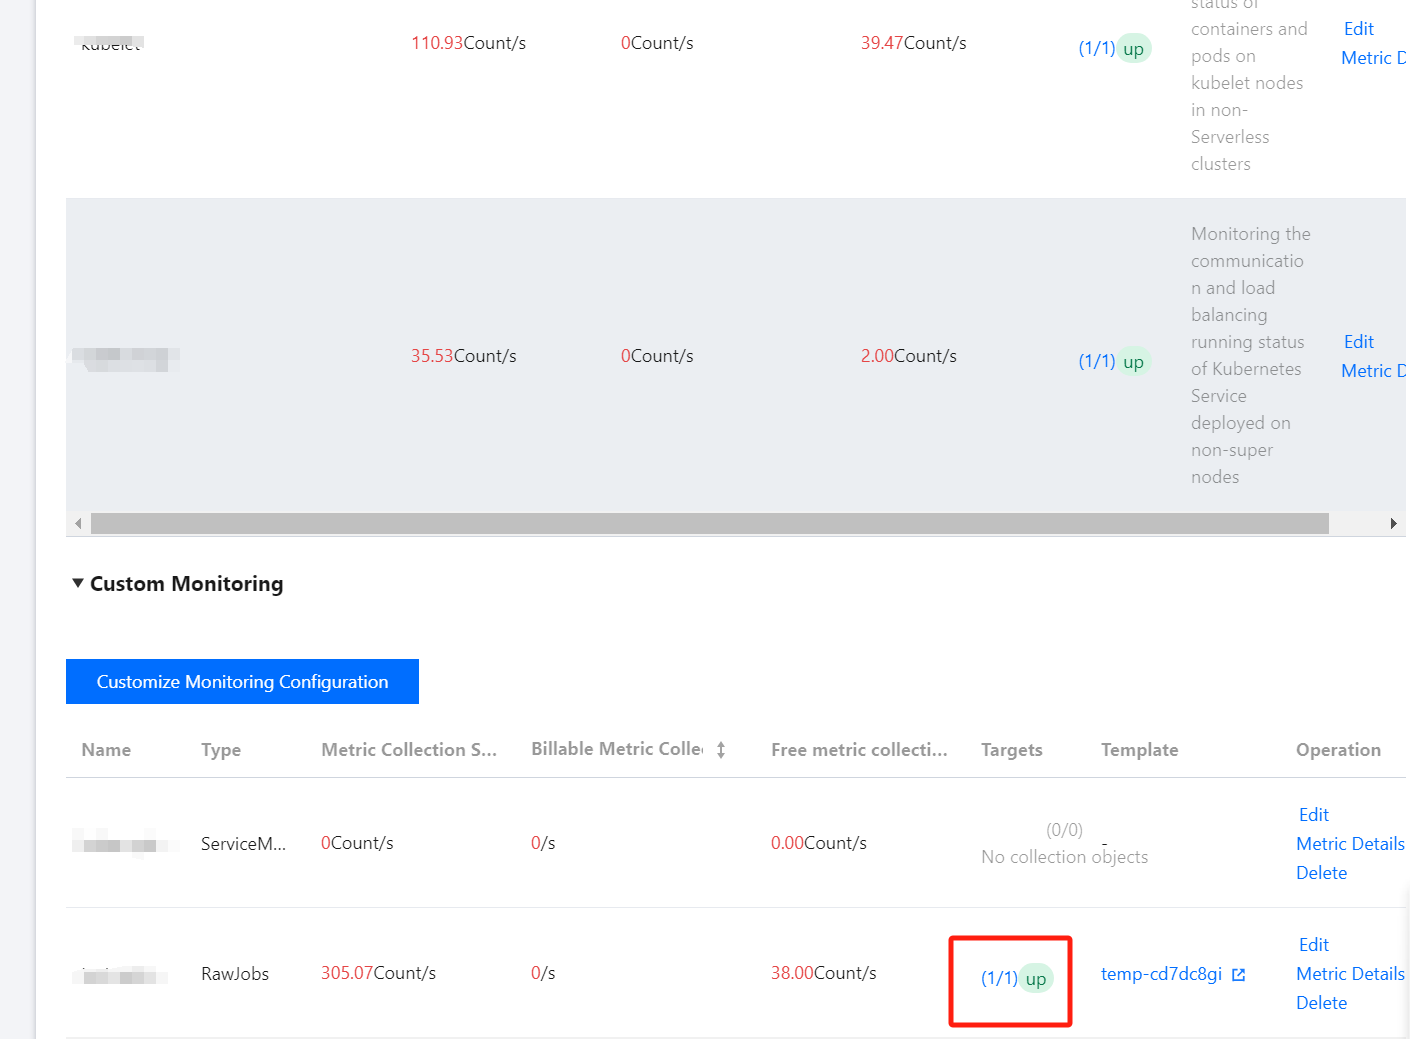
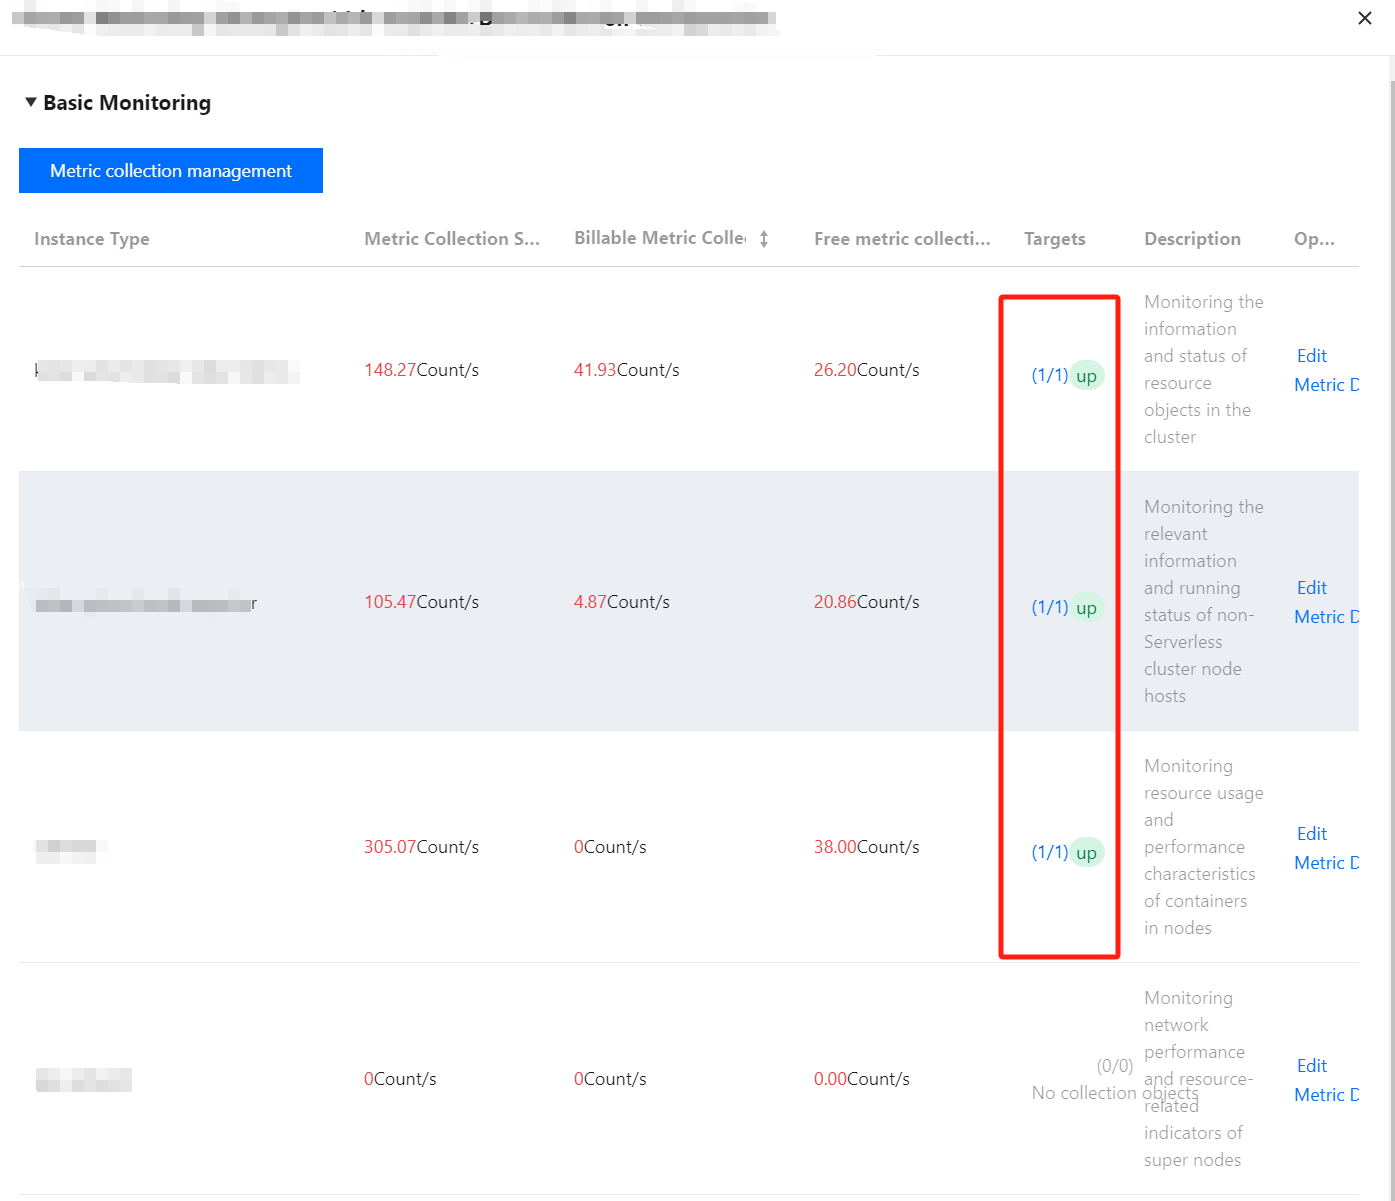
7. On the Data Collection Configuration page of the instance, view the status of the collection target. For details, see the following figure.
targets(1/1) means (the actual number of targets scraped is 1 / the number of detected collection targets is 1). When the actual number of scraped targets equals the number of detected targets, it is displayed as up, indicating that the current scrape is normal. When the actual number of scraped targets is less than the number of detected targets, it is displayed as down, indicating that some endpoints failed to scrape.
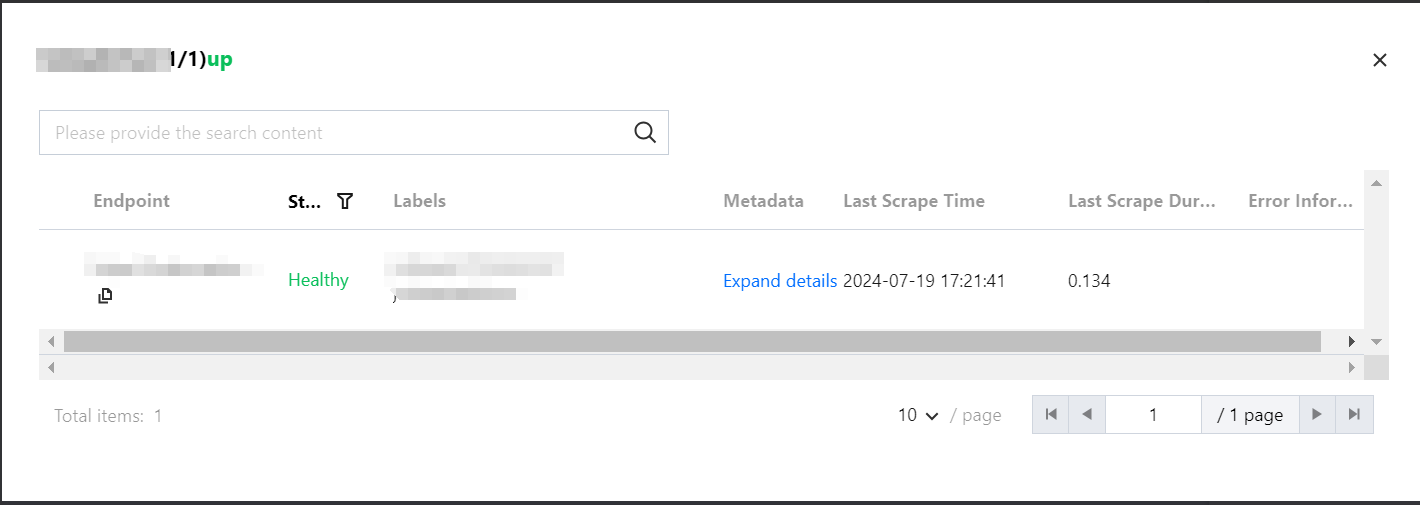
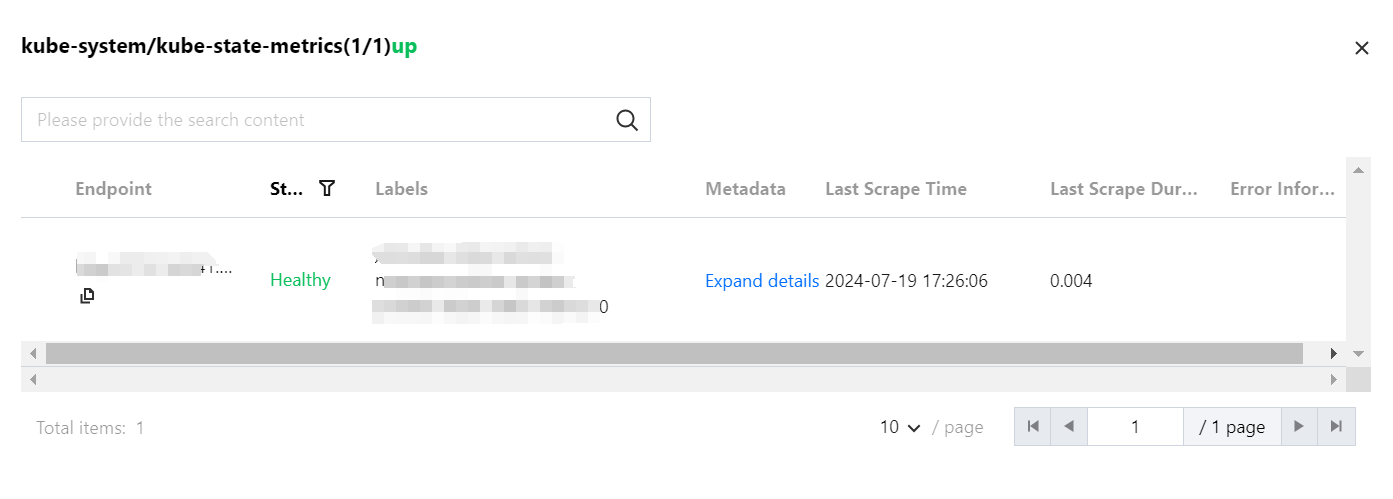
Click the field value (1/1) in the above figure to view more details about the collection target. For details, see the following figure.
2. On the instance list page, select the name of the instance that requires configuring data collection rules and enter its details page.
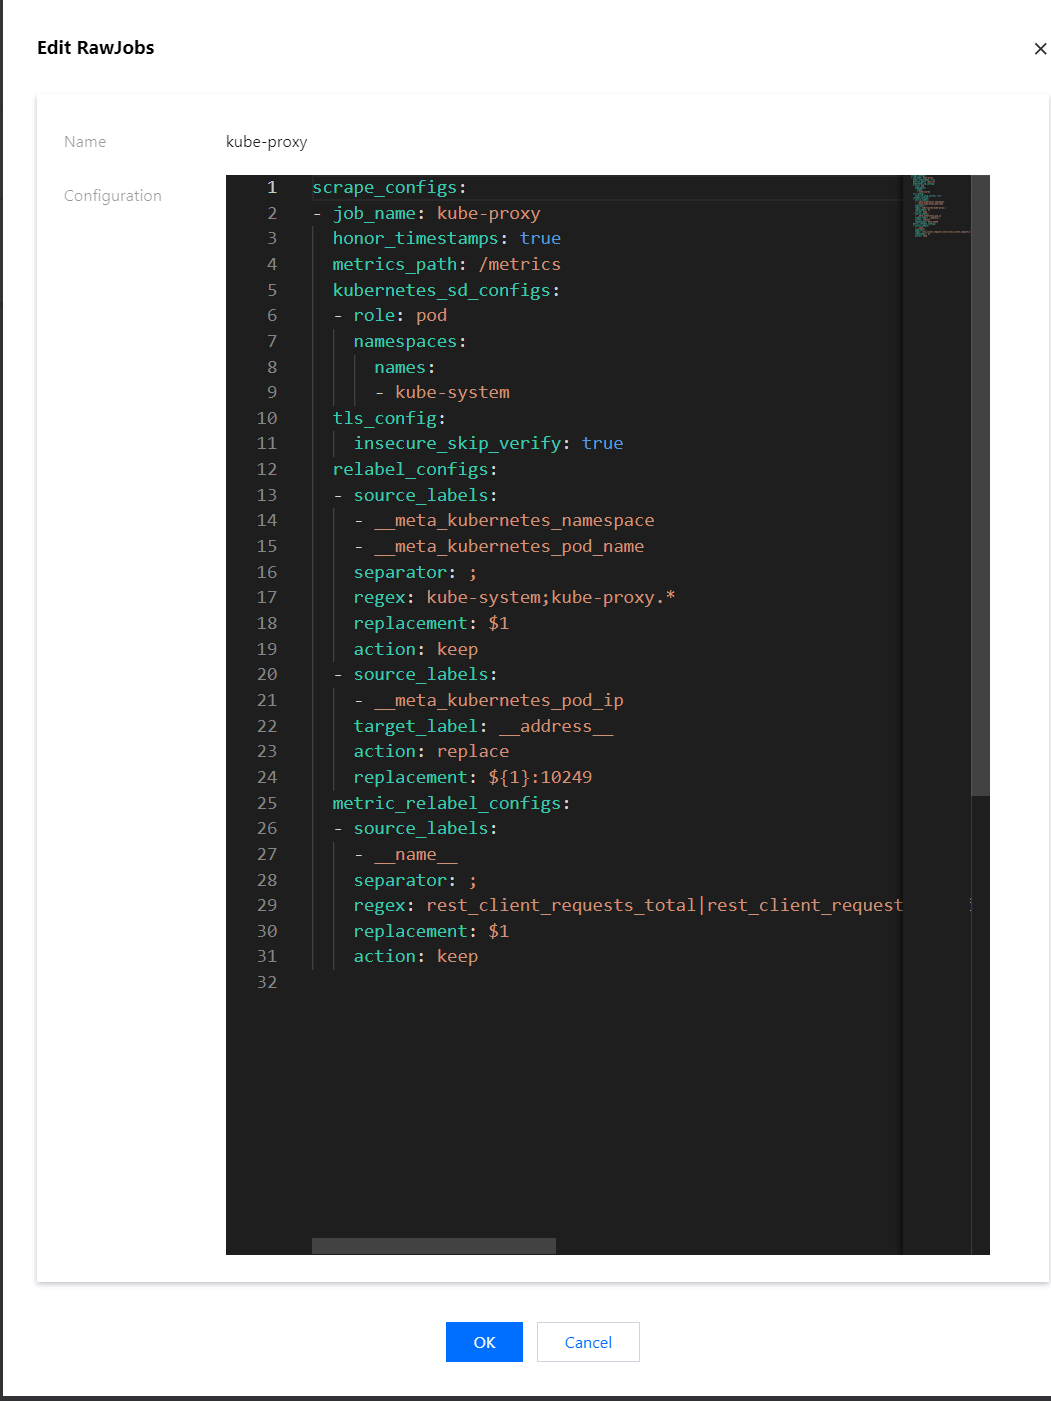
3. On the Data Collection > Integration TKE page, click Data Collection Configuration on the right side of the instance to enter the collection configuration list page. Select Basic Monitoring or Custom Monitoring, then click Edit on the right.
4. In the pop-up edit window, view all monitoring objects currently configured in the YAML file. For details, see the following figure.
2. On the monitoring instance list page, select the instance name whose targets you want to view and enter the details page of the instance.
3. On the Data Collection > Integration with TKE page, click Data Collection Configuration on the right side of the instance.
4. In the pop-up window, click the status under targets to jump to the details page of the current data.
Related Operations
Mounting Files to a Collector
When configuring the collection item, if you need to provide some files for the configuration, such as a certificate, you can mount the files to the collector in the following way. The file update will be synchronized to the collector in real time.
prometheus.tke.tencent.cloud.com/scrape-mount = "true"
Add the above label to the configmap under the prom-xxx namespace. All keys will be mounted to the collector's path /etc/prometheus/configmaps/[configmap-name]/.
prometheus.tke.tencent.cloud.com/scrape-mount = "true"
Add the above label to the secret under the prom-xxx namespace. All keys will be mounted to the collector's path /etc/prometheus/secrets/[secret-name]/.