Implementing elasticity based on traffic prediction with EHPA
Download
フォーカスモード
フォントサイズ
最終更新日: 2024-05-24 15:26:52
EHPA introduction
Effective Horizontal Pod Autoscaler (EHPA) is an auto scaling product provided by the Crane open source project. It is based on the community HPA for underlying elastic control and supports a richer set of elastic trigger policies (prediction, observation, and cycle) to enhance the efficiency of elastic control and ensure service quality.
Key features of EHPA include:
Preemptive scaling to ensure service quality: By predicting future traffic peaks, it preemptively scales up to avoid avalanches and service stability failures due to untimely scaling.
Reducing invalid scaling-down: By predicting future demand, it minimizes unnecessary scaling-down, stabilizes the resource utilization rate of workloads, and eliminates spike misjudgments.
Support to Cron configuration: It supports elastic configuration based on Cron to cope with abnormal traffic peaks during major promotion activities.
Community compatibility: It uses the community HPA as the execution layer for elastic control, fully compatible with the community.
The load of most online applications is periodic. Users can predict future loads based on daily or weekly trends. EHPA uses DSP algorithms to predict future time series data of applications.
The following code is an example of an EHPA template with predictive capabilities enabled:
apiVersion: autoscaling.crane.io/v1alpha1
kind: EffectiveHorizontalPodAutoscaler
spec:
prediction:
predictionWindowSeconds:3600
predictionAlgorithm:
algorithmType: dsp
dsp:
sampleInterval:"60s"
historyLength:"3d"
Fallback for monitoring data
When using predictive algorithms for prediction, you may be concerned about the accuracy of the predictive data. Therefore, when calculating the number of replicas, EHPA will not only calculate based on predictive data but also consider actual monitoring data for fallback to enhance the safety of elasticity. The specific implementation principle is, when you define spec.metrics in EHPA and enable elasticity prediction, the EffectiveHPAController will automatically generate multiple Metric Specs to create the underlying management's HPA.
For example, when a user defines the following Metric Spec in an EHPA YAML file:
apiVersion: autoscaling.crane.io/v1alpha1
kind: EffectiveHorizontalPodAutoscaler
spec:
metrics:
-type: Resource
resource:
name: cpu
target:
type: Utilization
averageUtilization:50
The system will be automatically converted to two HPA threshold configurations:
In the example above, the Metric threshold configurations created by the user in EHPA will automatically be converted into two Metric threshold configurations on the underlying HPA: predictive metric threshold and actual monitored metric threshold.
The predictive metric threshold is a custom metric. Its value is provided by MetricAdapter of Crane.
The actual monitored metric threshold is a resource metric, the same as defined by the user in EHPA. Therefore, HPA will calculate the number of replicas based on the metrics actually monitored by the application.
When multiple elastic metric thresholds are configured, HPA will calculate the number of replicas for each metric separately and select the highest number of replicas as the final recommended result for elasticity.
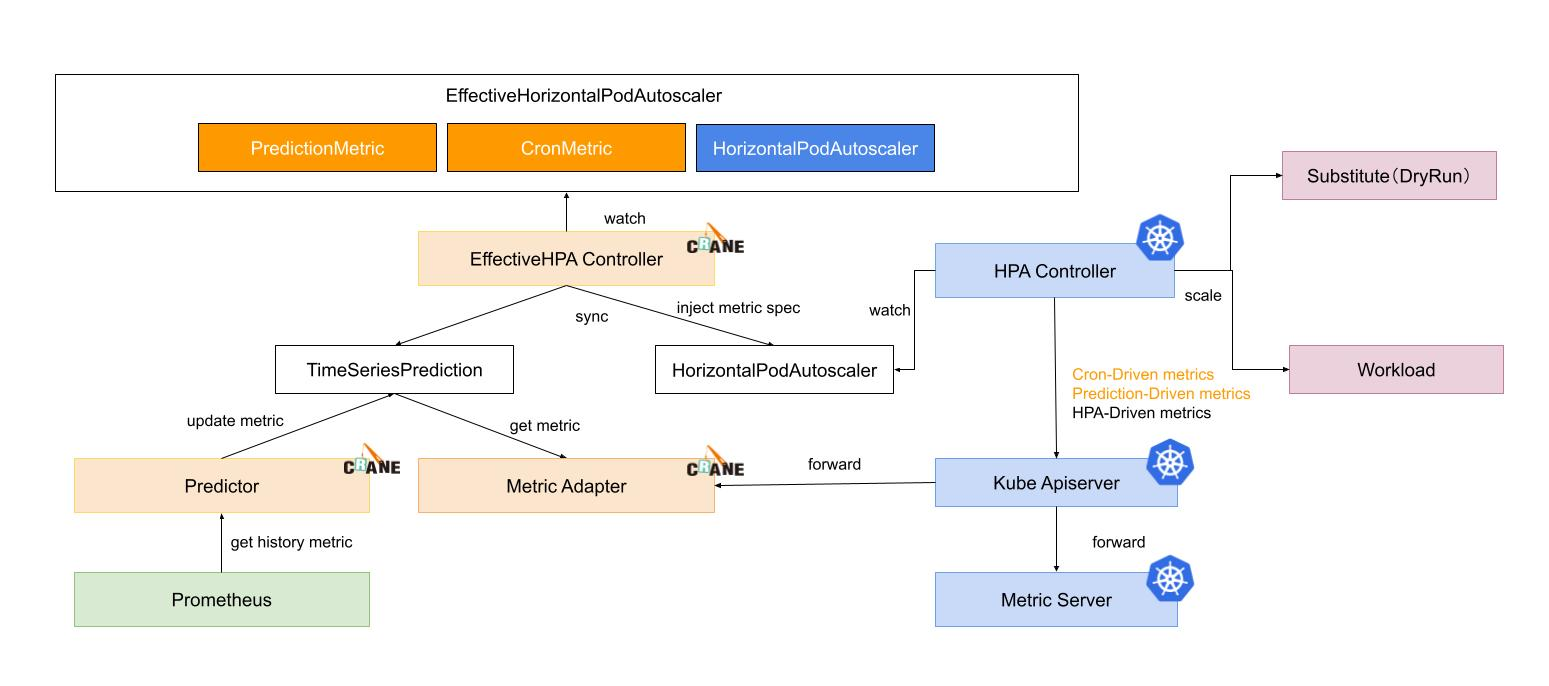
Horizontal elasticity execution process
1. EffectiveHPAController creates HorizontalPodAutoscaler and TimeSeriesPrediction objects.
2. PredictionCore retrieves historical metrics from Prometheus, calculates them using the predictive algorithm, and records the results to TimeSeriesPrediction.
3. HPAController reads metric data from KubeApiServer through the metric client.
4. KubeApiServer routes the request to MetricAdapter of Crane.
5. HPAController calculates the results returned by all metrics to determine the final elasticity replica recommendation.
6. HPAController uses the scale API to scale up/down the target application.
The overall flowchart is as shown below:
User cases
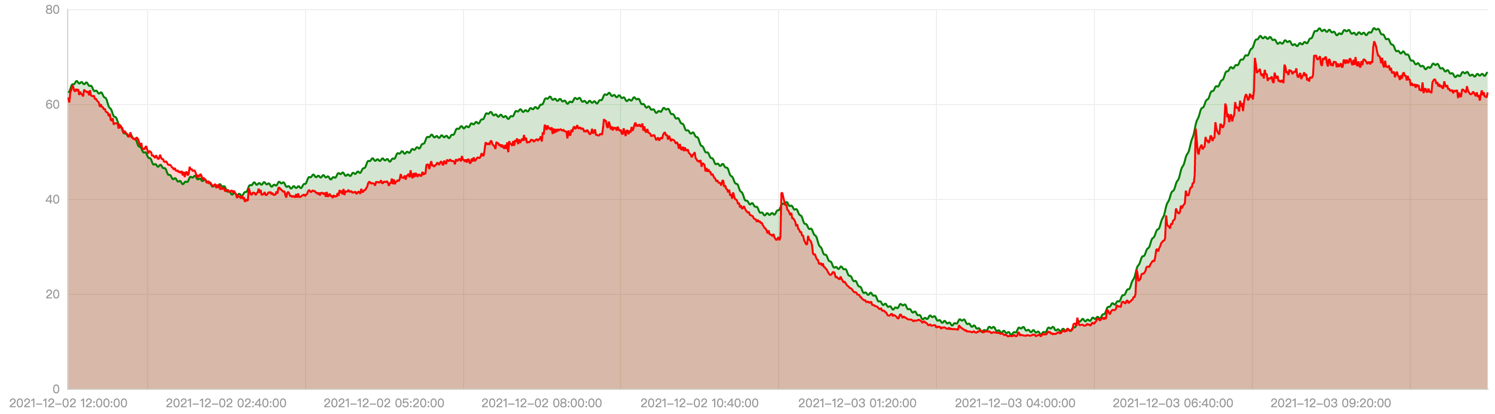
The actual effect of EHPA is demonstrated through a customer case in the production environment. In this case, the production data is replayed in the pre-release environment and the elasticity effects of using EHPA and the community HPA are compared.
The red line in the following figure represents the actual CPU utilization curve of the application within one day. You can see usage peaks at 8 am, 12 pm, and 8 pm. The green line represents the CPU utilization predicted by EHPA.
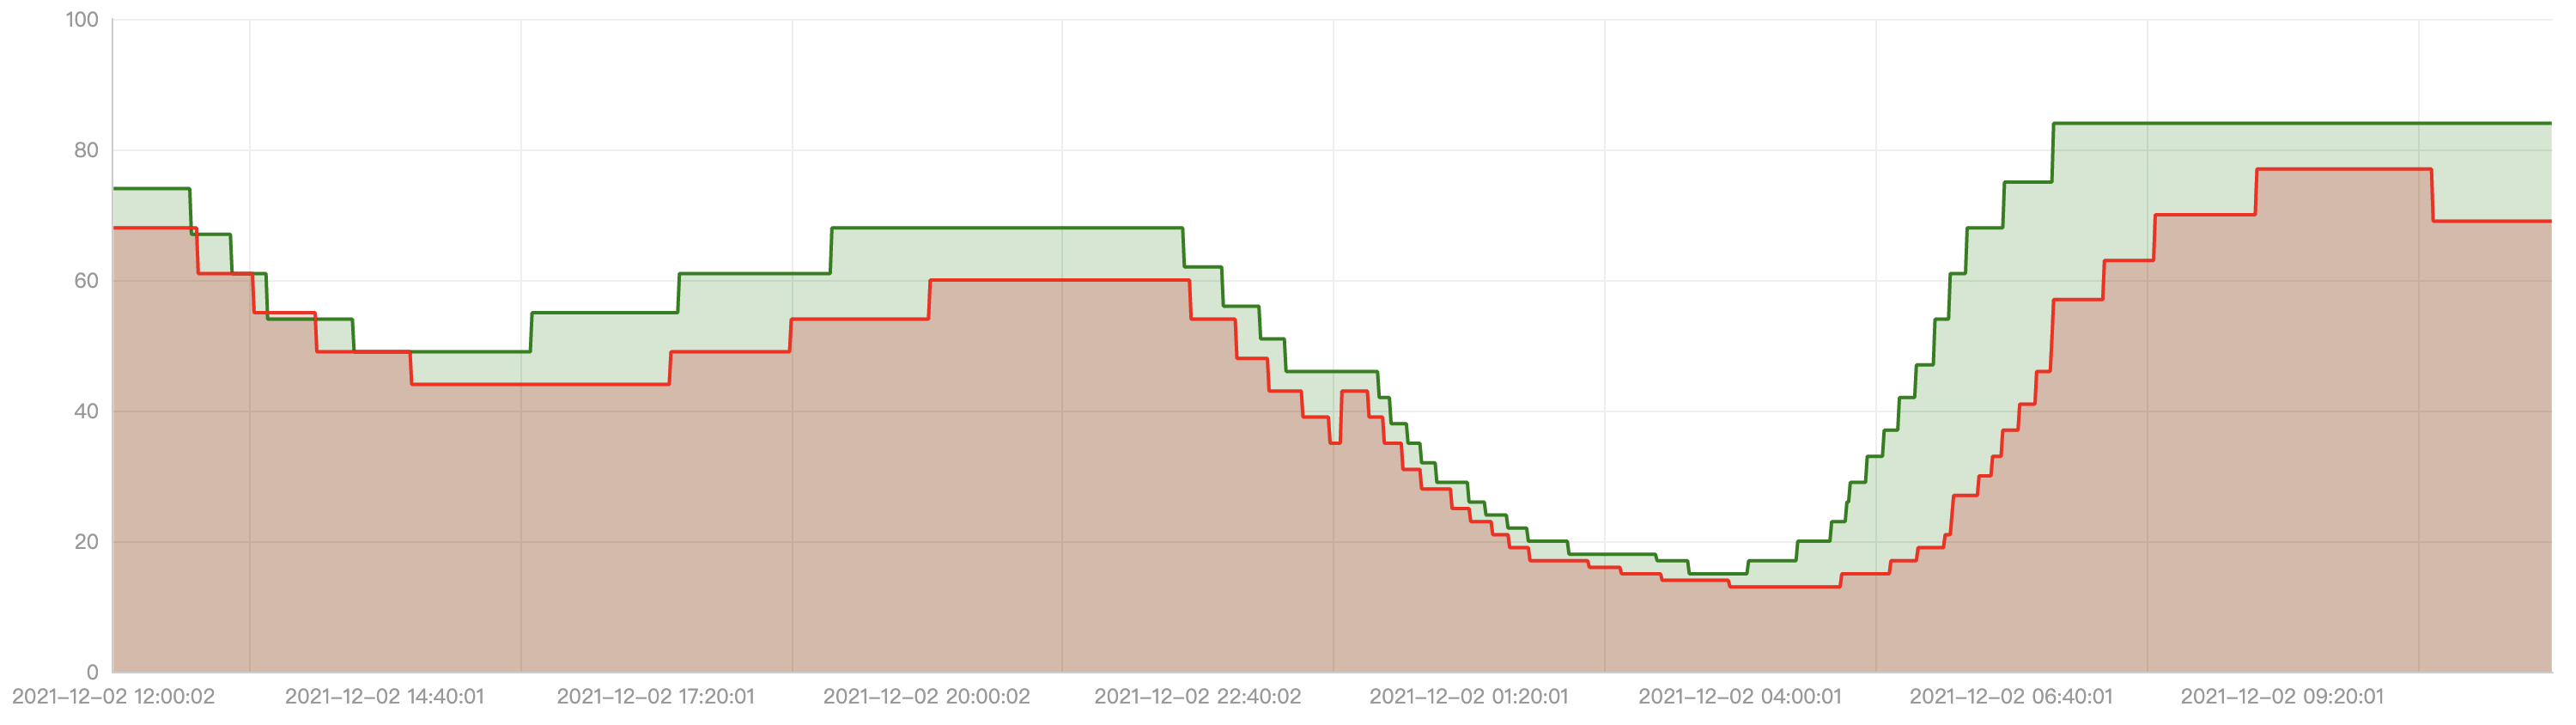
The following graph shows the curve of the number of replicas for automatic elasticity. The red line represents the number of replicas curve for the community HPA, and the green line represents the number of replicas curve for EHPA.
EHPA has the following strengths:
It scales before the arrival of traffic peaks.
It reduces ineffective scale-downs when the traffic first drops then immediately rises.
Compared to HPA, EHPA has fewer elasticity operations but is more efficient.
Scale policies
EHPA offers two types of scale policies: Auto and Preview. You can switch between them at any time and it will take effect immediately.
Auto
Under the Auto policy, EHPA automatically performs scaling. By default, EHPA's policy is set to Auto. In this mode, EHPA creates a community HPA object and automatically takes over its lifecycle. We recommend that you not modify or control this underlying HPA object, as it will be deleted when EHPA is removed.
Preview
The Preview policy provides the ability for EHPA not to automatically execute scaling. Therefore, you can observe the number of replicas calculated by EHPA through the desiredReplicas field. You can switch between the two modes at any time. When you switch to the Preview mode, you can adjust the number of application replicas through spec.specificReplicas. If spec.specificReplicas is empty, scaling is not performed for the application, but the number of replicas is still calculated.
Below is an example of an EHPA template configured in the Preview mode:
apiVersion: autoscaling.crane.io/v1alpha1
kind: EffectiveHorizontalPodAutoscaler
spec:
scaleStrategy: Preview # ScaleStrategy indicates the policy to scaling target, value can be "Auto" and "Preview".
pecificReplicas:5# SpecificReplicas specify the target replicas.
status:
expectReplicas:4# expectReplicas is the calculated replicas that based on prediction metrics or spec.specificReplicas.
currentReplicas:4# currentReplicas is actual replicas from target