When you need to view the instance information that has been accessed to DBbrain, you can check the basic information, status, health score, exception alarm, and configuration on the Instance Management page.
The Instance Management page also supports managing instance groups, customizing whether to enable Inspection, Overview, or Large Key Analysis capabilities, creating kill session tasks, and creating regular health report tasks.
Features Supported by Different Databases
Feature Items
TencentDB for MySQL
Cloud Native Database TDSQL-C for MySQL
TencentDB for MariaDB
TDSQL for MySQL
Tencent Cloud Distributed Cache
TencentDB for MongoDB
TencentDB for PostgreSQL
Self-Built Database MySQL
View instance list
✓
✓
✓
✓
✓
✓
✓
✓
Managing Instance Groups
✓
✓
✓
✓
✓
✓
✓
x
Instance Configuration
✓
✓
✓
✓
✓
✓
✓
✓
Creates kill session tasks.
✓
✓
x
x
x
x
x
x
Creates regular health report tasks.
✓
✓
✓
✓
✓
✓
x
✓
Accesses instances.
x
x
x
x
x
x
x
✓
Cancels instance access.
x
x
x
x
x
x
x
✓
Agent management
x
x
x
x
x
x
x
✓
Updates database accounts.
x
x
x
x
x
x
x
✓
Reconnects instances.
x
x
x
x
x
x
x
✓
Parameter Items Displayed in Instance Lists of Different Database Types
2. In the left sidebar, select Instance Management.
3. Select the database type at the top of the page.
4. (Optional) In the search box at the top of the page, select resource attributes (including instance ID, instance name, and status), enter keywords, and click
.
Note:
The available resource attributes depend on the selected database type; refer to the actual page display for specifics.
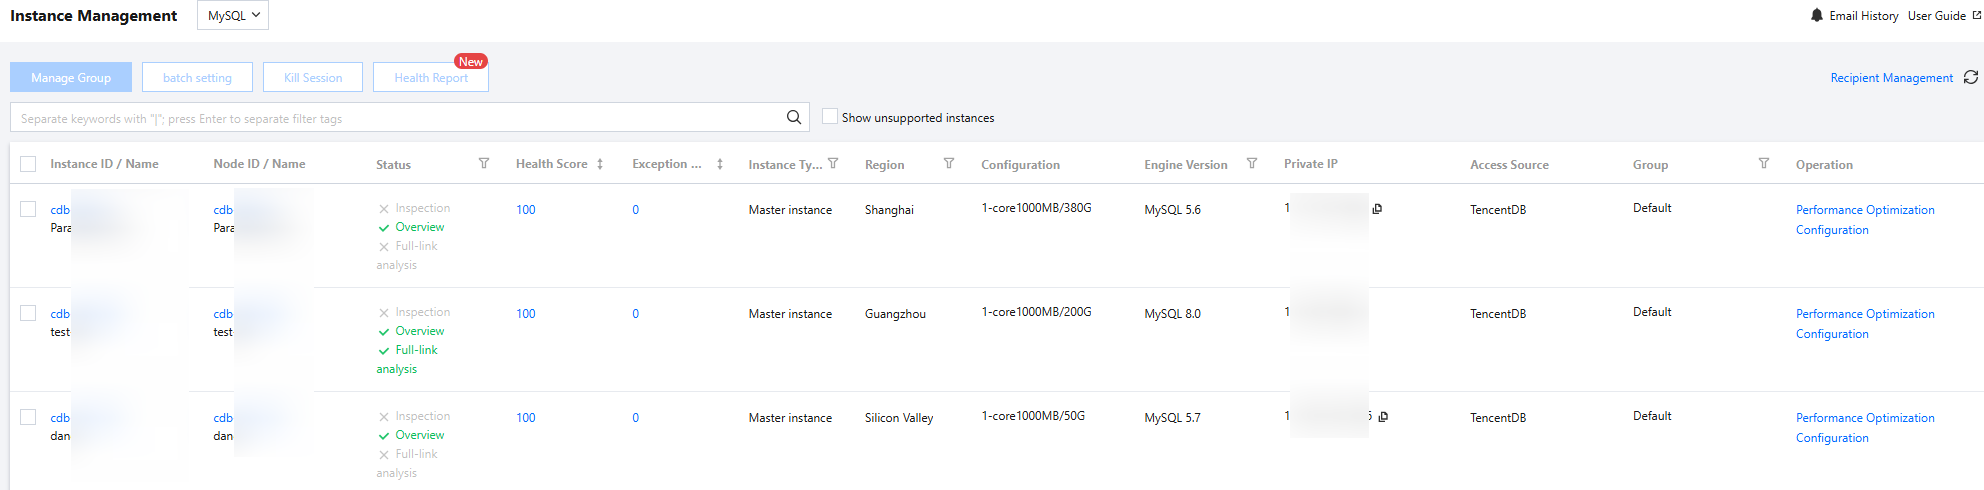
5. View the instance information in the list. The specific parameter descriptions are shown in the following table.
Tencent Cloud Database
Parameter
Descriptions and Operations
Shard ID / Set ID
Set ID and name.
Click Set ID to enter the Performance Optimization > Exception Diagnosis page.
Instance ID/Name
Instance ID and name.
Click instance ID to enter the Performance Optimization > Exception Diagnosis page.
Instance ID/Name
The node ID and name of TencentDB for MySQL Cluster Edition.
Click node ID to enter the Performance Optimization > Exception Diagnosis page.
Cluster ID/Name
Cluster ID and name to which the instance belongs.
Click Cluster ID to enter the Performance Optimization > Exception Diagnosis page.
Status
Whether the instance has enabled Inspection, Overview, Full-link Analysis, or Big Key Analysis.
Hover the mouse over the Status column, click
on the right side of Inspection, and enable Inspection, Overview, and Large Key Analysis in the pop-up dialog box. Once it is enabled, the fonts of Inspection, Overview, and Large Key Analysis will be displayed in green.
Inspection: Once it is enabled, the Database Inspection page will display the inspection results of the instance.
Overview: Enabled by default. The health data and performance data information of this instance will be included in the statistical scope of the Instance Overview page.
Full-link Analysis: You need to enable the database audit service first and then enable the Full-link Analysis. The relevant pages of Full-link Analysis will display the SQL details and analysis information of this instance. Currently, only database types such as MySQL, TDSQL-C for MySQL, MariaDB, TDSQL for MySQL, Tencent Cloud Distributed Cache, and PostgreSQL involve this configuration.
Big Key Analysis: Once it is enabled, the Top 100 large key analysis data of this instance will be displayed on the Performance Optimization > Memory Analysis page. Only the Tencent Cloud Distributed Cache involves this configuration.
Health Score
DBbrain performs real-time health checks on instances, evaluating overall from dimensions of availability, maintainability, performance, and reliability, and provides a health score.
Click the health score to enter the Performance Optimization > Health Report page. View the health score trend chart and score details. For generating or viewing health reports, see Creating Health Report and Viewing Health Report respectively.
Exception Alarm
Displays the number of exceptions of this instance found by the 7 * 24-hour Exception Diagnosis.
Click the number of alarms to enter the Performance Optimization > Exception Diagnosis page to view the diagnostic prompts (including the distribution of alarm risks and diagnostic details).
Instance Type
The type to which the instance belongs, including primary instance, read-only instance, and disaster recovery instance.
Region
The region to which the instance belongs
Log Retention Period
The retention period of audit logs.
Configuration
Instance specifications, including CPU size, memory, and disk capacity.
Engine Version
The engine version of the instance.
Architecture Version
The cluster architecture version of the Distributed Cache instance.
Private IP
The direct connection address of the database instance.
Total Memory
The memory usage and total memory of the instance.
Access Point Address
The network address required to connect to the TDSQL-C for MySQL instance, that is, the network entry of the TDSQL-C for MySQL instance.
Only applicable to TDSQL-C for MySQL database type.
Access Source
The access source of the instance is Tencent Cloud Database.
Group
The group to which the instance belongs is displayed after the instance is bound to a group. Hover over the group name and click
on the right side of the group name to edit the group to which the instance belongs.
Full-link Analysis: To view the PostgreSQL full-link analysis information, click Full-link Analysis.
Instance Configuration: You can configure whether to enable Inspection, Overview, and Large Key Analysis features for the instance. For related operations of instance configuration, see Instance Configuration.
Self-built MySQL database
Parameter
Descriptions and Operations
Instance ID/Name
Instance ID and name. Click the instance ID to enter the Performance Optimization > Exception Diagnosis page.
Status
Whether to enable Inspection and Overview for the instance.
Hover over the status column, click
on the right side of Inspection, and enable Inspection and Overview in the popped-up dialog box. Once it is enabled, the Inspection and Overview text will appear in green.
Inspection: Once it is enabled, the Database Inspection page will display the inspection results of the instance.
Overview: Enabled by default. The health data and performance data information of this instance will be included in the statistical scope of the Instance Overview page.
Health Score
DBbrain performs real-time health checks on instances, evaluating overall from dimensions of availability, maintainability, performance, and reliability, and provides a health score.
Click the health score to enter the Performance Optimization > Health Report page. View the health score trend chart and score details. For generating or viewing health reports, see Creating Health Report and Viewing Health Report respectively.
Exception Alarm
Displays the number of exceptions of this instance found by the 7 * 24-hour Exception Diagnosis.
Click the number of alarms to enter the Performance Optimization > Exception Diagnosis page to view the diagnostic prompts (including the distribution of alarm risks and diagnostic details).
Region
The region to which the instance belongs
Configuration
Instance specifications, including CPU size, memory, and disk capacity.
Engine Version
The engine version of the instance.
IP Address
The direct connection address of the database instance.
Access Source
The access source of the instance is self-built.
Monitoring and Collection
Displays the status of DBbrain monitoring data collection for the performance status of users' databases. The switch is enabled by default and cannot be disabled.
Slow Log Collection
Displays the status of slow log collection. When the switch is enabled, DBbrain will monitor the database's slow log status. Before enabling it, check if the slow log collection permission is enabled. For details, see How to Configure Slow SQL Analysis.
Network Type
Displays the network type of the self-built database instance access, including private network and public network.
Access Method
Displays the access method for the self-built database instance, including direct access and agent access.
Agent Status
For self-built database instances accessed via the agent, it displays the real-time status of the agent, helping users promptly identify agent exceptions.
Instance Status
Displays the real-time status of the database instance, helping users promptly identify database instance exceptions.
Account
Database account authorized when accessing DBbrain.
Operation
Performance Optimization: When the instance health score is low, you can click Performance Optimization to enter the Exception Diagnosis page to view specific diagnosis details, helping you quickly locate and resolve issues. For related operations, see Exception Diagnosis.
Instance access cancellation: Select More > Cancel Access to remove the self-built database instance that has accessed the DBbrain's autonomous service.
Agent management: Select More > Manage Agent to view the basic information of the agent, including the host IP address where the agents are deployed, the agent port number, the agent version, the agent status, and the agent allowlist.
Database account update: Select More > Change Database Account to change the database account authorized to access DBbrain.
Instance reconnection: When the agent encounters an exception, select More > Reconnect Instance to restart the agent, or select More > Manage Agent and click Manual Restart Guide in the upper right corner of the page to see how to manually restart the agent on the host.
Instance Configuration: You can configure whether to enable Inspection, Overview features for the instance. For related operations of instance configuration, see Instance Configuration.
Related Operations
Instance group management: When you need to manage instances by group, you can select existing groups or create new groups and bind them to one or more instances. For specific operations, see Managing Instance Groups.
Instance configuration: Set whether DBbrain enables Inspection, Overview, and Large Key Analysis features for the instance. For related operations, see Instance Configuration.
Health report configuration: When it is necessary to generate health reports regularly for one or more instances, you can configure the report generation time through the health report. For specific operations, see Creating Regular Health Reports.
Accessing self-built MySQL instances: If intelligent management of self-built MySQL databases by DBbrain is required, the self-built databases can be accessed to DBbrain. For access operations, see Self-Built Database Access.
Kill session: When you need to forcibly close one or more instance sessions, you can click Kill Session at the top of the instance list. For specific operations, see Kill Session.
Displaying unsupported instances: Check the Display unsupported instances at the top of the instance list, and the instance list will display the instances that are already in the recycle bin.