This document describes how to view monitoring data for your TDSQL Boundless instance in the console, as well as how to use monitoring auxiliary features such as time comparison, scheduled refresh, copying to Dashboard, and downloading data.
Viewing Metric Monitoring
1. Log in to the TDSQL Boundless console. In the Instance List, click Instance ID to go to the Instance Details page.
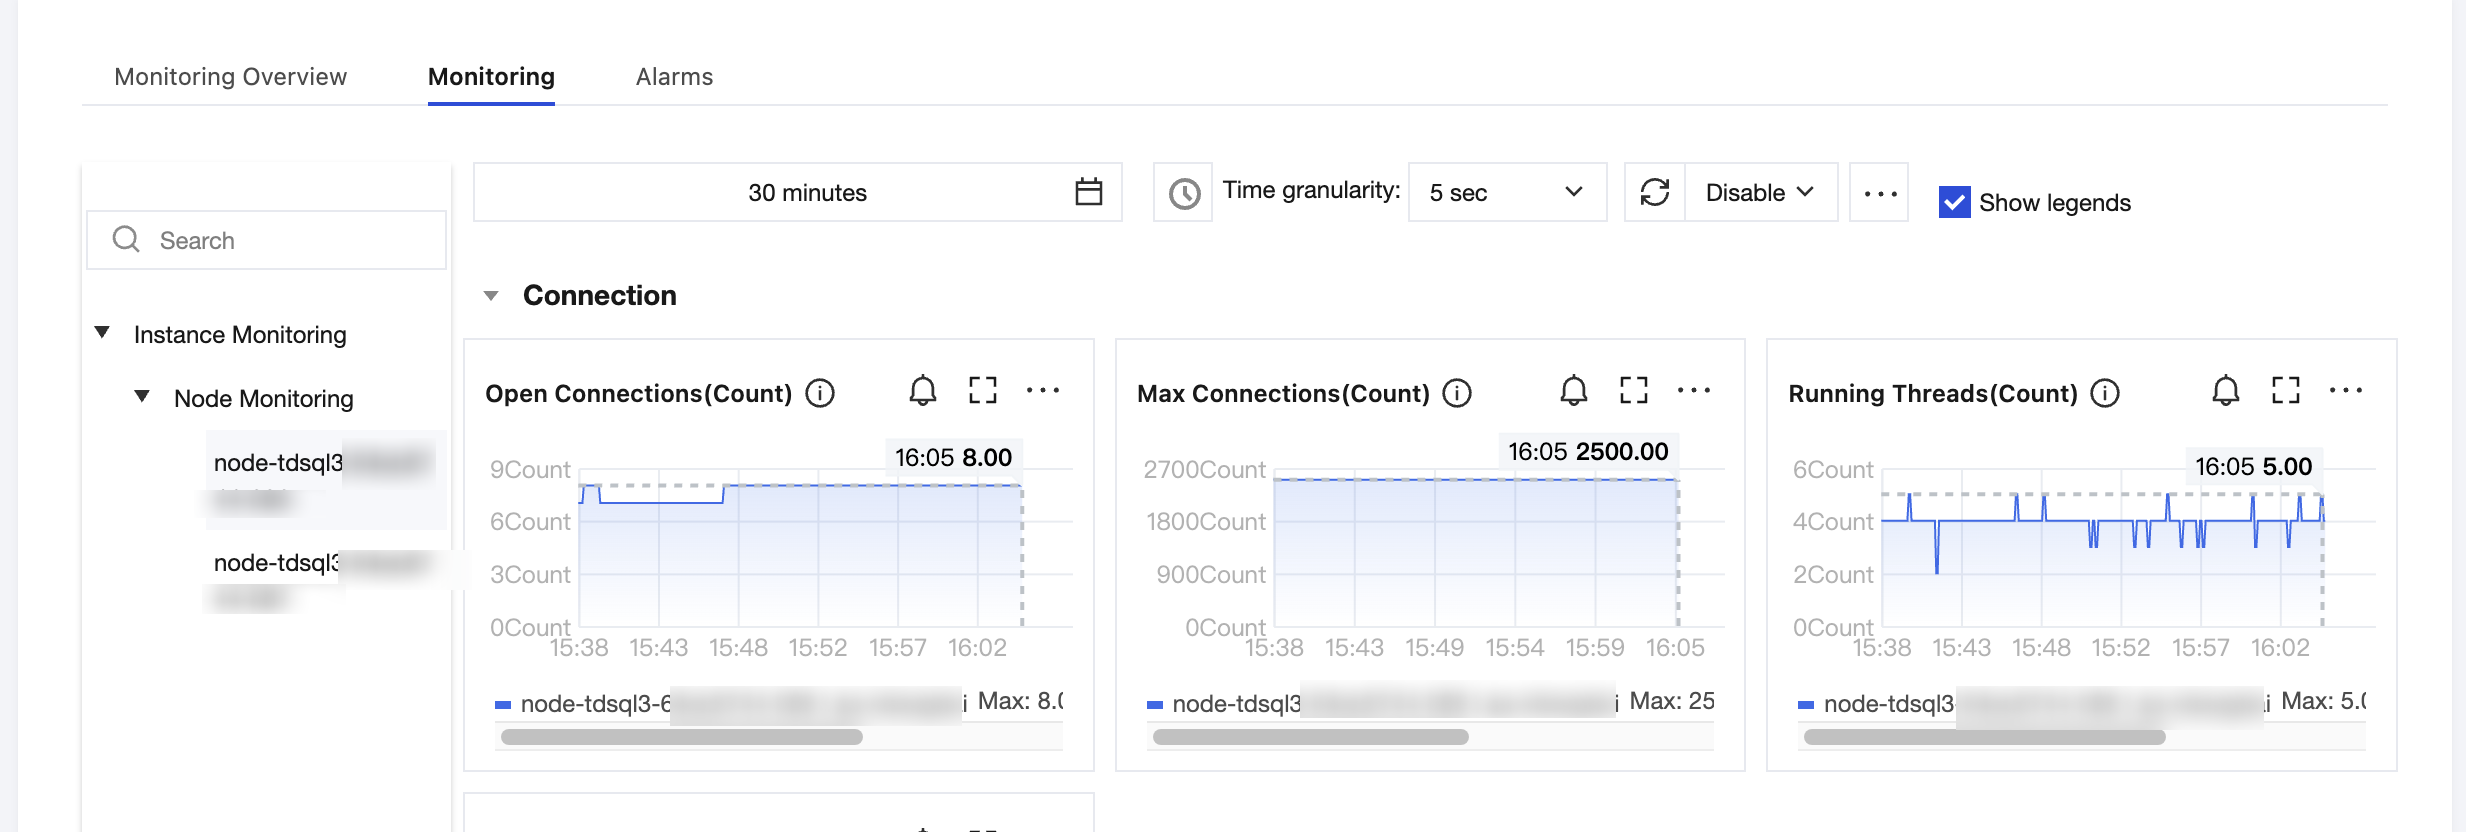
2. Choose Monitoring and Alarms > Monitoring to go to the Monitoring page.
3. In the left navigation pane, select a target node under Instance Monitoring or Node Monitoring (for example, node-tdsql3-******-***). The monitoring metrics for the corresponding dimension are displayed on the right. For the complete list of metrics, see Supported Monitoring Metrics.
4. After selecting the time range to query, you can view the monitoring metrics of the target instance.
Selecting a Monitoring Time Range
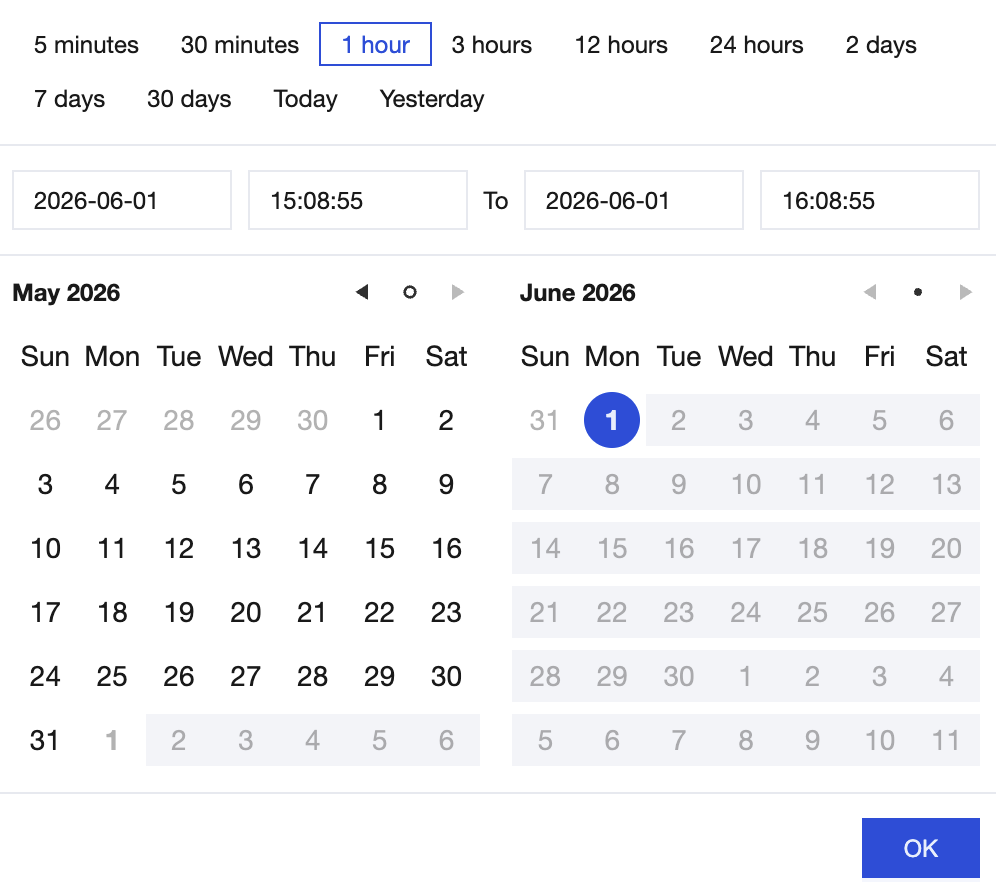
You can query the monitoring status for a specific time period by selecting or customizing the time range.
On the Metric Monitoring page, you can select a time range from the last 5 minutes, 30 minutes, 1 hour, 3 hours, 12 hours, 24 hours, 2 days, 7 days, or 30 days, or click the time box to customize the start and end time for querying the monitoring status.
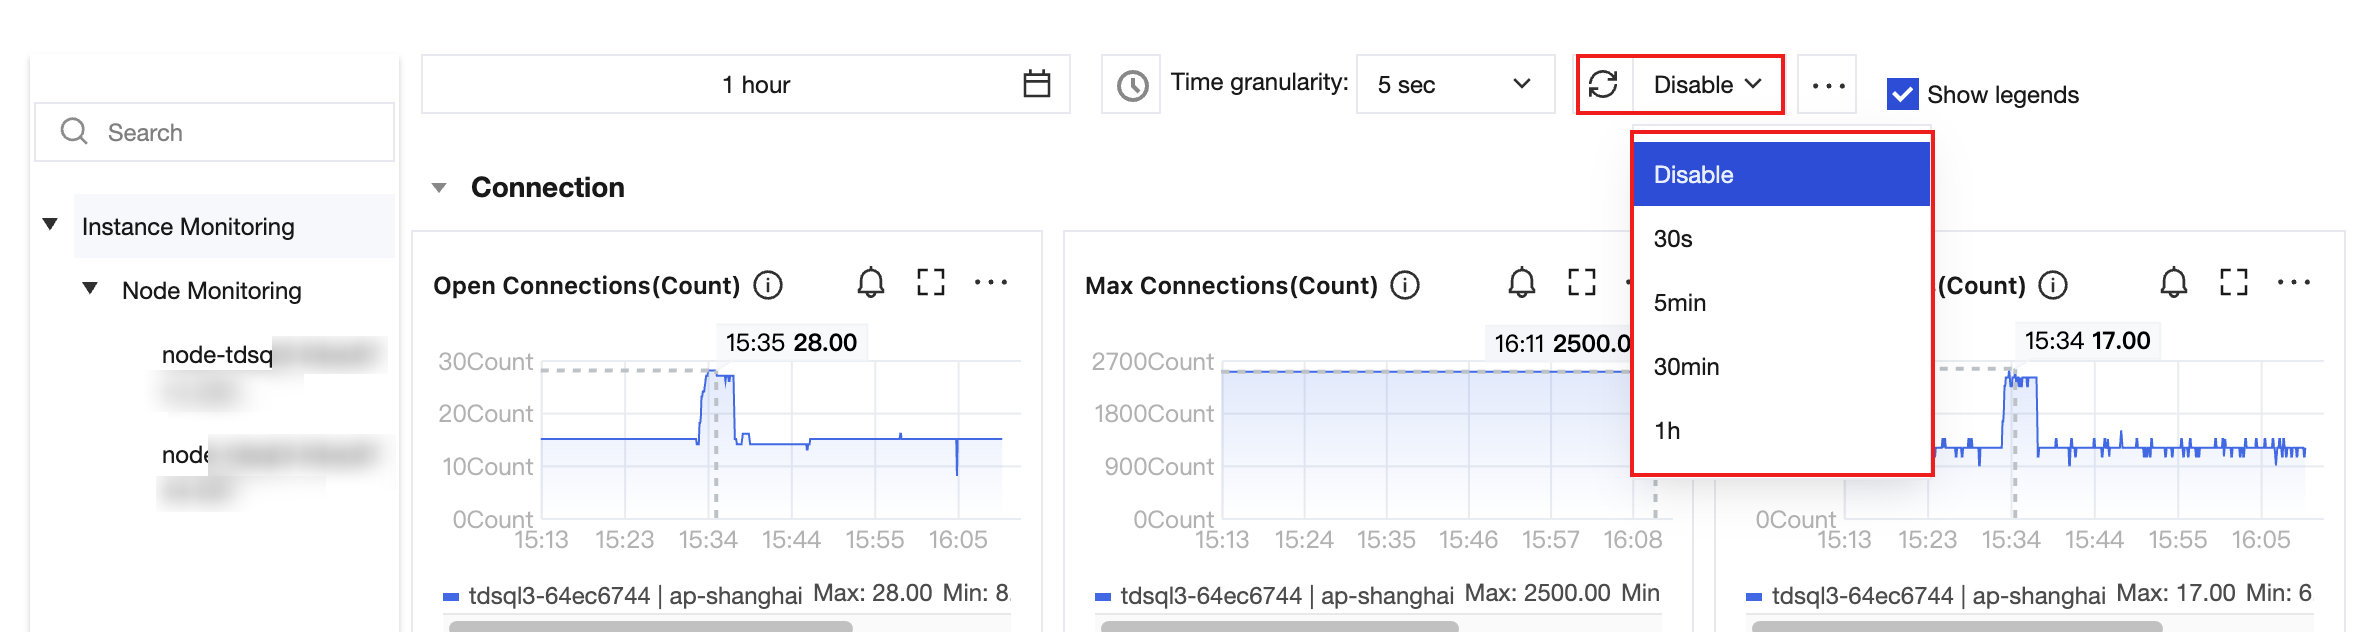
Setting the Monitoring Granularity
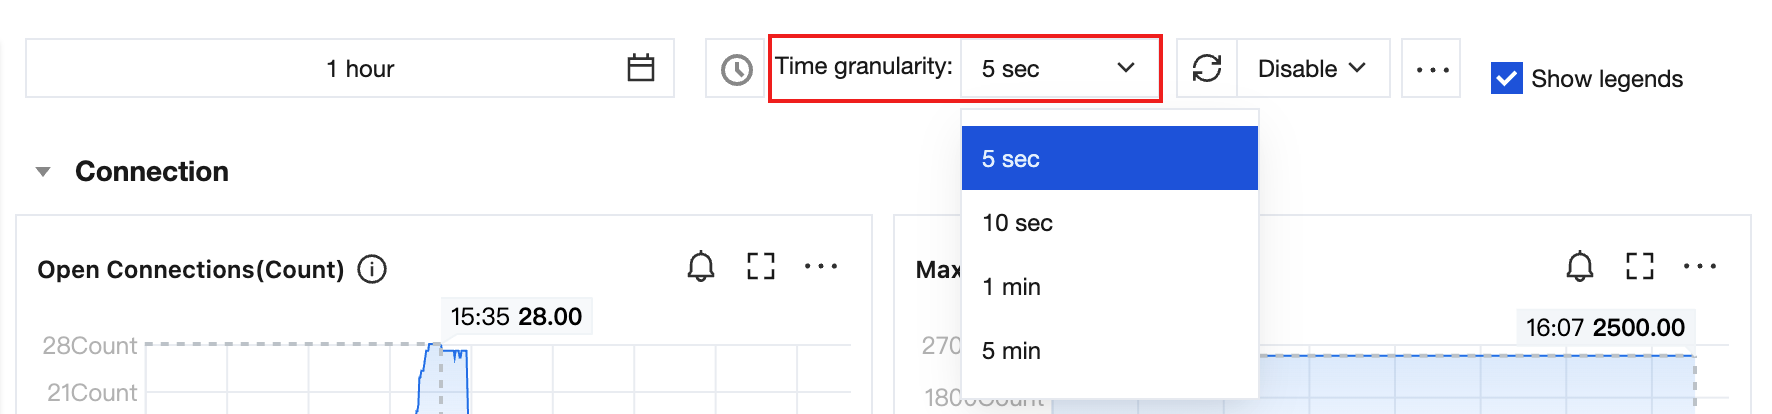
Monitoring granularity determines the time interval corresponding to each sampling point on the curve, facilitating the viewing of monitoring status under different statistical granularities within the selected time range.
On the Monitoring page, click the drop-down box to the right of Time granularity and select the monitoring granularity you want to view.
The monitoring time granularity for TDSQL Boundless is automatically adjusted based on the time range. The policy is as follows:
Monitoring Time Range for Query
Period from Query Start Time to Current Query Time
Default Time Granularity
Selectable Time Granularity
(0h, 1h]
(0d, 1d]
5s
5s/1min/5min
(0h, 1h]
(1d, 15d]
1min
1min/5min
(0h, 1h]
(15d, 31d]
5min
5min
(1h, 24h]
(0d, 15d]
1min
1min/5min/1h
(1h, 24h]
(15d, 31d]
5min
5min/1h
(24h, 7d]
(0d, 31d]
5min
5min/1h/1d
(7d,31d]
(0d, 31d]
1h
1h/1d
Note:
Currently, TDSQL Boundless supports viewing monitoring data for up to 30 days.
Setting Auto Refresh
By enabling scheduled refresh, monitoring curve data is automatically reloaded at specified intervals, allowing you to continuously observe the instance's running status without manual refresh.
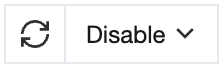
1. On the upper right of the Monitoring page, click
and select the refresh interval.
2. After selection, monitoring data is automatically refreshed at the selected interval. To stop the automatic refresh, click Scheduled Refresh again and select Disable.
Note:
Scheduled refresh only applies to the currently open metric monitoring page. After switching pages or refreshing the browser, you need to reconfigure it.
Copying Charts to Dashboards
Copy charts from the metric monitoring page to a Dashboard in TCOP to aggregate monitoring views across multiple products and instances for unified display and management.
Use Cases
Custom Monitoring Dashboard: Key metrics from different instances are aggregated into a single Dashboard for comprehensive viewing.
Cross-Product Monitoring: Monitoring charts from TDSQL Boundless and other cloud products are combined in a single Dashboard.
Steps
1. On the upper right of the Monitoring page, click Copy to Dashboard.
2. In the Table Replication window that pops up, select a type as needed.
Select existing Dashboard: In the Target Dashboard dropdown, select an existing Dashboard.
New Dashboard: In the input box that pops up, enter a name for the new Dashboard.
3. In the Select copy chart list, select the monitoring charts you want to copy. The selected charts will appear in the Chart Name list on the right.
4. Click OK, and the system will complete the chart copy.
After copying is complete, you can view and manage the target Dashboard in the TCOP Dashboard List.
Note:
After the chart is copied to a Dashboard, the chart data source remains TDSQL Boundless monitoring data, and the charts in the Dashboard are updated synchronously with the source data.
Downloading Monitoring Data
The console supports downloading metric data from the current monitoring page to your local machine as a file, facilitating offline analysis, archiving, or report generation.
1. On the Monitoring page, first adjust the time range, time granularity, and metric filter conditions as needed, then click Download.
2. In the Select Content to Download window that pops up, select the file content you want to download (details or Water level data).
Download Content
Description
details
All monitoring metric sampling data under the current time range and time granularity.
Water level data
Summary water level information, such as the maximum value, minimum value, average value, and P90 for each metric within the current time range.
3. Click Confirm Download, and the file will be saved locally.
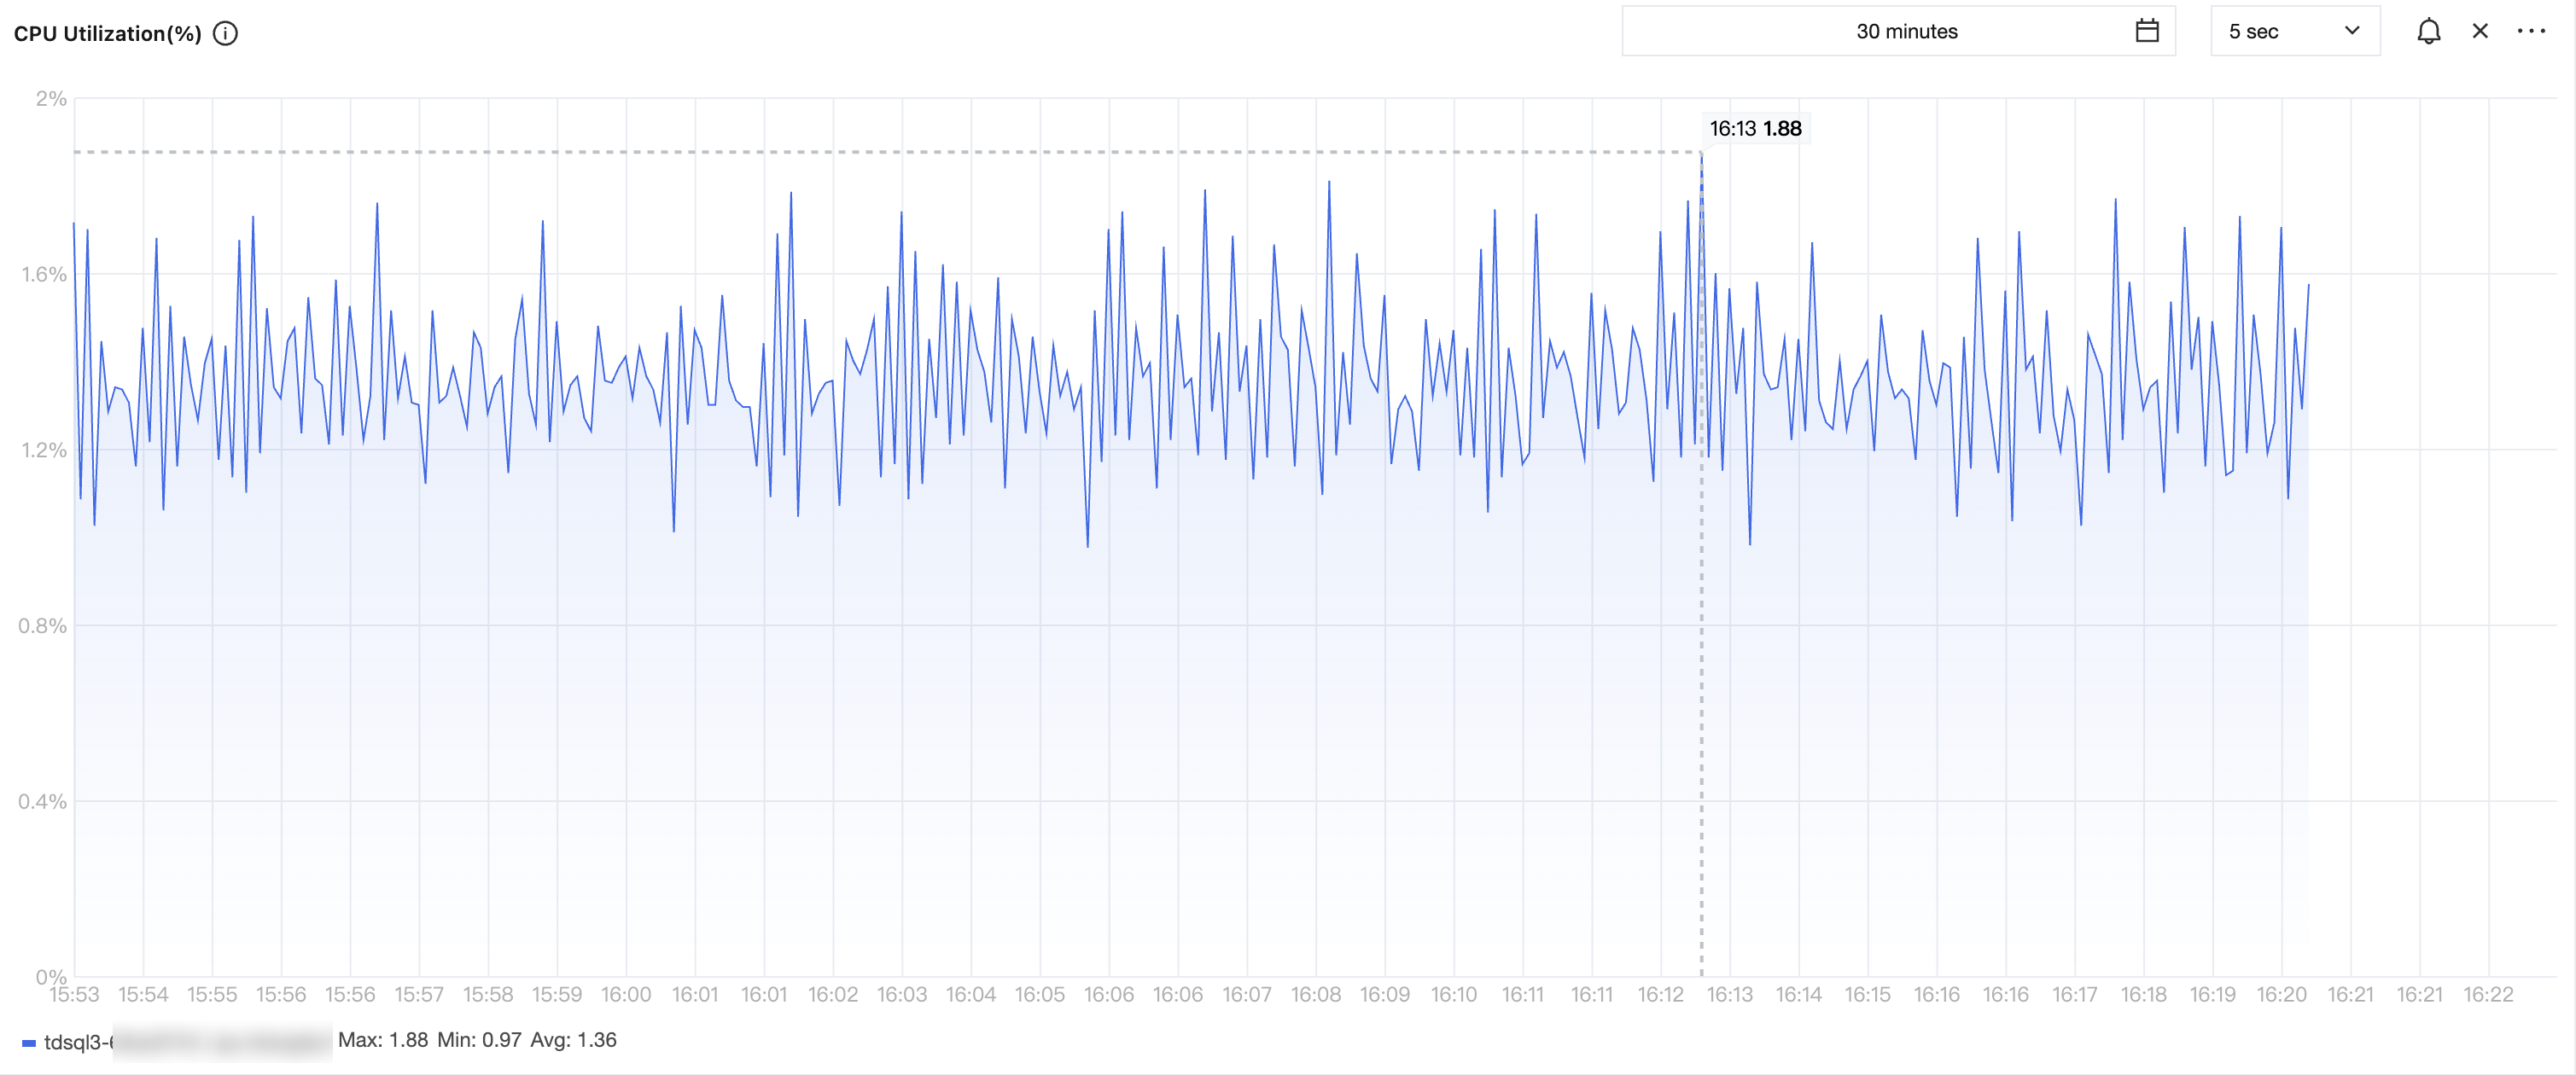
Dashboard Charts
You can display a single metric on a large screen for a clearer preview of the metric data.
On the Monitoring page, click the
icon to the right of any metric to display its details in full-screen mode.
After the data is displayed in full-screen preview mode, you can filter metrics, select a time range and time granularity for the filtered metrics to view their details, and click the
icon in the upper-right corner to close the full-screen display window.