tencent cloud

Tencent Cloud Observability Platform

Release Notes and Announcements
Release Notes
Product Introduction
Overview
Strengths
Basic Features
Basic Concepts
Use Cases
Use Limits
Purchase Guide
Tencent Cloud Product Monitoring
Application Performance Management
Mobile App Performance Monitoring
Real User Monitoring
Cloud Automated Testing
Prometheus Monitoring
Grafana
EventBridge
PTS
Quick Start
Monitoring Overview
Instance Group
Tencent Cloud Product Monitoring
Application Performance Management
Real User Monitoring
Cloud Automated Testing
Performance Testing Service
Prometheus Getting Started
Grafana
Dashboard Creation
EventBridge
Alarm Service
Cloud Product Monitoring
Tencent Cloud Service Metrics
Operation Guide
CVM Agents
Cloud Product Monitoring Integration with Grafana
Troubleshooting
Practical Tutorial
Application Performance Management
Product Introduction
Access Guide
Operation Guide
Practical Tutorial
Parameter Information
FAQs
Mobile App Performance Monitoring
Overview
Operation Guide
Access Guide
Practical Tutorial
Tencent Cloud Real User Monitoring
Product Introduction
Operation Guide
Connection Guide
FAQs
Cloud Automated Testing
Product Introduction
Operation Guide
FAQs
Performance Testing Service
Overview
Operation Guide
Practice Tutorial
JavaScript API List
FAQs
Prometheus Monitoring
Product Introduction
Access Guide
Operation Guide
Practical Tutorial
Terraform
FAQs
Grafana
Product Introduction
Operation Guide
Guide on Grafana Common Features
FAQs
Dashboard
Overview
Operation Guide
Alarm Management
Console Operation Guide
Troubleshooting
FAQs
EventBridge
Product Introduction
Operation Guide
Practical Tutorial
FAQs
Report Management
FAQs
General
Alarm Service
Concepts
Monitoring Charts
CVM Agents
Dynamic Alarm Threshold
CM Connection to Grafana
Documentation Guide
Related Agreements
Application Performance Management Service Level Agreement
APM Privacy Policy
APM Data Processing And Security Agreement
RUM Service Level Agreement
Mobile Performance Monitoring Service Level Agreement
Cloud Automated Testing Service Level Agreement
Prometheus Service Level Agreement
TCMG Service Level Agreements
PTS Service Level Agreement
PTS Use Limits
Cloud Monitor Service Level Agreement
API Documentation
History
Introduction
API Category
Making API Requests
Monitoring Data Query APIs
Alarm APIs
Legacy Alert APIs
Notification Template APIs
TMP APIs
Grafana Service APIs
Event Center APIs
TencentCloud Managed Service for Prometheus APIs
Monitoring APIs
Data Types
Error Codes
Glossary

Migration from Self-Built Prometheus

PDF
Mode fokus
Ukuran font
Terakhir diperbarui: 2024-08-07 22:08:03

Overview

You can quickly migrate from your self-built Prometheus service to TMP.

Directions

Prometheus itself supports remote write to an external storage; therefore, you can add a remote write configuration pointing to TMP in the configuration file of your self-built Prometheus. The steps are as follows:
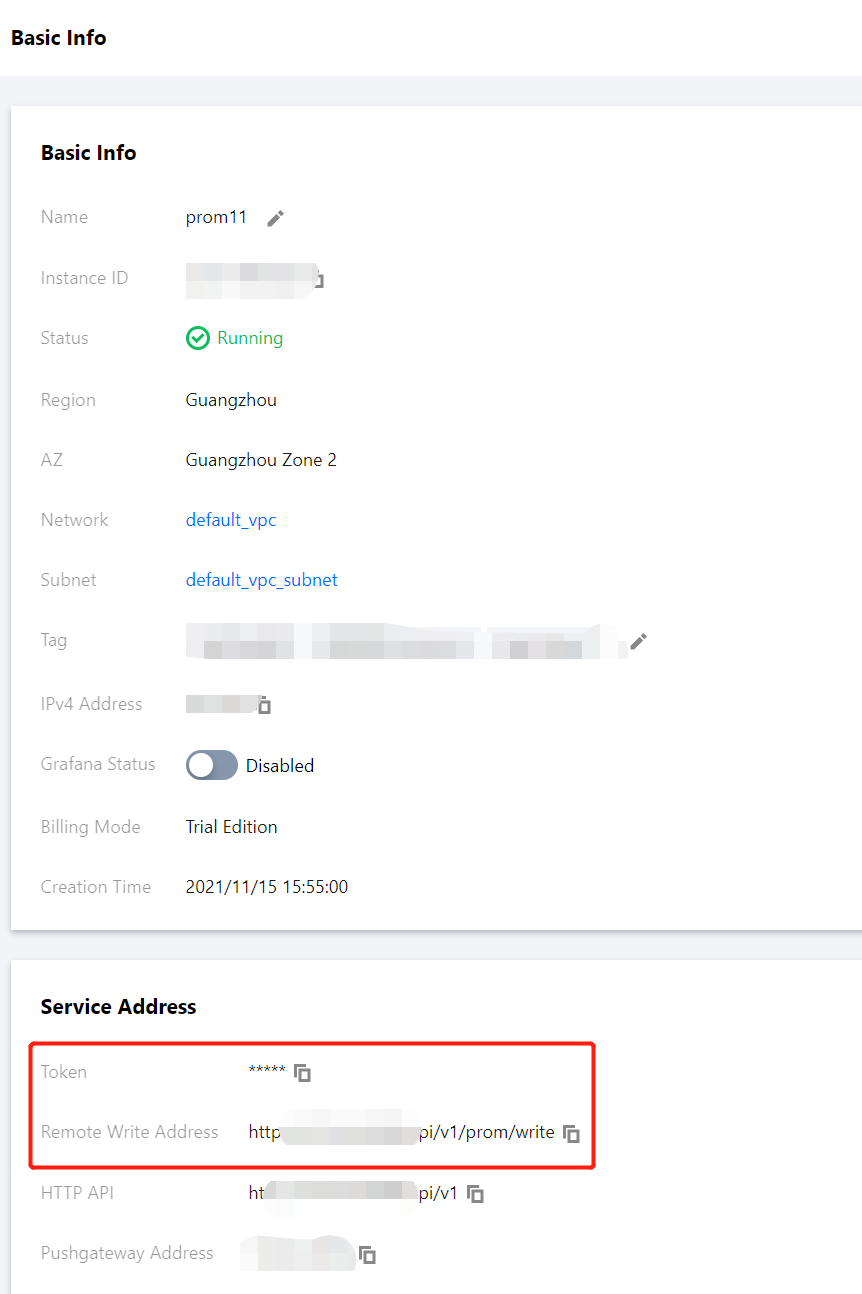
1. Get the remote write address and token of TMP through the basic information of the instance as follows:


2. Modify prometheus.yml and restart Prometheus. The specific configuration is as follows. For more information on the remote write configuration parameters, please see remote_write.
remote_write:

- name: cm_prometheus # Remote write name
url: http://ip:port/api/v1/prom/write # Get the remote write address from the basic information of the TMP instance
remote_timeout: 30s # Set according to the actual situation
bearer_token: k32*****trR # Get the token information from the basic information of the TMP instance

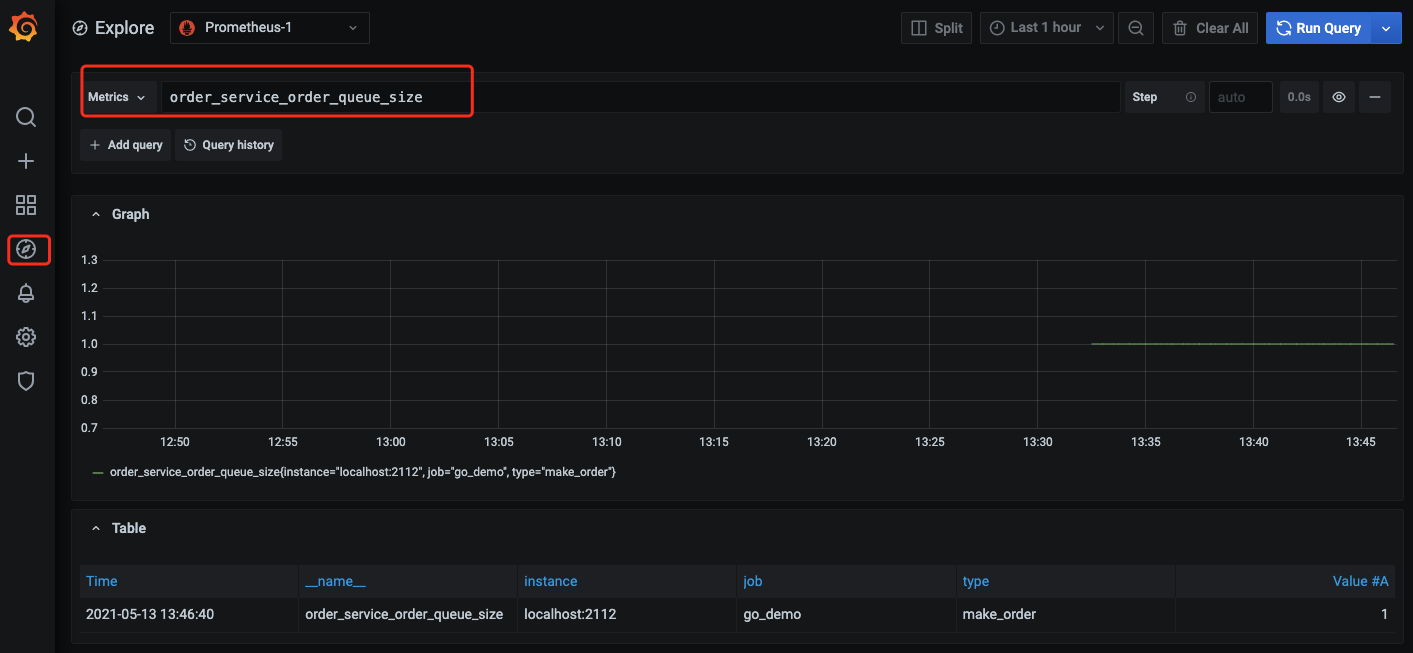
3. Open the Grafana service that comes with TMP and use Explore to verify whether the data is written successfully as shown below. You can also customize Grafana monitoring dashboards.


4. You can also use Prometheus APIs for self-built visualization. For more information, please see Monitoring Data Query.

Bantuan dan Dukungan

Apakah halaman ini membantu?

masukan