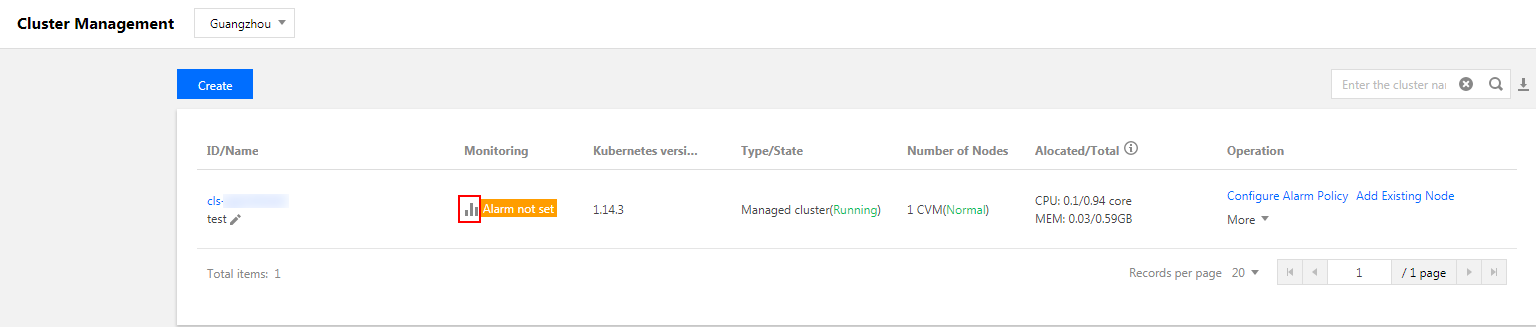
in the row of the cluster for which you want to view the monitoring data. You will see that cluster’s monitoring information as shown in the figure below:
Viewing Node Metrics
Use the steps below to view monitoring information for nodes and Master & Etcd nodes.
1. Click the ID/name of the target cluster to go to the cluster management page.
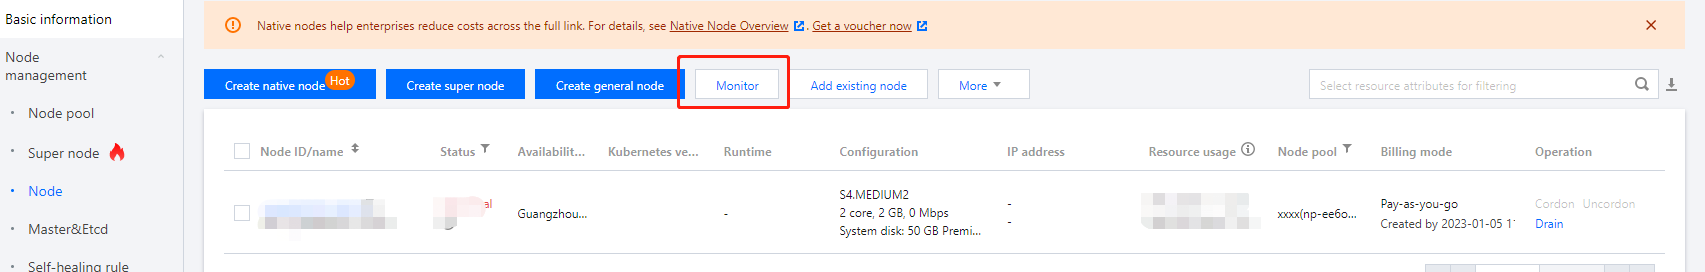
2. Expand Node Management to view monitoring information for ordinary nodes and Master & Etcd nodes.
Select Node > Monitor to go to the Node Monitoring page and view the monitoring information. See the figure below:
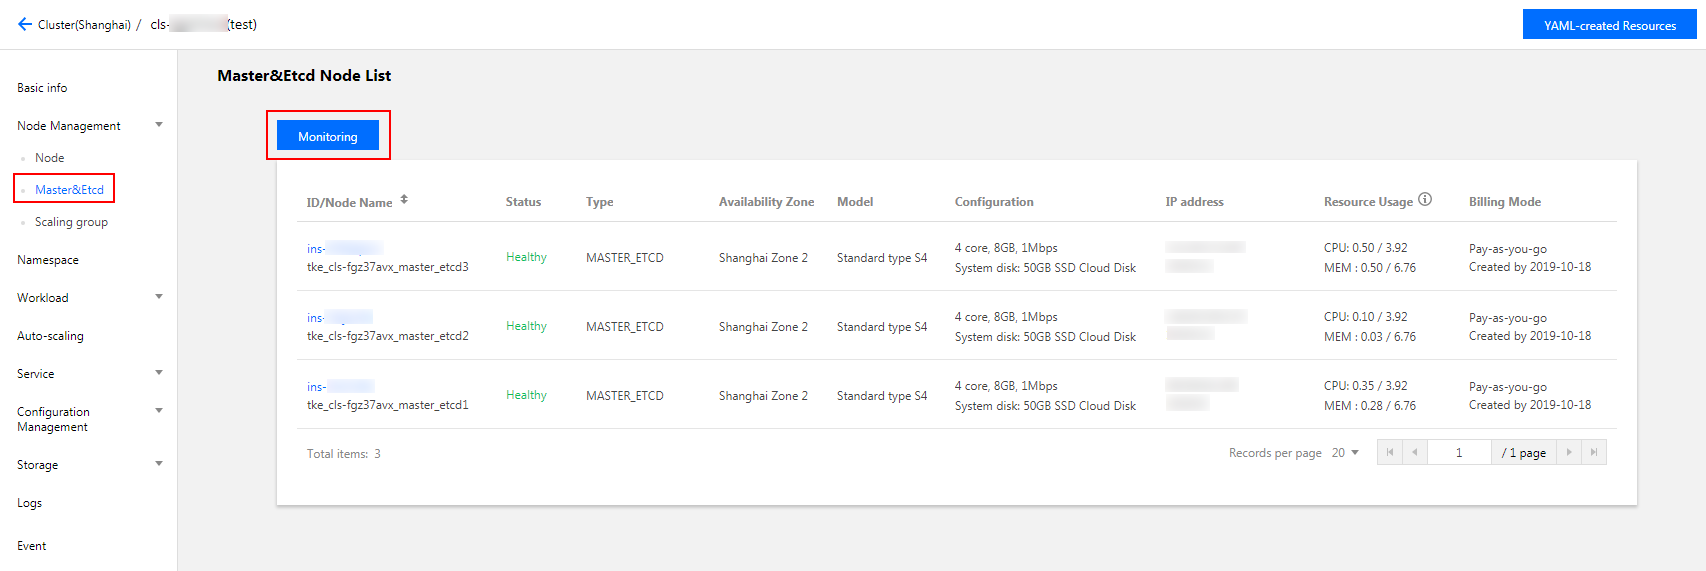
Select Master & Etcd > Monitoring to go to the Master & Etcd Monitoring page and view the monitoring information. See the figure below:
Viewing Metrics of Pods in a Node
1. Click the ID/name of the target cluster to go to the cluster management page.
2. Select Node Management > Node to go to the node list page.
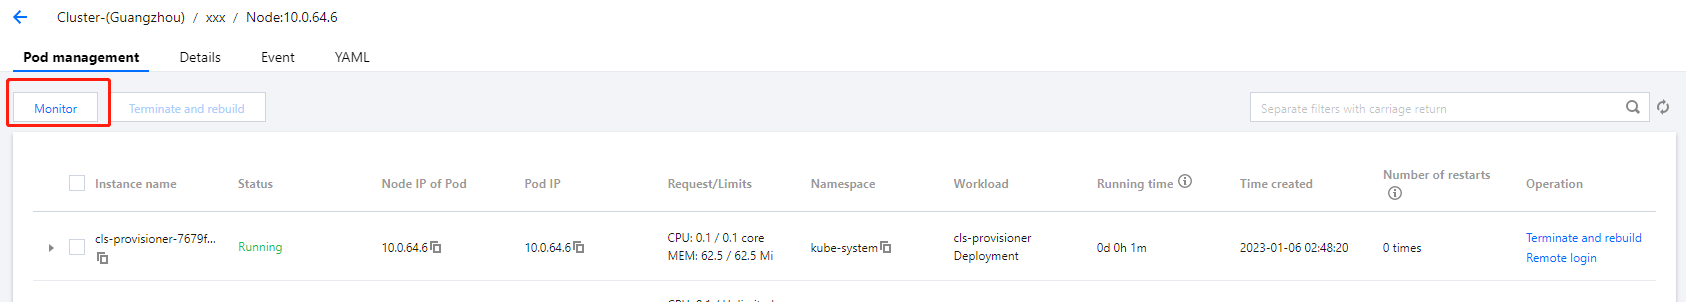
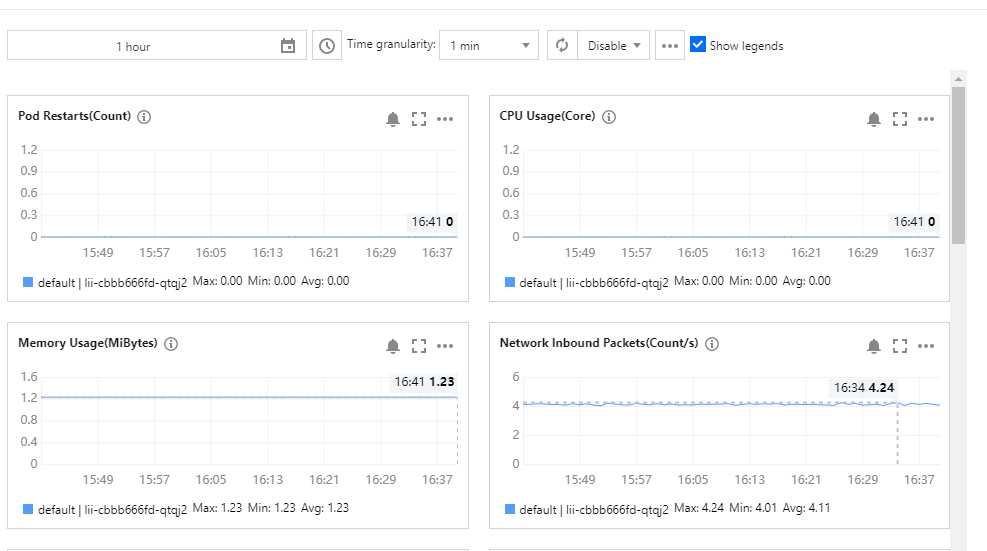
3. Click a node name, click the Pod Management tab, and click Monitor to view the curve chart of the monitored metrics for the pods on that node. See the figure below:
Viewing Workload Metrics
1. Click the ID/name of the target cluster to go to the cluster management page.
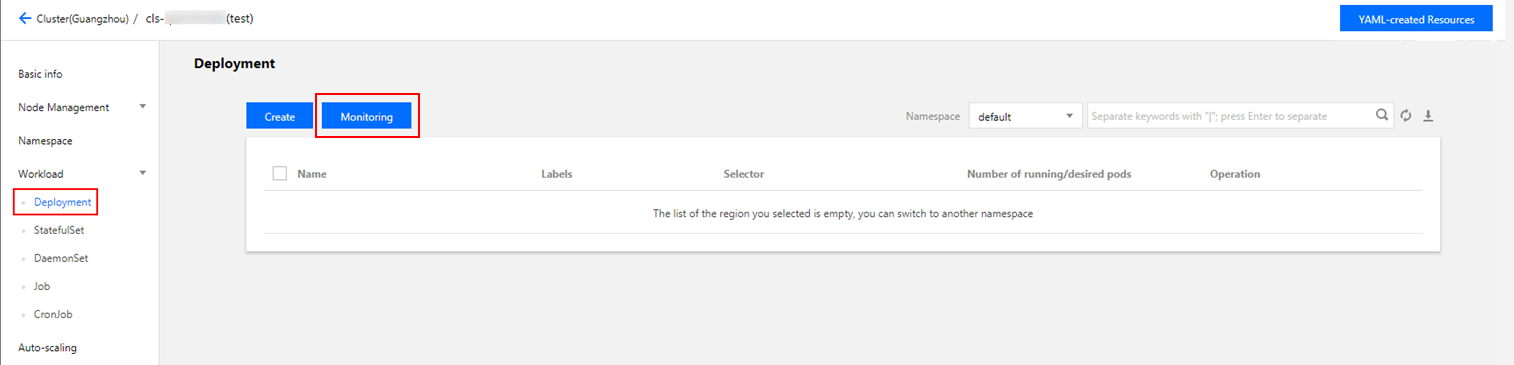
2. Select Workload > Any workload type. In this example, Deployment is selected.
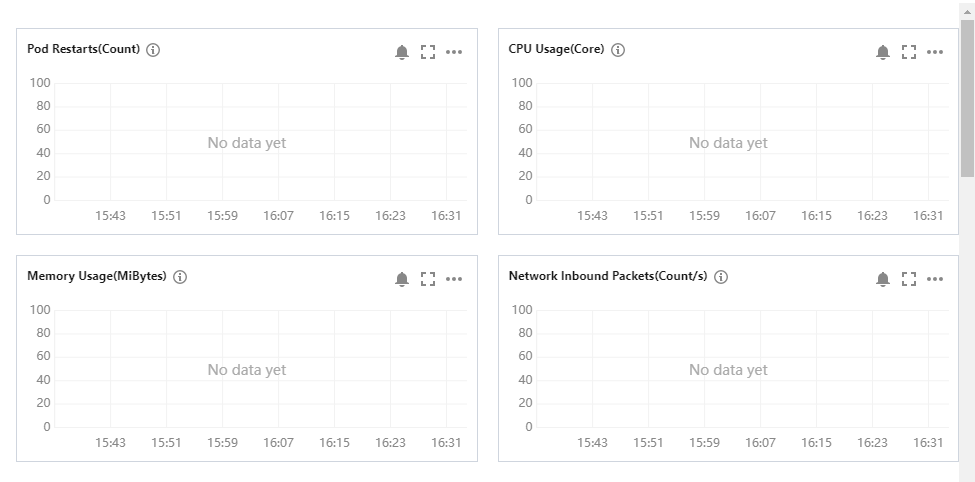
3. Click Monitoring to view the workload monitoring information.
Viewing Metrics of Pods in a Workload
1. Select the ID/name of the cluster you want to view to go to the cluster management page.
2. Select Workload > Any workload type. In this example, Deployment is selected.
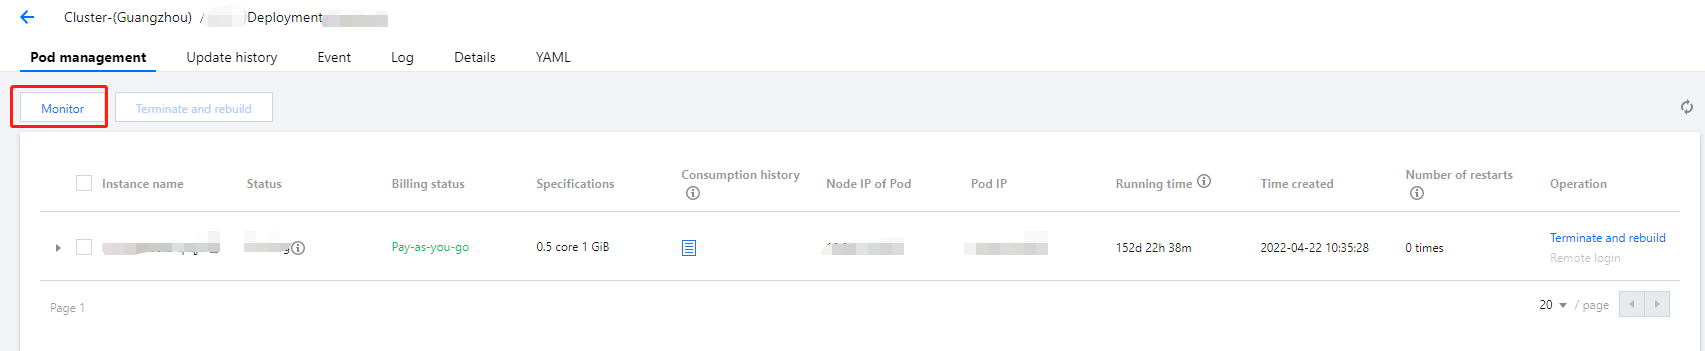
3. Click a workload name. On the Pod management tab of the workload, click Monitor to view the comparison charts of the monitored metrics of all Pods of the workload.
Viewing Metrics of Containers in a Pod
1. Click the ID/name of the target cluster to go to the cluster management page.
2. Select Workload > Any workload type. In this example, Deployment is selected.
3. Click a workload name. On the Pod management tab of the workload, click
on the left of the instance name to view the container information of the Pod.
4. Click
to view the comparison charts of the monitored metrics of the containers in the Pod.