This feature allows you to quickly view multiple detailed metrics of YARN jobs such as the commit queue, status, and duration. Statistics views are also provided for viewing metric statistics in the three dimensions of queue, user, and job type.
Provides data distribution and trend information about the storage of databases and tables.
Provides the distribution of tables based on the last access time as a reference for the distribution of hot and cold data.
Helps you identify data skew in small files and partitions in a table based on the proportion of small files in the table and the amount of data in each partition.
Directions
1. Log in to the EMR console and click the ID/Name of the corresponding cluster in the cluster list.
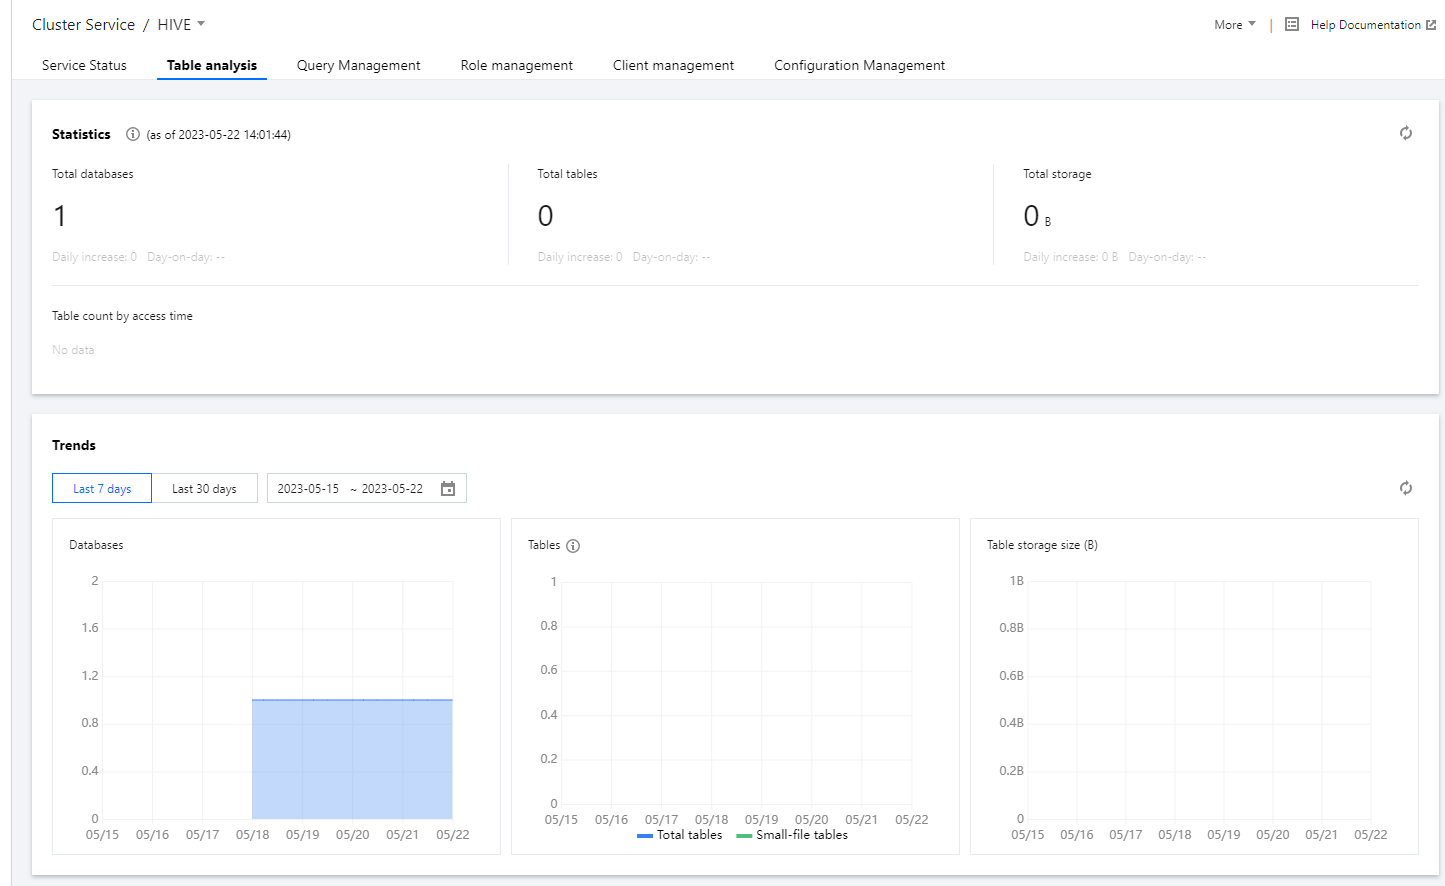
2. On the cluster details page, click Cluster Service and choose Operation > Table Analysis in the top-right corner of the Hive component block to view table and data information based on Hive MetaStore as of the last collection time.
3. Obtain statistical views.
3.1 You can view the daily increase and day-over-day change in metrics such as the number of Hive databases, total number of Hive tables, and total Hive data storage size.
3.2 You can view the distribution of tables based on the last access time as a reference for the distribution of hot and cold data.
Note:
Time Range
Description
Within 3 months
The last access time is within the last 3 months from the current date.
3 months to 1 year
The last access time is more than 3 months ago but within the last year from the current date.
1 to 5 year
The last accesss time is more than 1 year ago but within the last 5 years from the current date.
More than 5 years
The last access time is more than 5 years ago from the current date.
Other
Data collection is not enabled on Cos/CHDFS.
The system failed to collect the last access time of data.
4. The trend view displays the historical trends in the number of databases, number of tables, and storage size of tables. In the table count trend chart, the trend in the number of small files is also shown, providing insights into the distribution and growth trends of small files.
5. You can view the following information about a table: database, storage size, number of files, proportion of small files, and partitioning status. The number of files and proportion of small files provide insights into any issues with small files in Hive.
6. By clicking "View Partition Details", you can view some information about a partition, such as the name, size, and total number of files. This offers insights into the distribution of data across partitions and the number of files in each partition.
Risk description
The data required for table analysis is collected at 14:00 every day.
1. Data collected mainly includes metadata on databases, tables, and partitions stored in HMS, as well as directory information stored in NameNode. This may lead to a slight increase in the number of requests made to HMS and NameNode. If the number of requests continues to grow and exceeds the capacity limit, submit a ticket to disable this feature.
2. The collection of data from HMS and NameNode involves only metadata and does not involve specific business data.