Cost Explorer
ダウンロード
フォーカスモード
フォントサイズ
Overview
Cost Explorer is a basic feature of cost management. It helps you analyze your bill data flexibly and efficiently and gives you a clearer understanding of your cloud costs.
Cost report feature allows you to save the filter condition of cost analysis as a snapshot that can be easily referenced and shared.
Cost Explorer
Log in to the Tencent Cloud with your customer account and enter the Billing Center, and click Cost Management > Cost Explorer in the left sidebar to enter the Cost Explorer page.
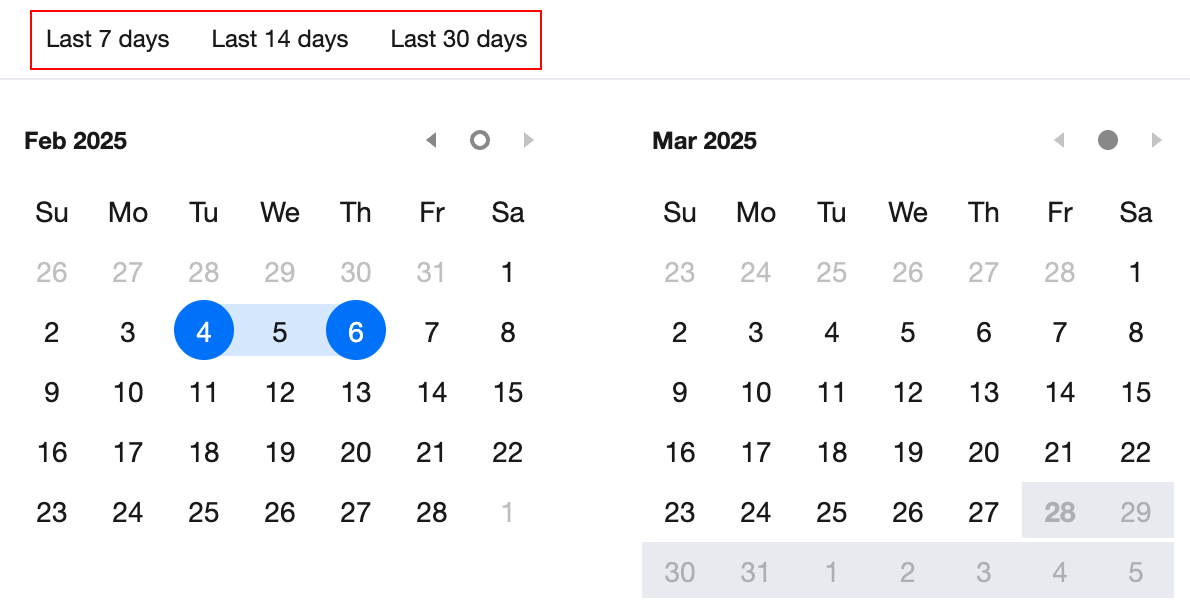
Time period
The time window supports two modes: Specified period and Relative period. It supports daily and monthly granularities. It also supports the Monthly Compare mode.
Specified period: Select the start date and the end date in the calendar.
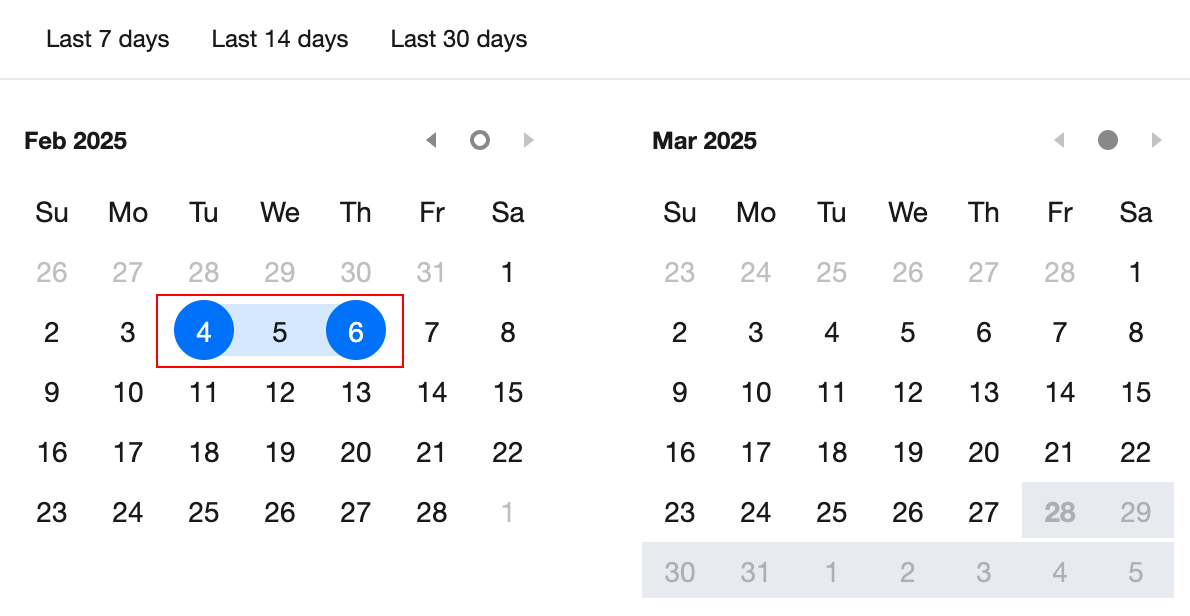
Relative period: Select a time period from the top of the calendar. This is mainly used to automatically update a regularly occurring cost report.
Monthly Compare Mode: This mode allows you to compare cost differences across any two months from different dimensions. By default, the month to be compared is the current month, and the baseline month is the previous month.

Categories
You can select different categories to aggregate and display your costs based on different dimensions.
Currently supported dimensions: Product, Sub-product, Component Type, Component Name, Resource ID, Region, AZ, Transaction Type, Billing Mode, Tag, Project, Payer UIN, Owner UIN.
Note:
The chart displays only the first 10 items for the selected category. Any remaining items are summarized as "others". You can view and download the full data in the Cost Details table displayed under the chart.
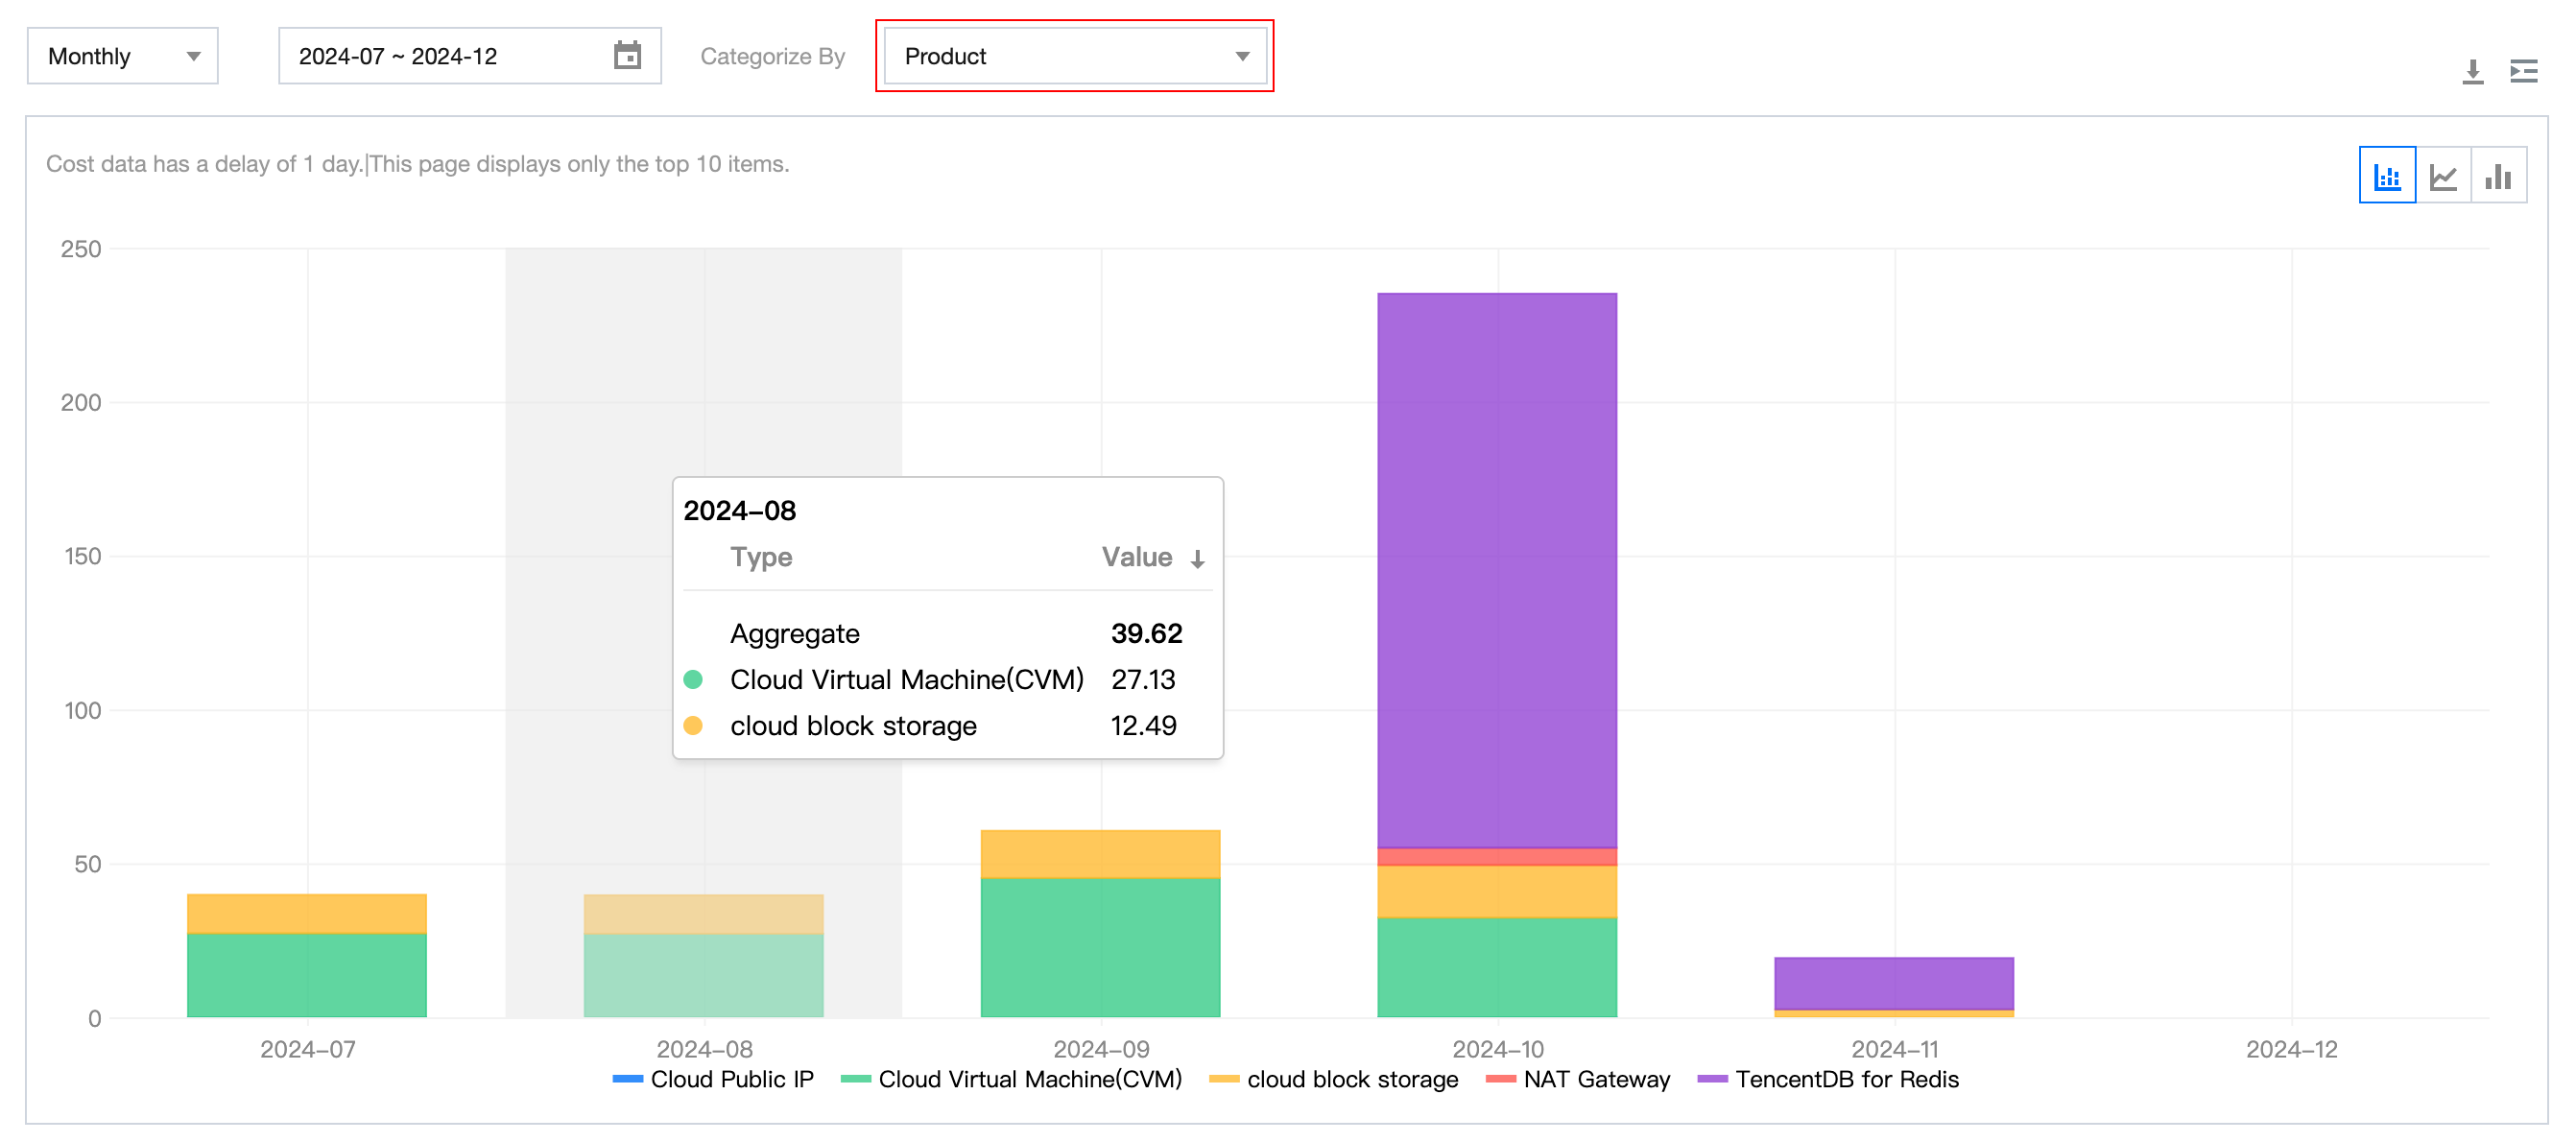
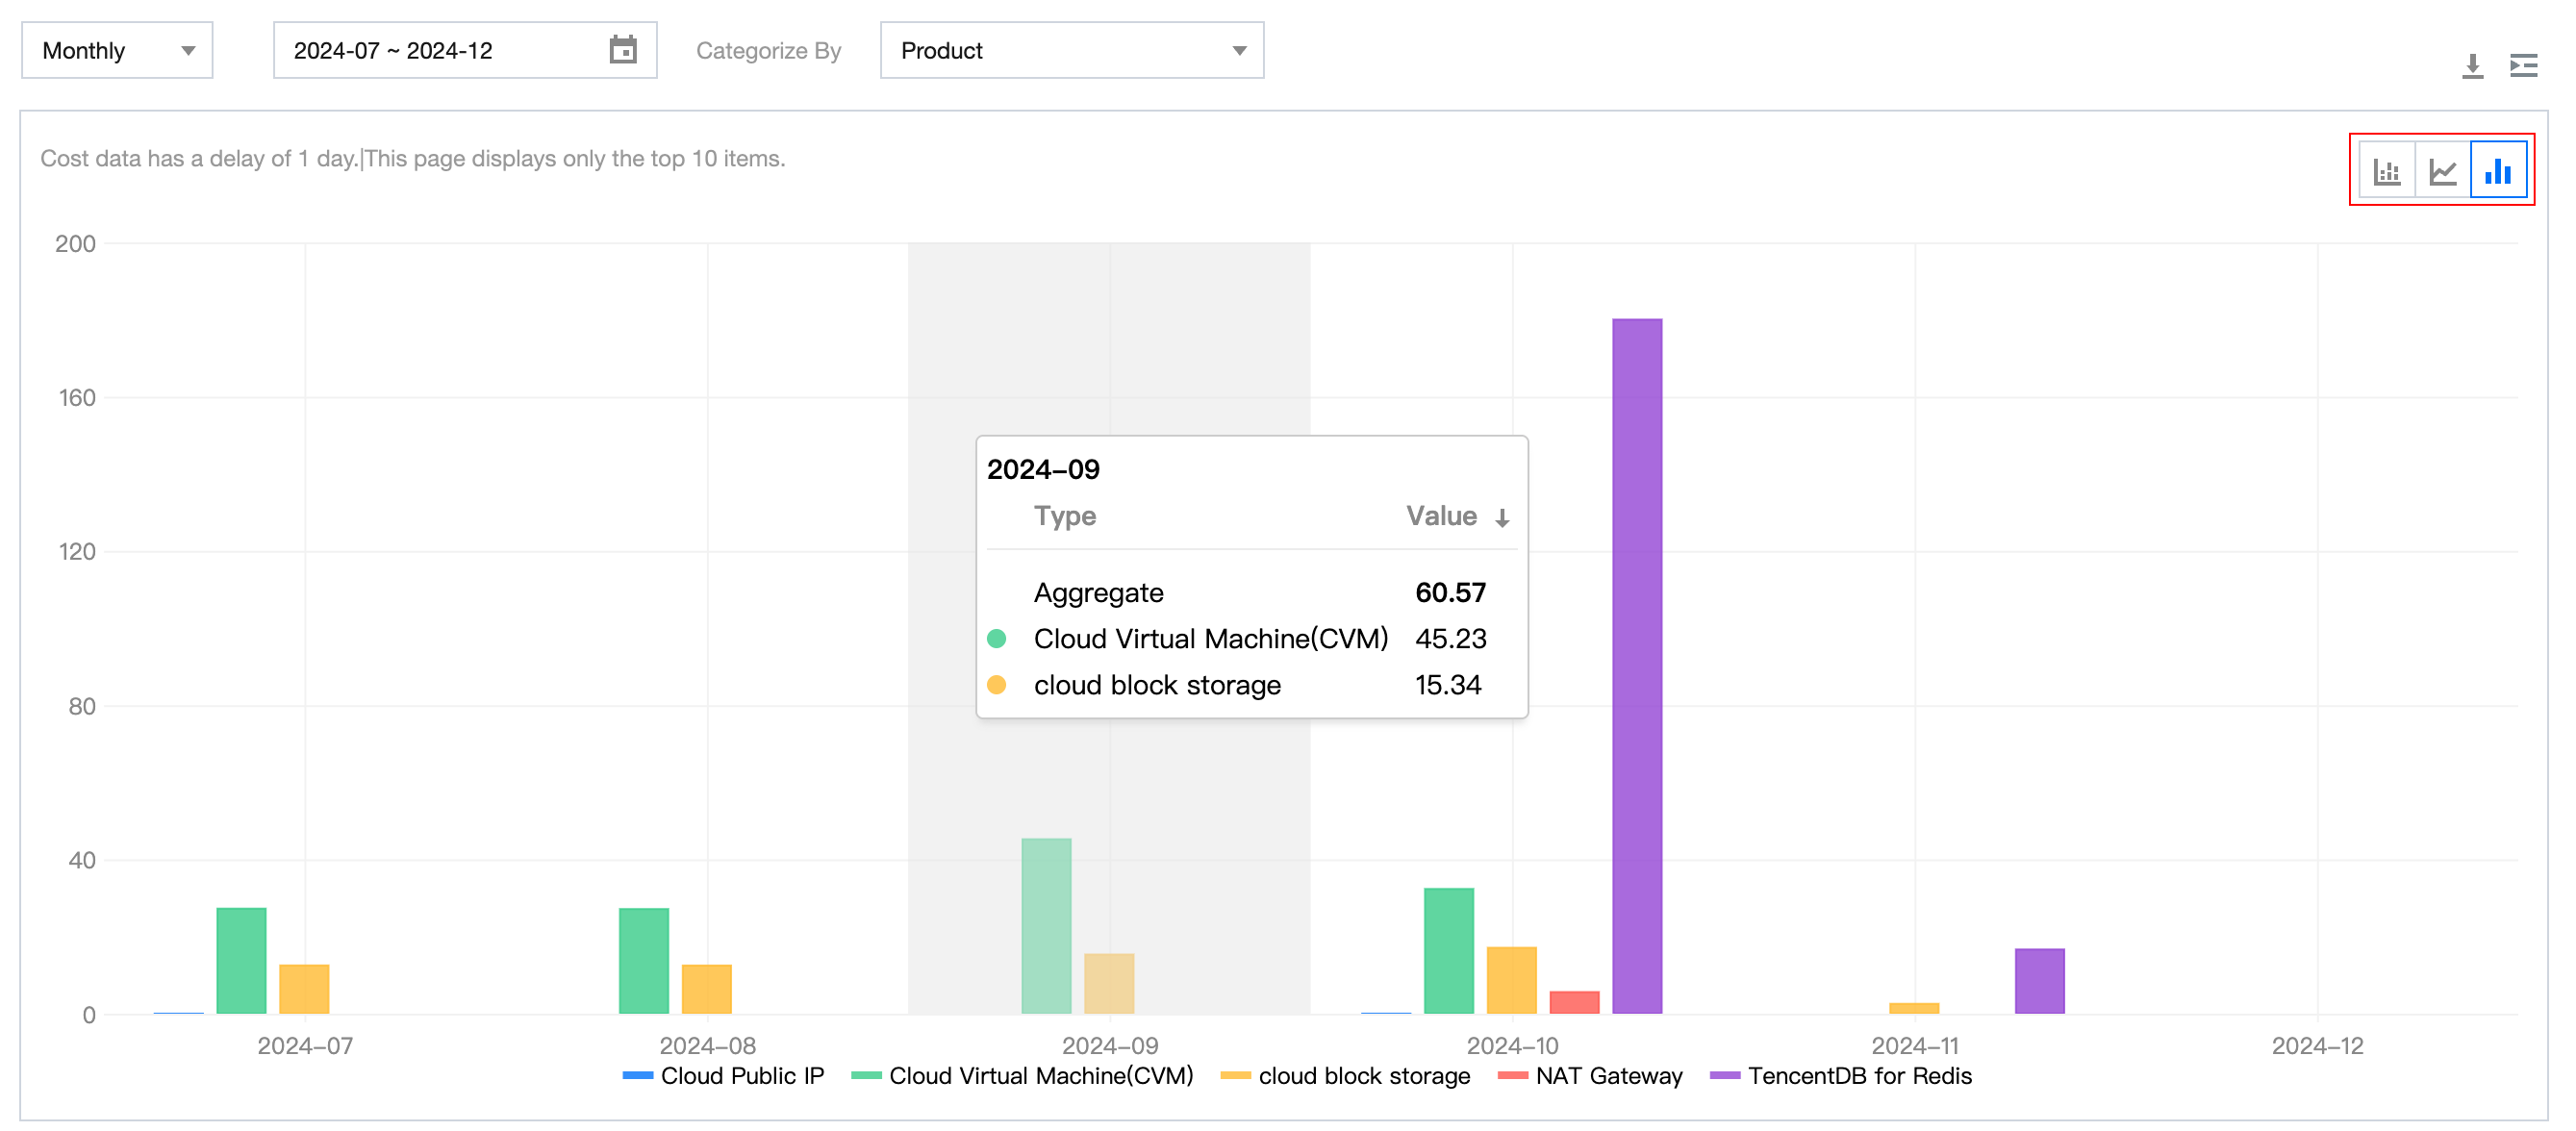
Chart types
You can change the chart type to stacked bar chart, line chart, and bar chart.
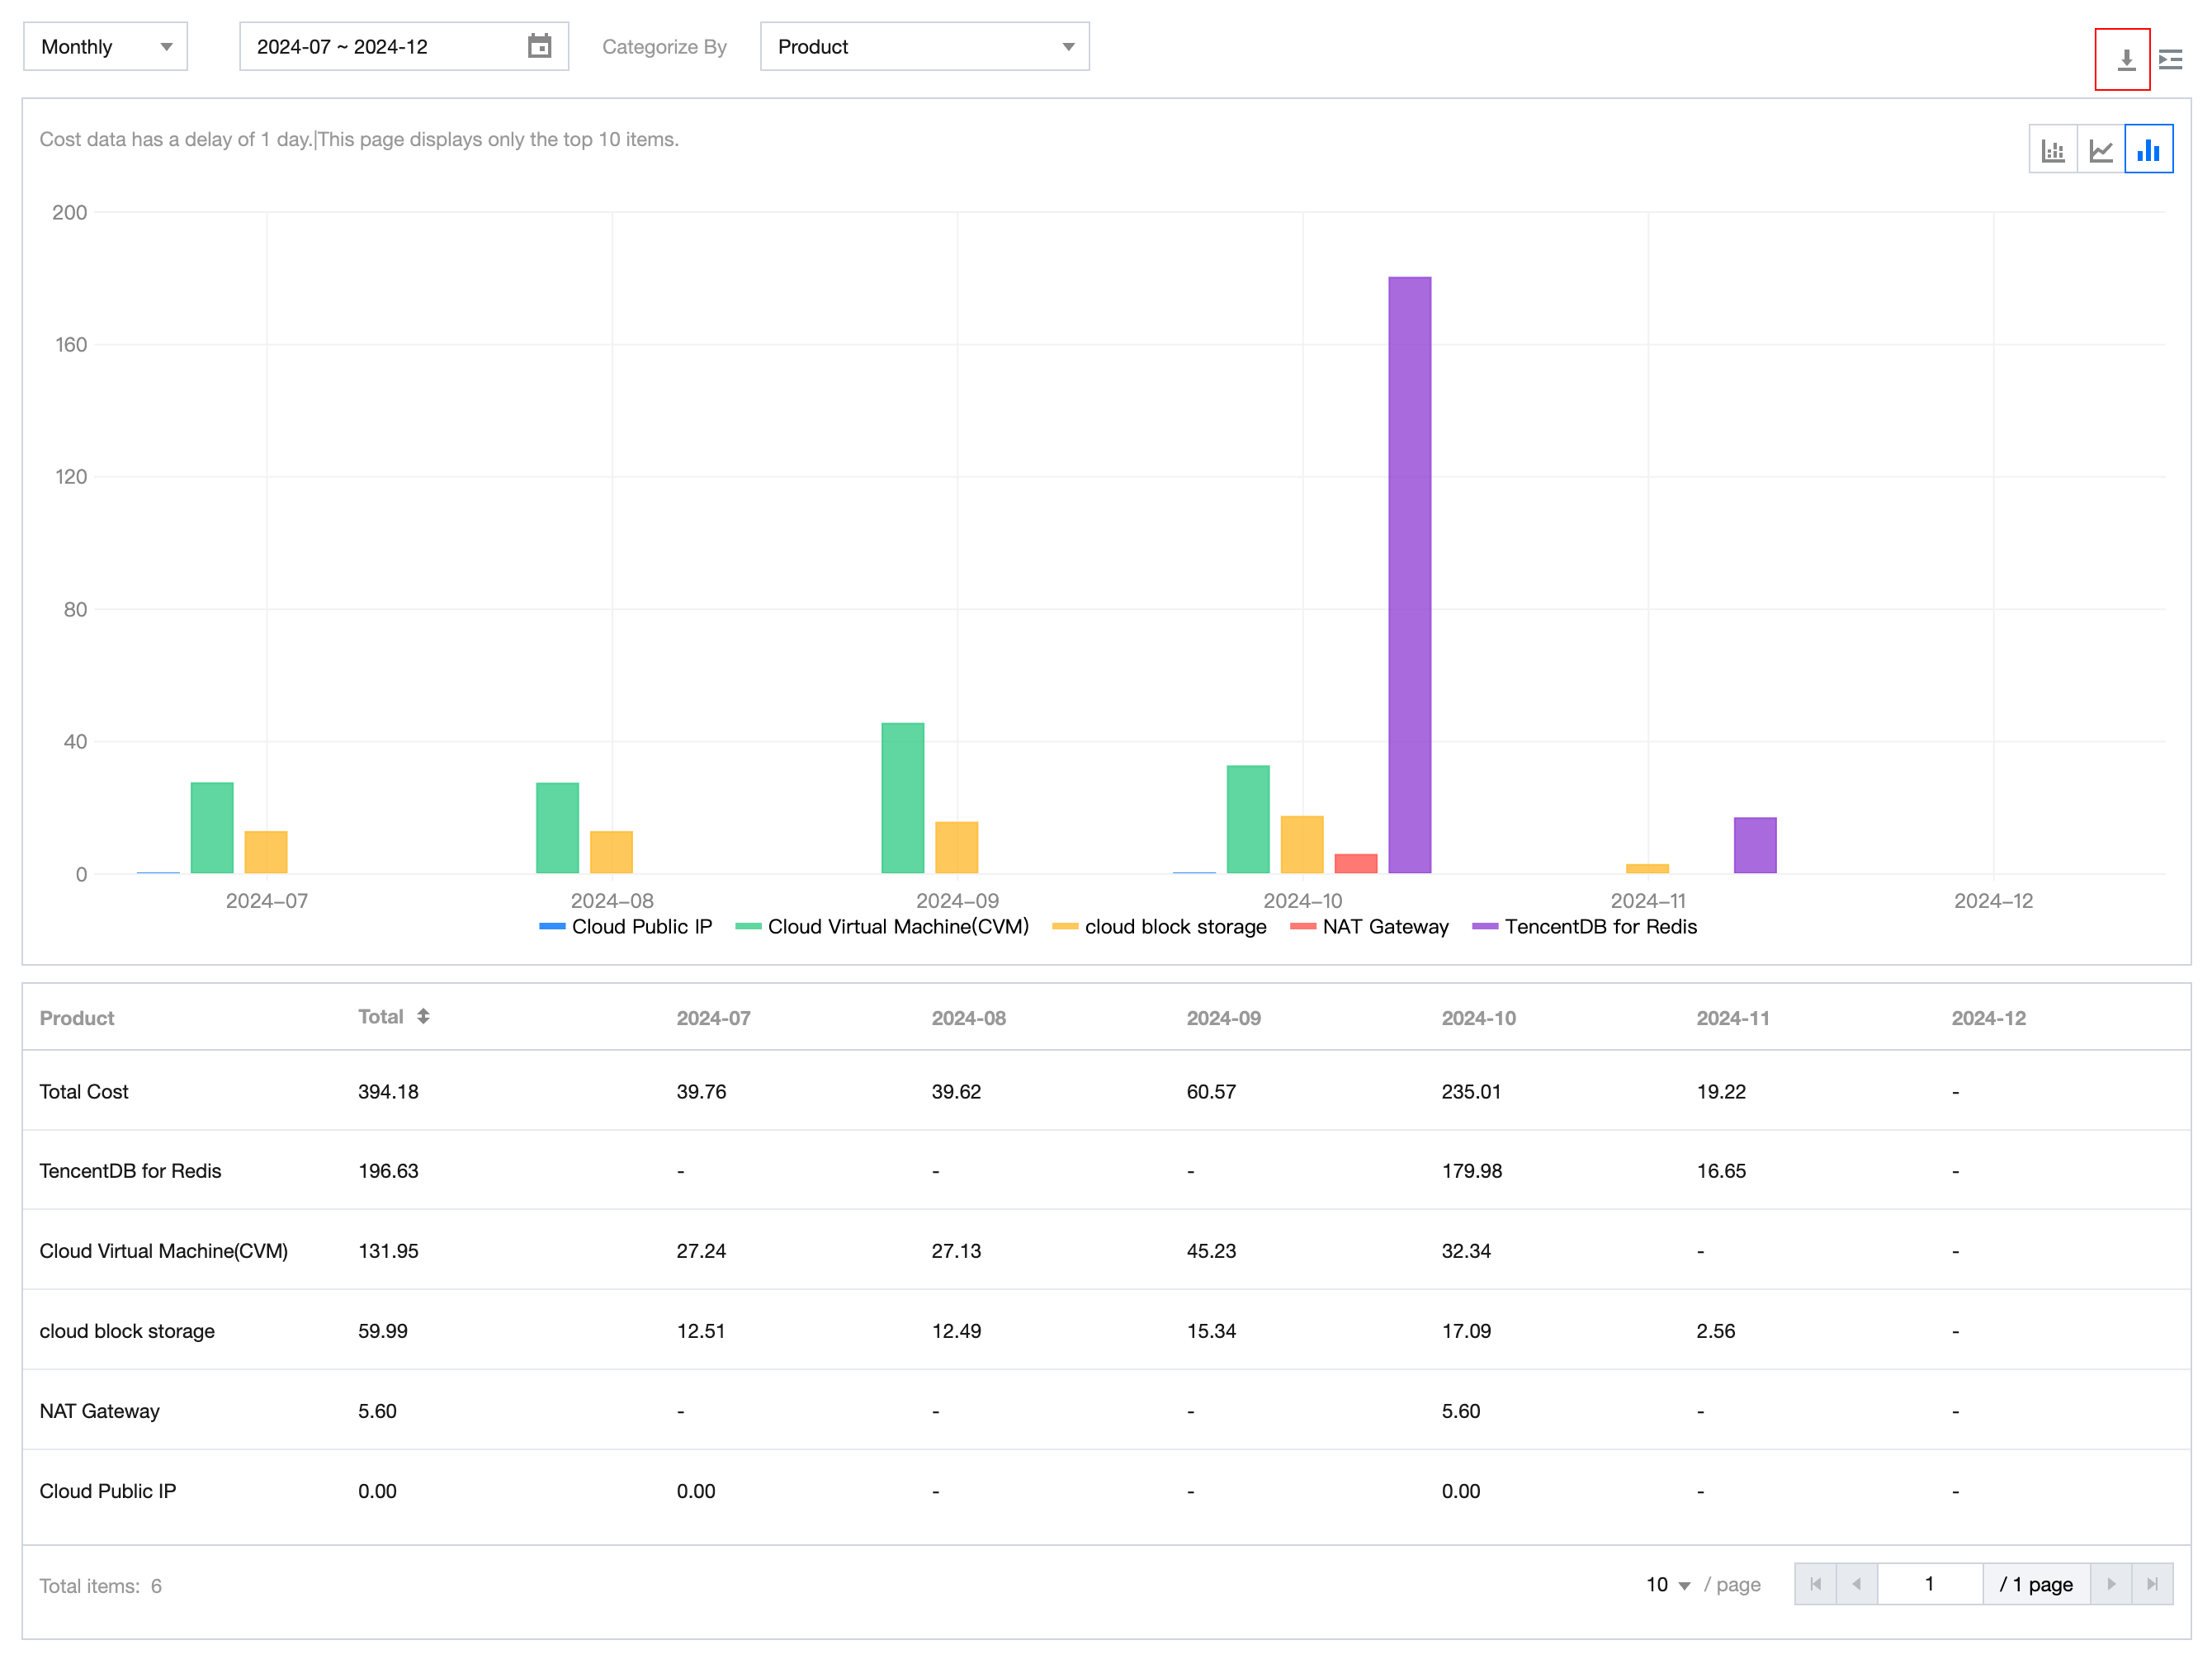
Cost details
The detailed cost data supports pagination queries and downloads. Simply click the download button to export the data.
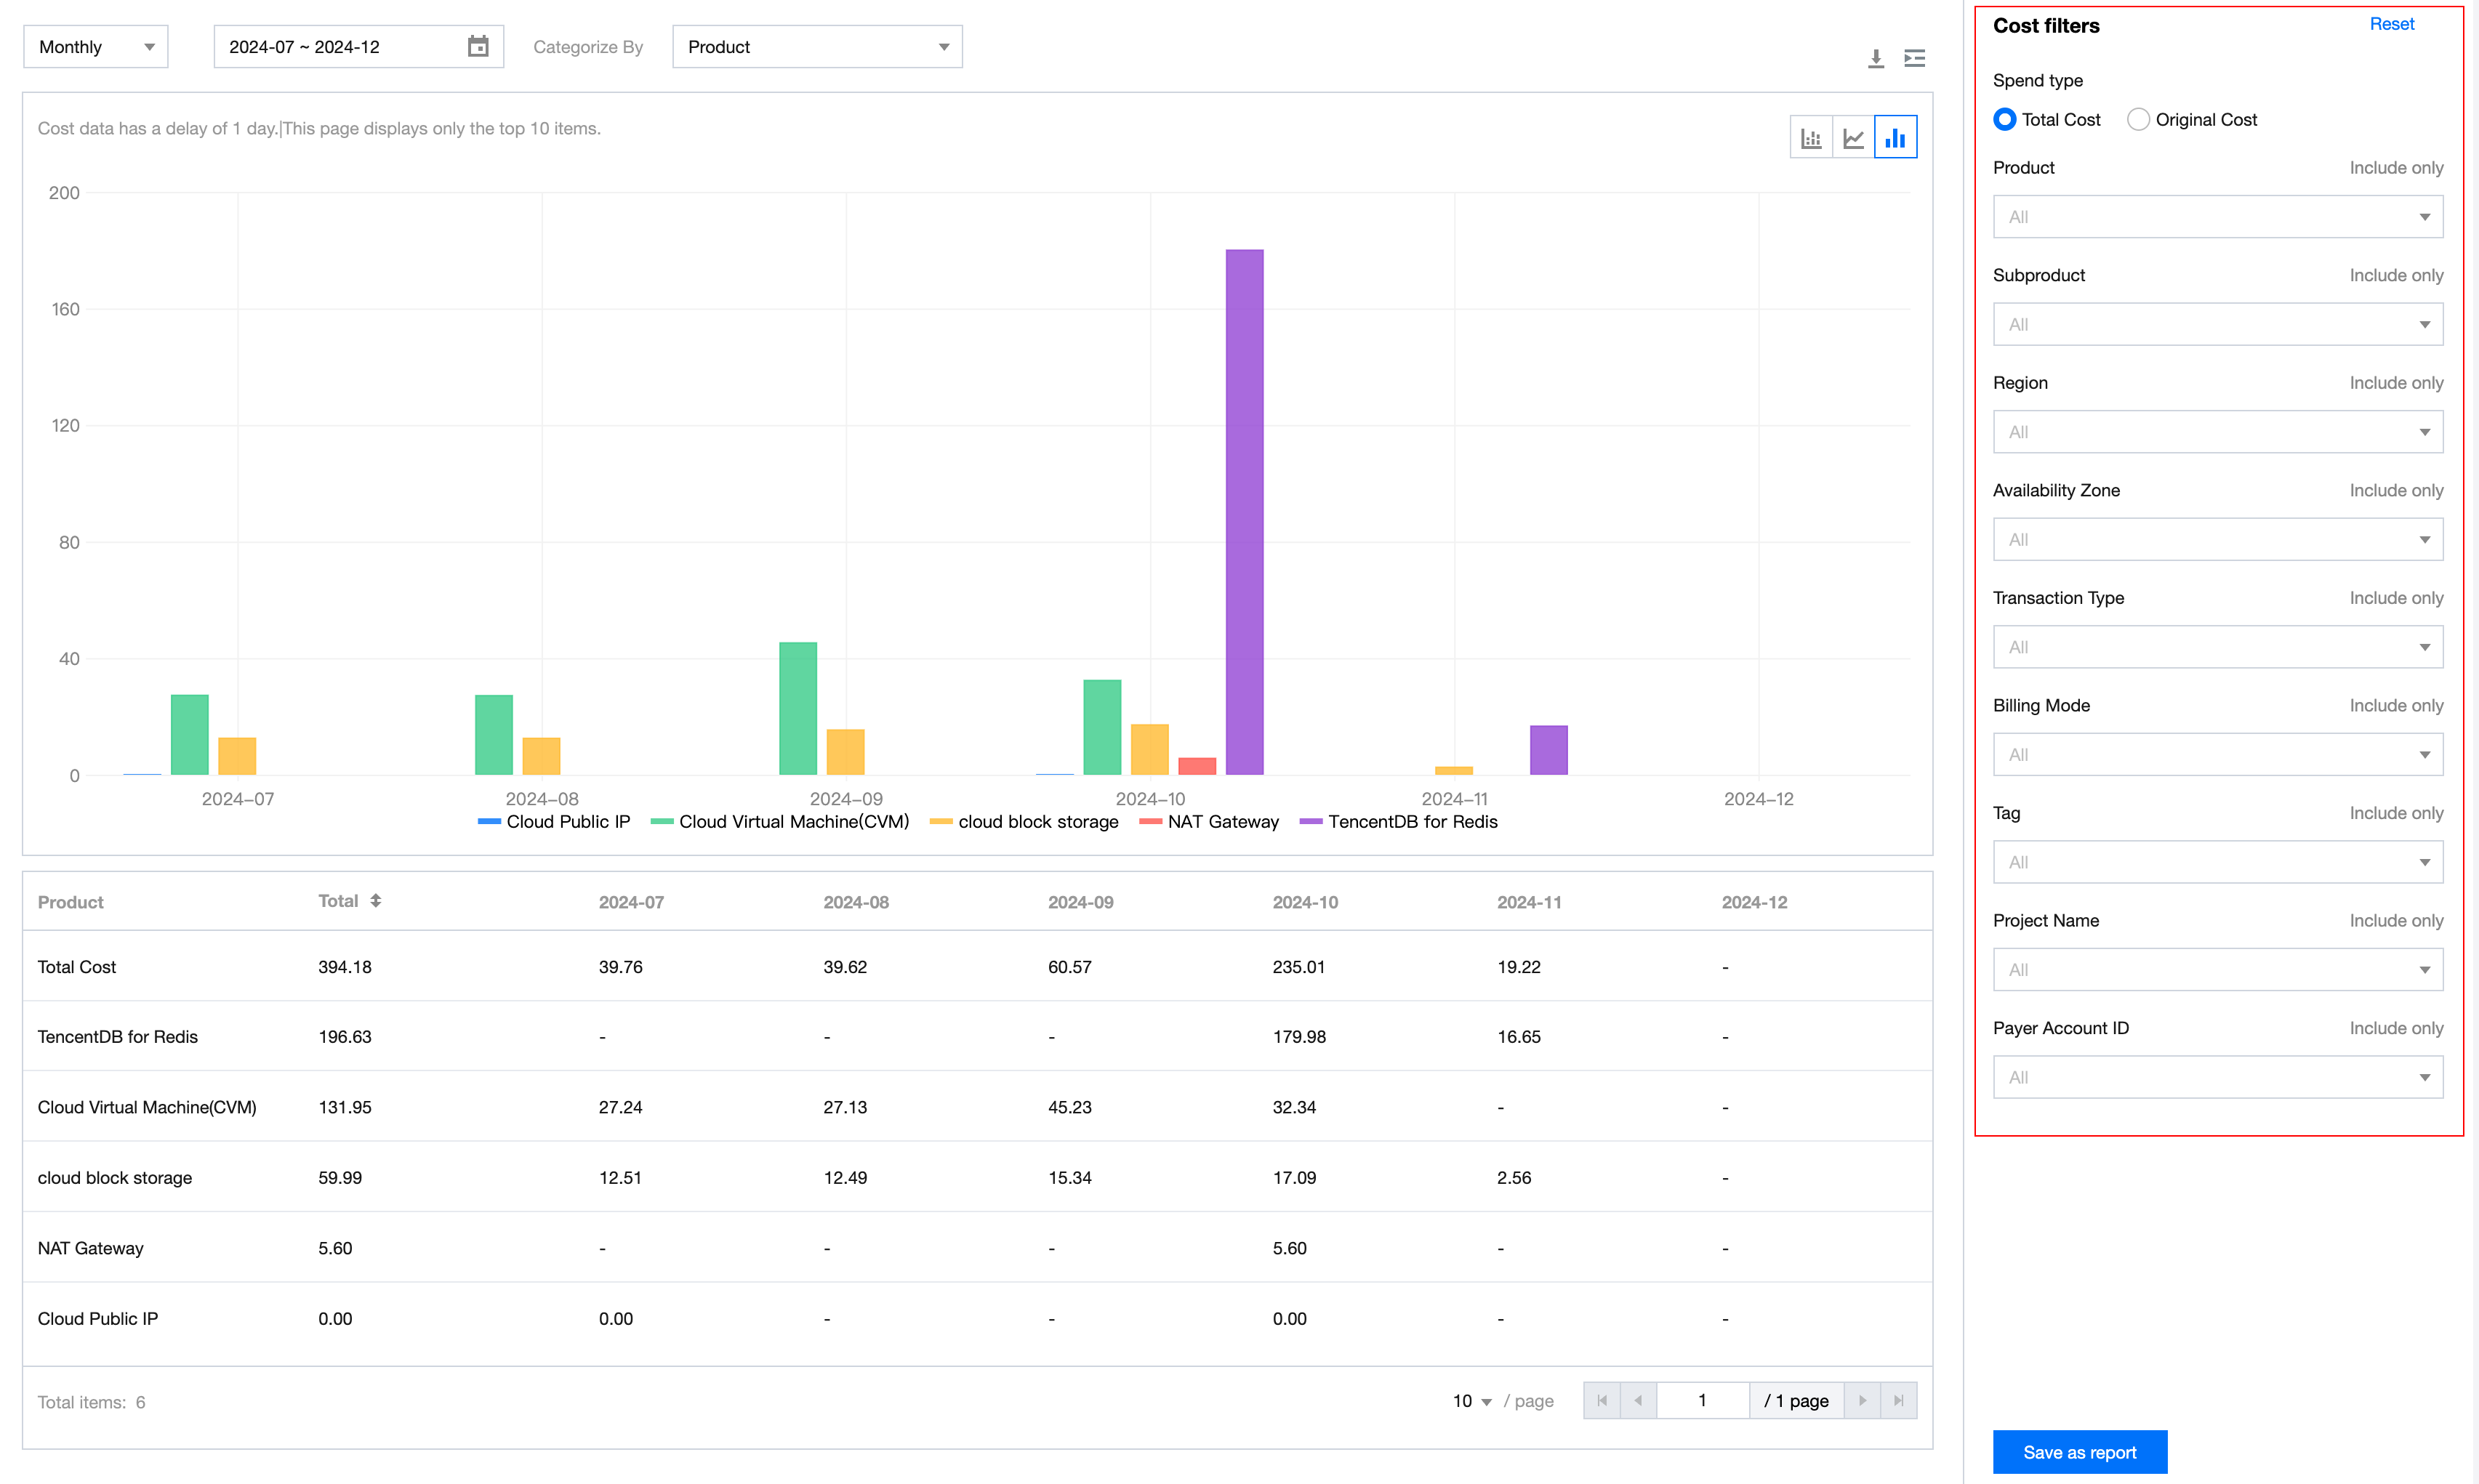
Cost filters
Cost filters are used to further narrow down the data scope across various dimensions. They support selecting or excluding multiple dimension values.
Filter options support: Cost Type (Total Amount, Original Price), Product, Sub-product, Component Type, Component Name, Resource ID, Region, AZ, Transaction Type, Billing Mode, Tag, Project, Payer UIN, Owner UIN.
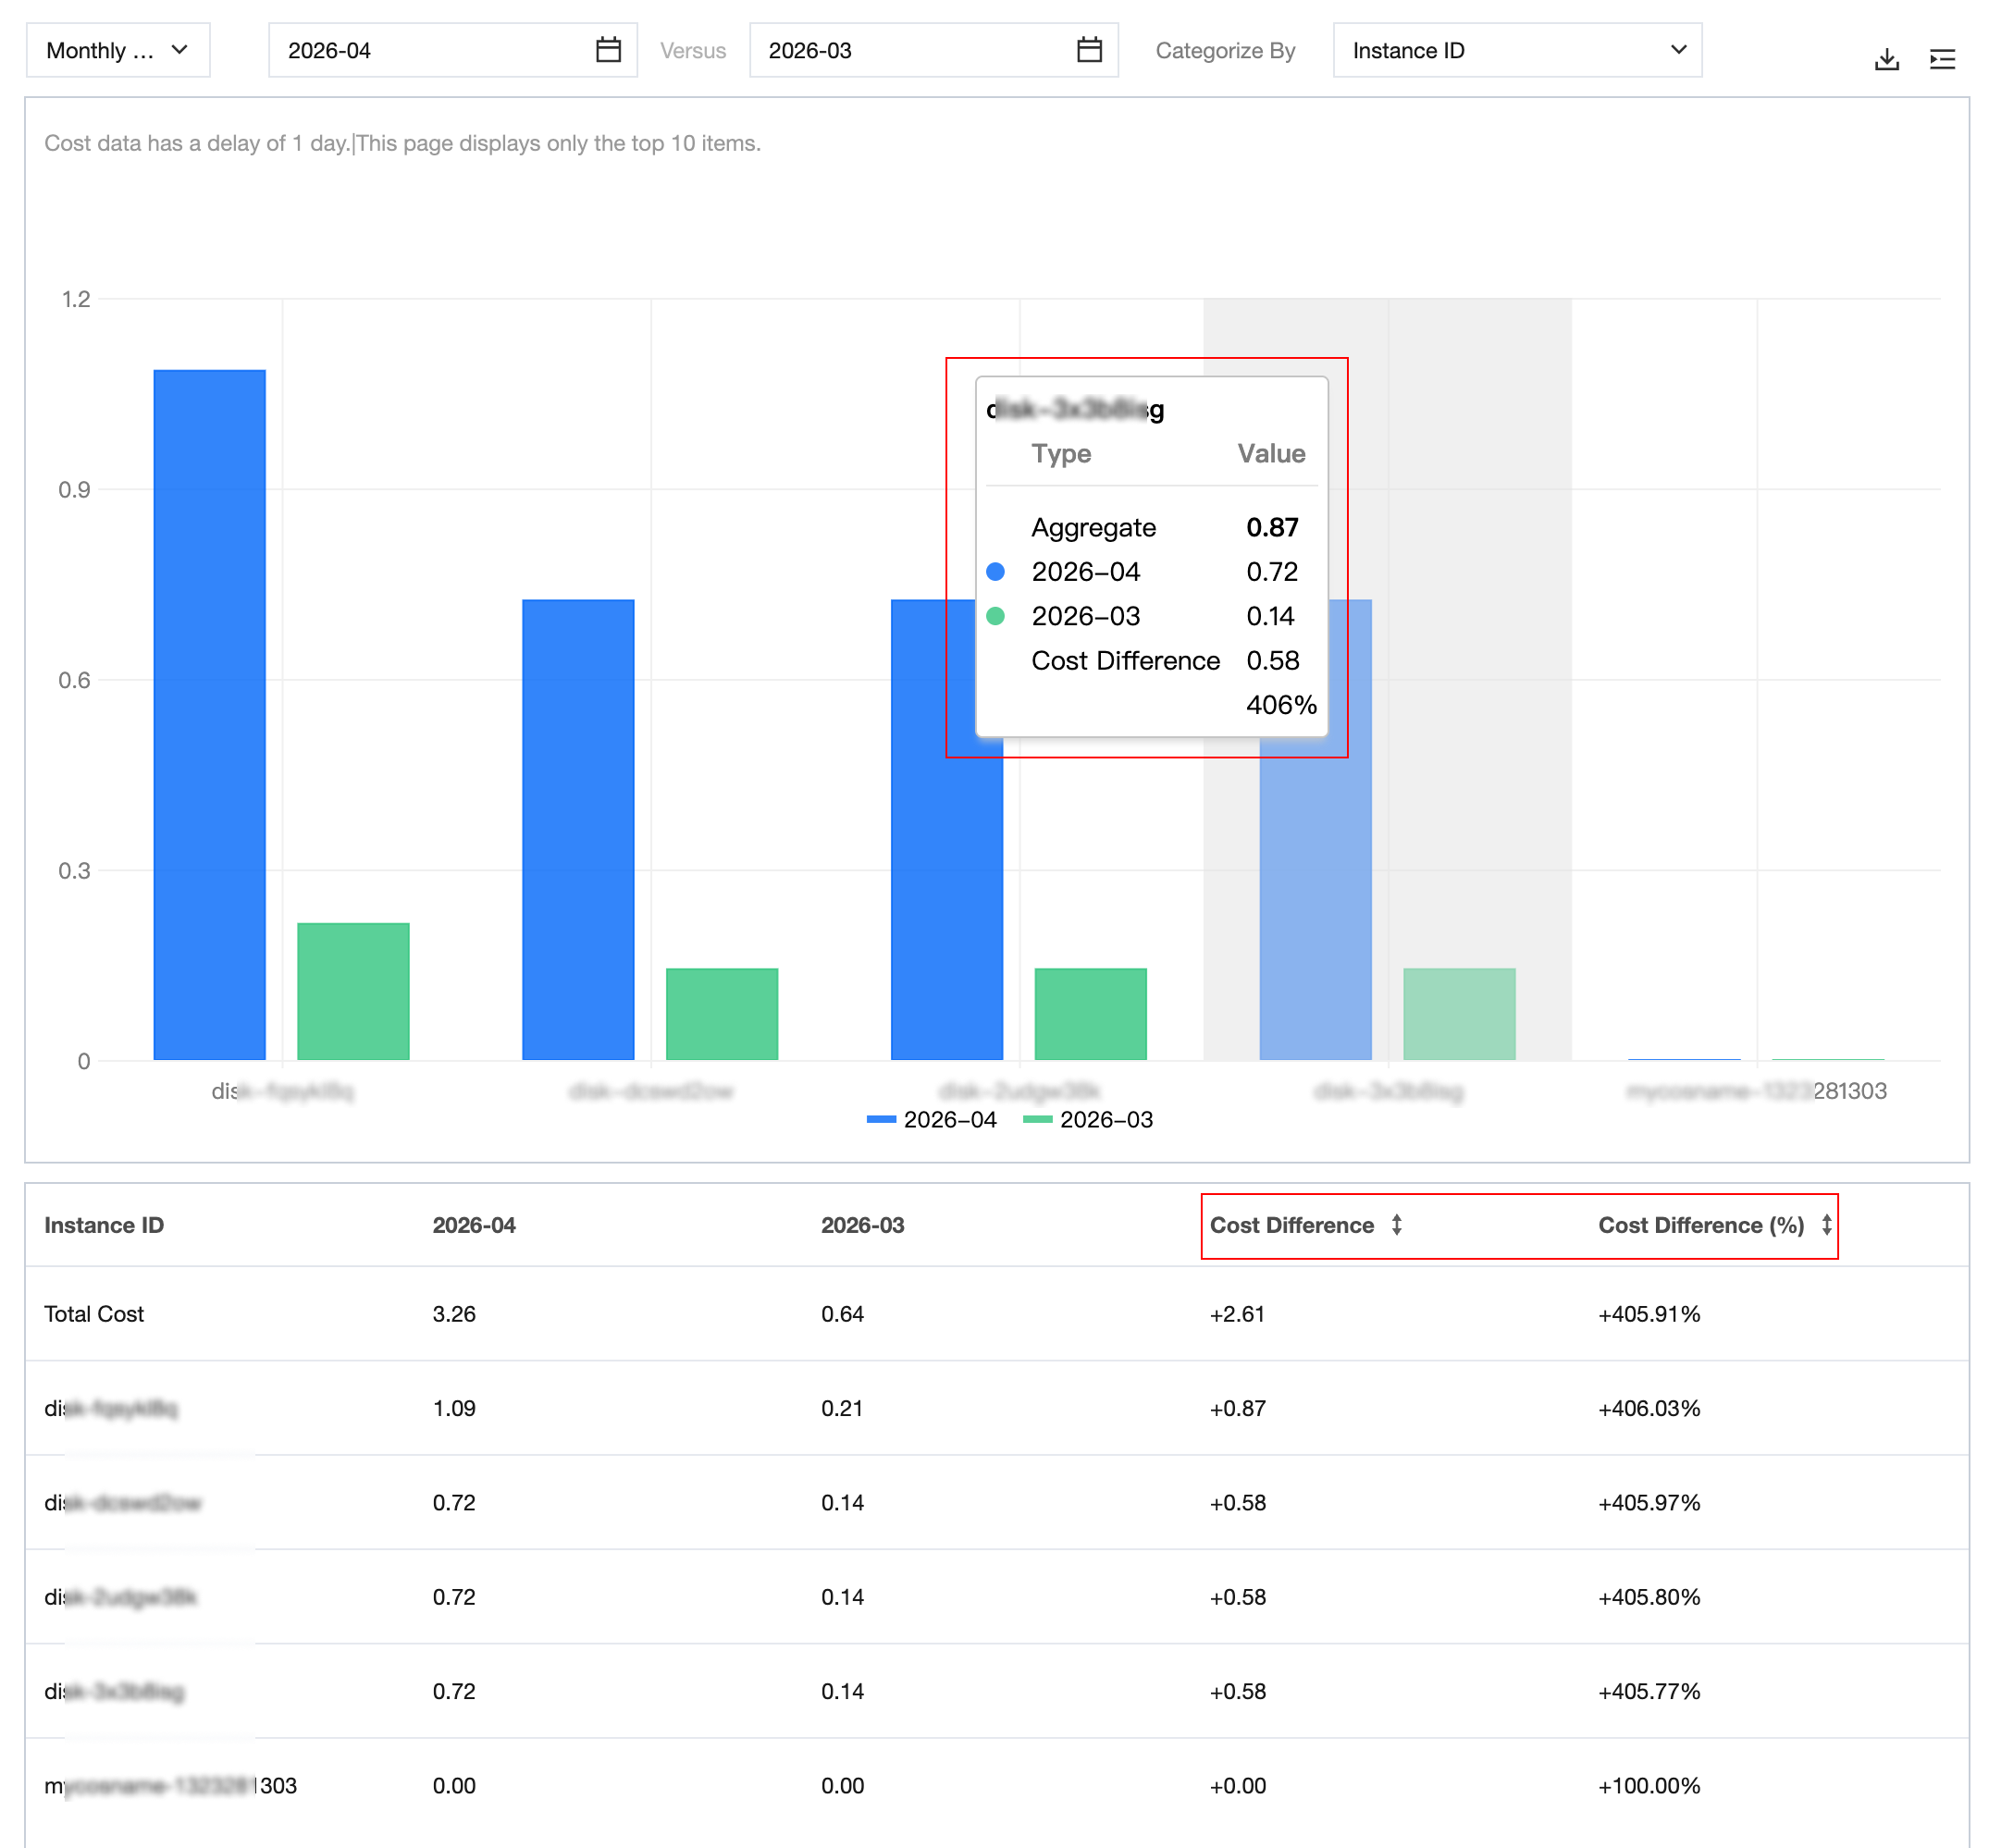
Monthly Compare Mode
In this mode, you can visually compare cost differences across any two months from different dimensions. Hover your mouse over the charts to view the two-month cost summary, cost difference value, and difference percentage.
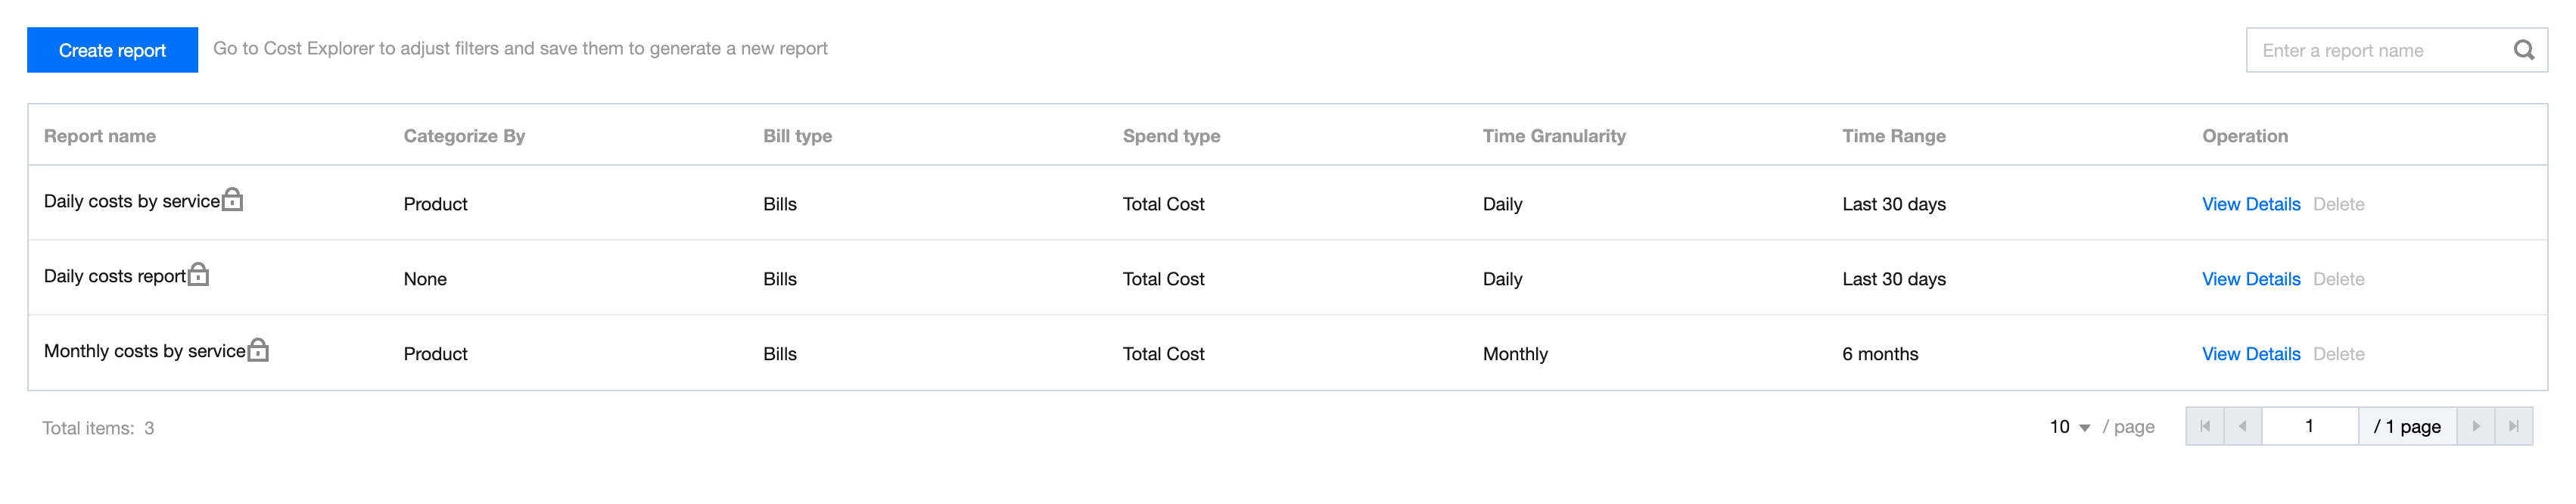
Cost Report
1. Click Save as report button on cost explorer page, input the report name and click Confirm to save the filter condition as a snapshoot.
2. Click Cost Management > Cost Report in the left sidebar to view the three presets cost report created by Tencent Cloud and your custom saved reports. Preset reports cannot be deleted.
フィードバック