Event Center provides unified management and display of Polaris (North Star) service state change events. You can view service state change details in Event Center, and you can also configure alarm notification rules for service events, helping you promptly identify and resolve issues.
The service event types currently supported by Polaris (North Star) include:
Start/Stop Instances
The instance returns to a healthy state.
The instance becomes abnormal.
Enable and disable instance isolation
Zero-Downtime Deployment Start, End
Zero-Downtime Warm-up Start, End
Zero-Downtime Decommission Start
Process termination
Circuit breaking triggered, recovered
Circuit breaking to half-open
Rate limiting recovered, recovered
This document describes how to view service event details and configure event alarm rules in the TSF console.
Prerequisite
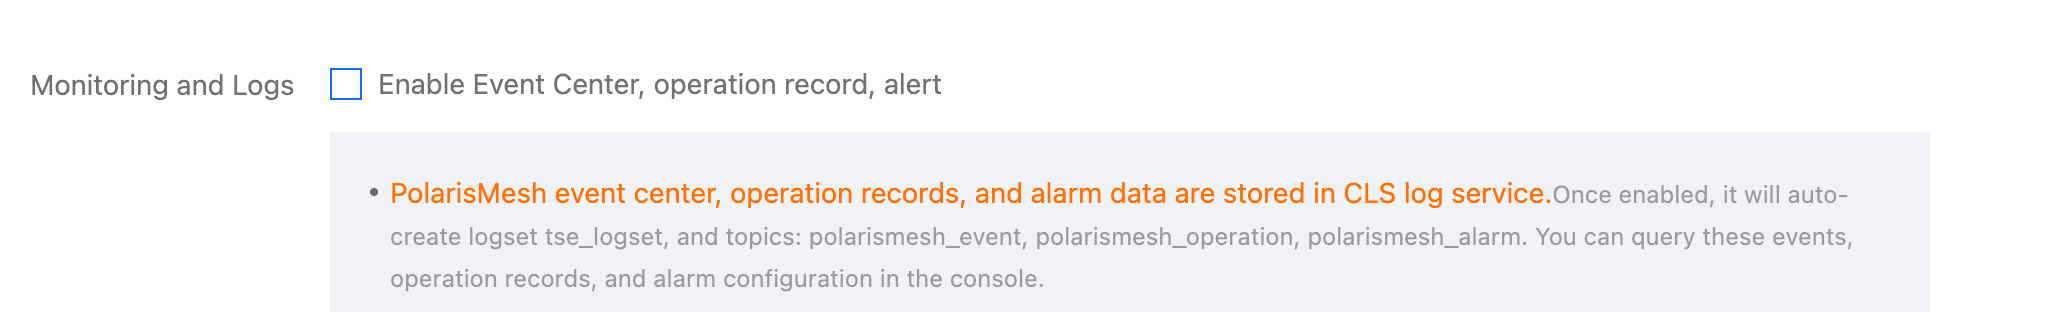
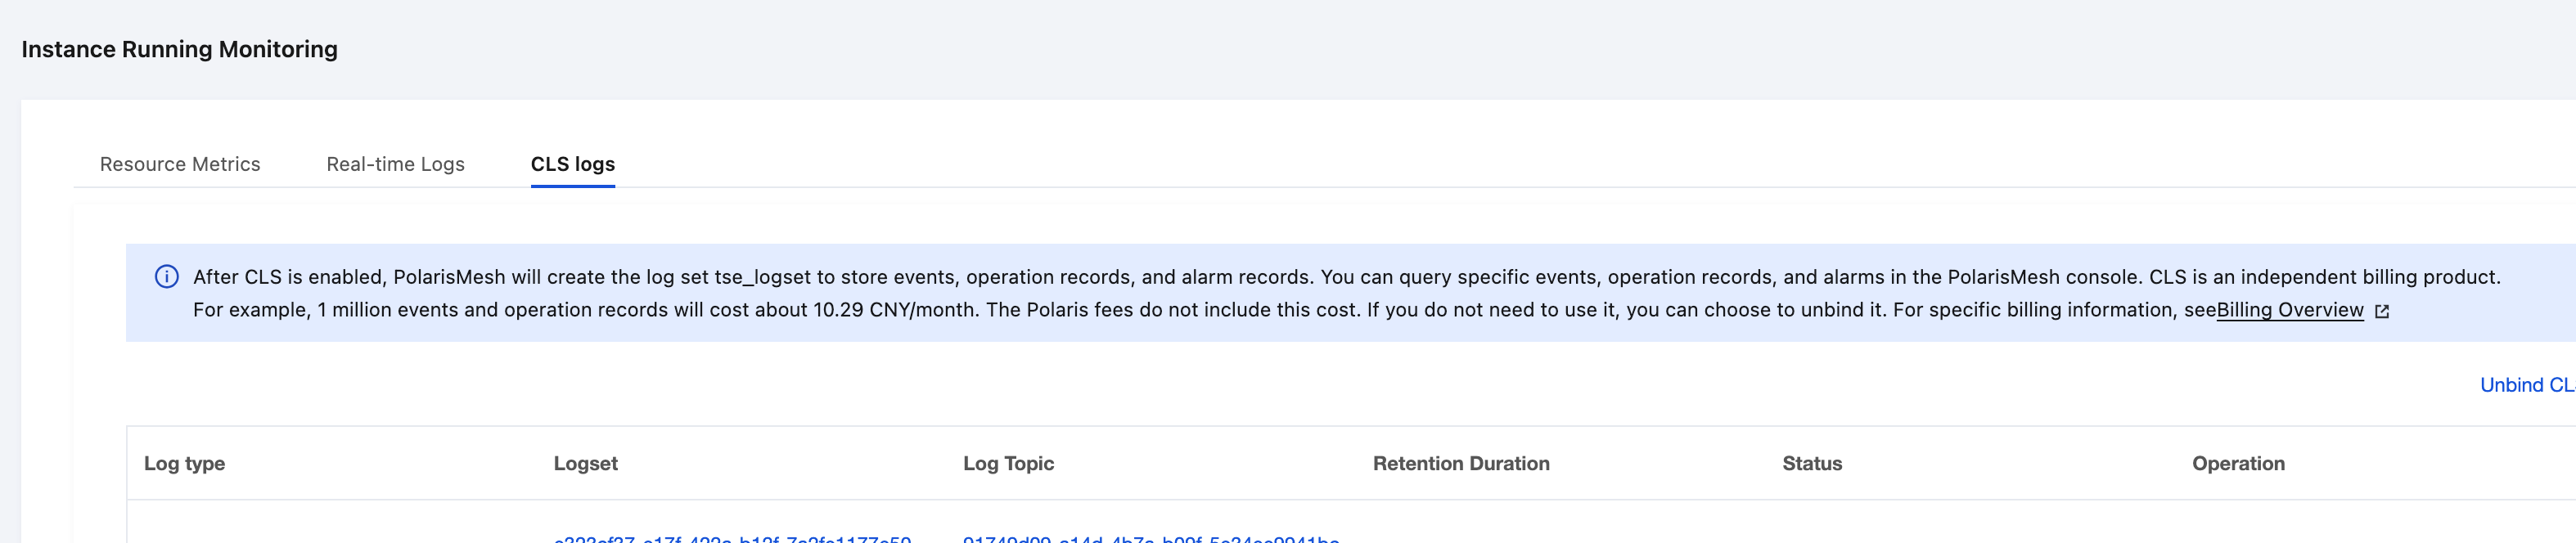
The Polaris (North Star) Event Center, operation records, and alarm data are stored in the CLS log service. Before using this capability, you need to enable it in Polaris. After the capability is enabled, the log set tse_logset and topics: polarismesh_event, polarismesh_operation, and polarismesh_alarm will be automatically created. You can query these events, operation records, and alarm configurations in the console.
The options for enabling are as follows; choose any one:
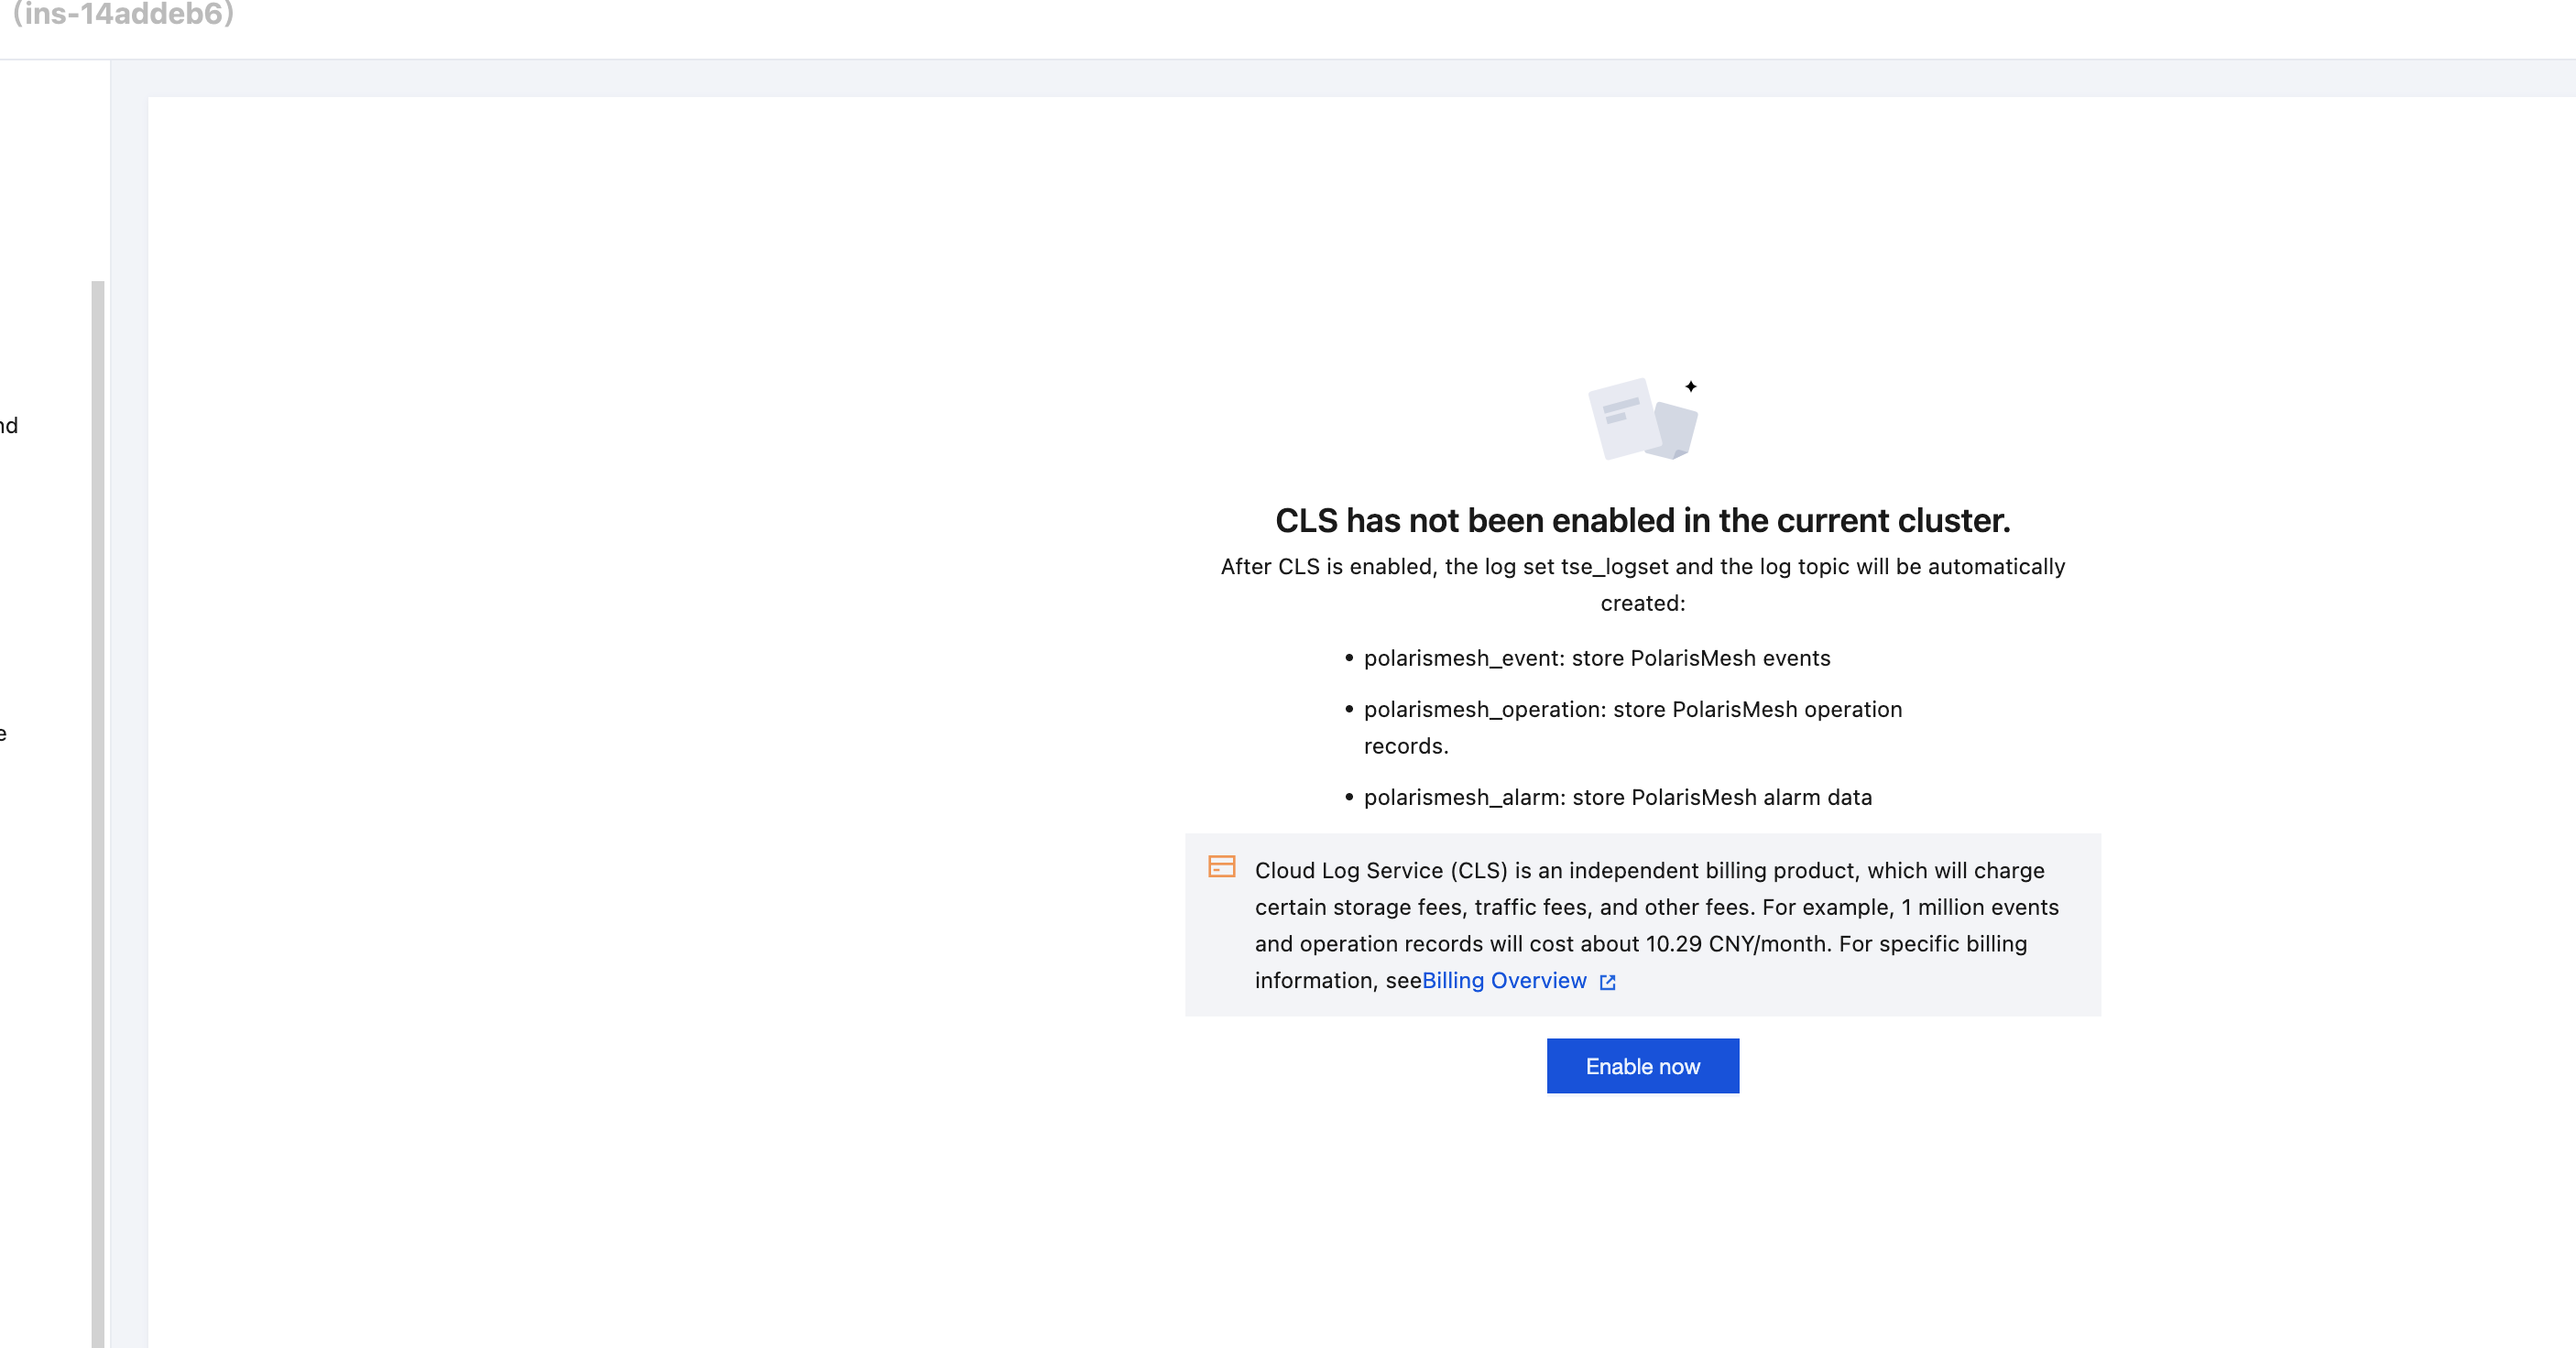
Option 2: Directly enable it on the Event Center page. Log in to the Tencent Service Framework (TSF) console. On the engine instance list page, click the "ID" of the target engine to go to the basic information page. In the top tab, select Event Center and click Enable Now.
After an engine instance is created, in the left sidebar, click the target engine instance list to go to the details page. Then, in the left tab bar, choose Engine Management > Runtime Logs > CLS Logs, and click the Enable Now button to enable the CLS log service.
2. On the engine instance list page, click the "ID" of the target engine to go to the basic information page.
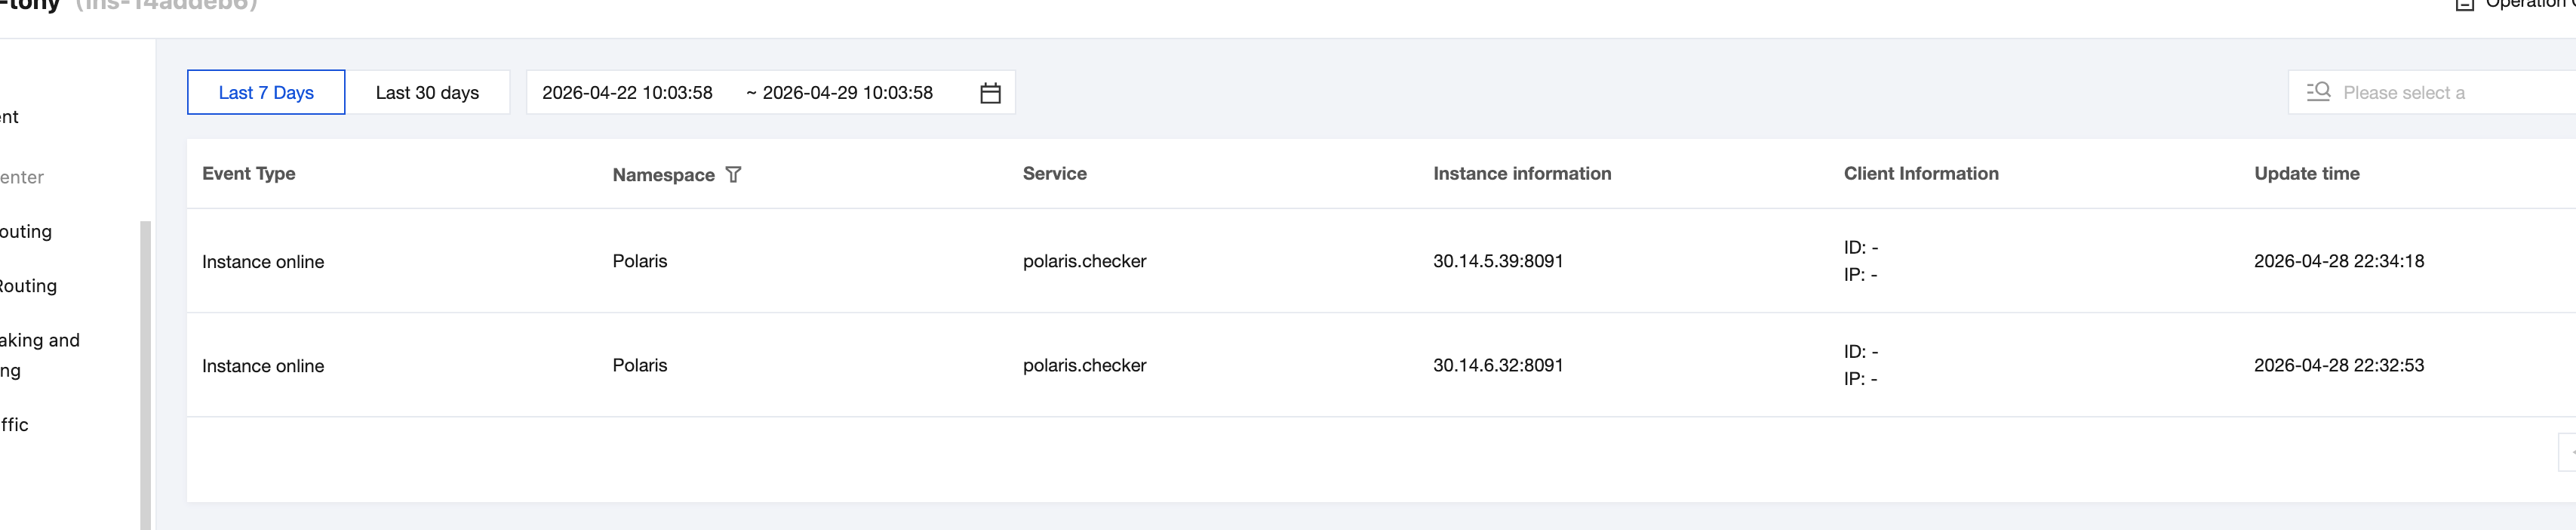
3. In the top tab, select Event Center, choose a time range (supporting last 7 days, last 30 days, and custom time ranges), and view details of occurred events, including the instance IP address of the service where the event occurred and the time of occurrence.
2. On the engine instance list page, click the "ID" of the target engine to go to the basic information page.
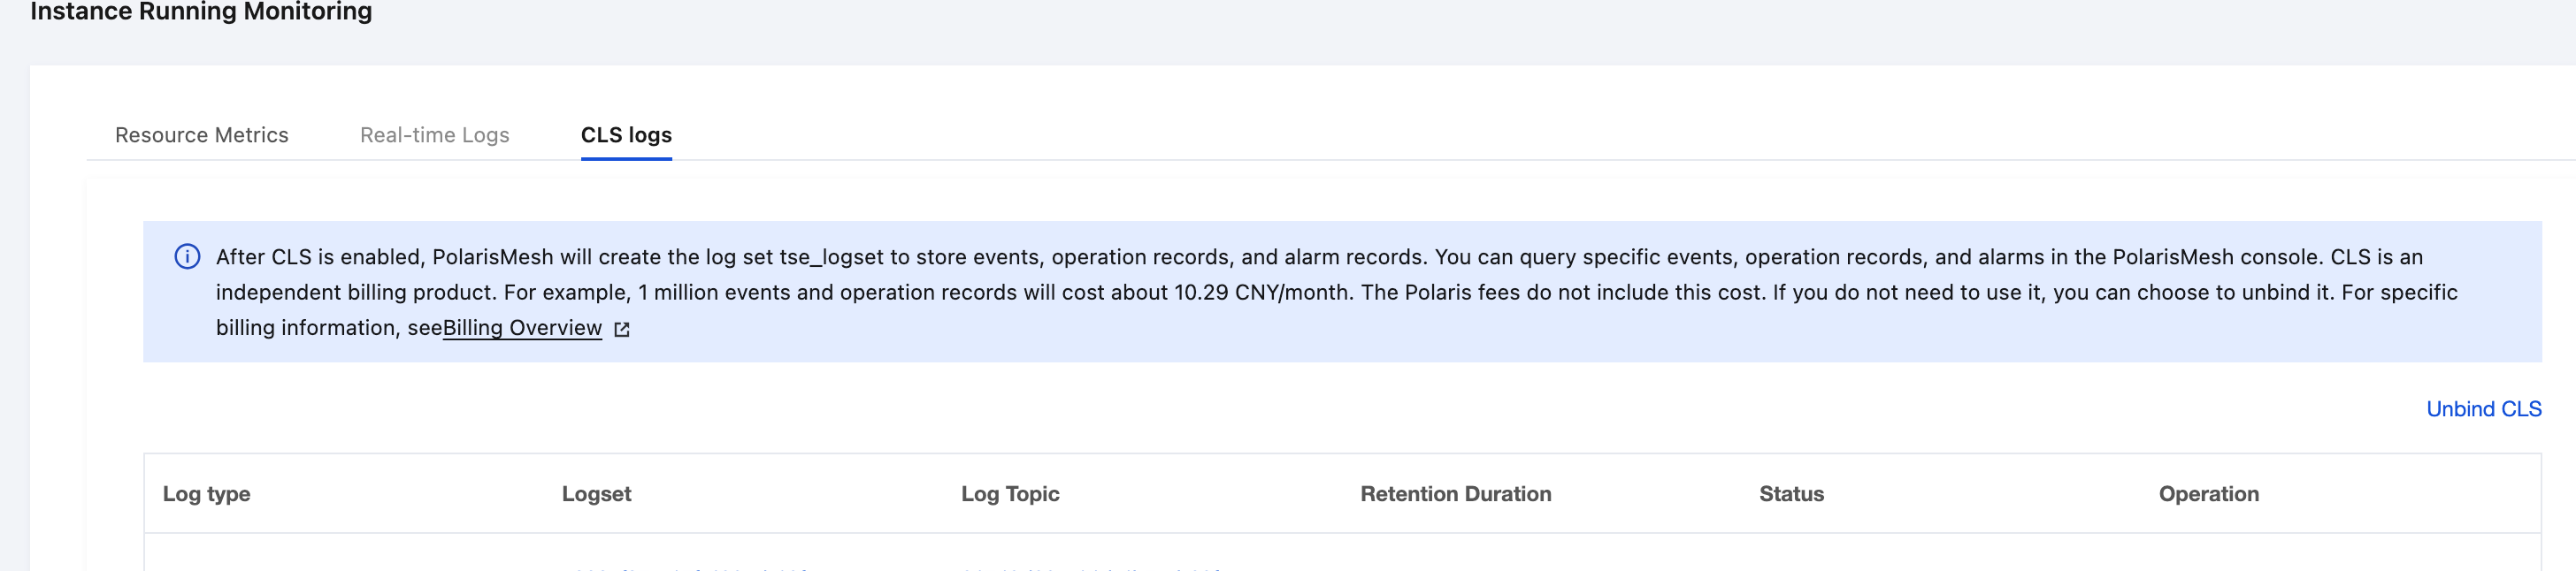
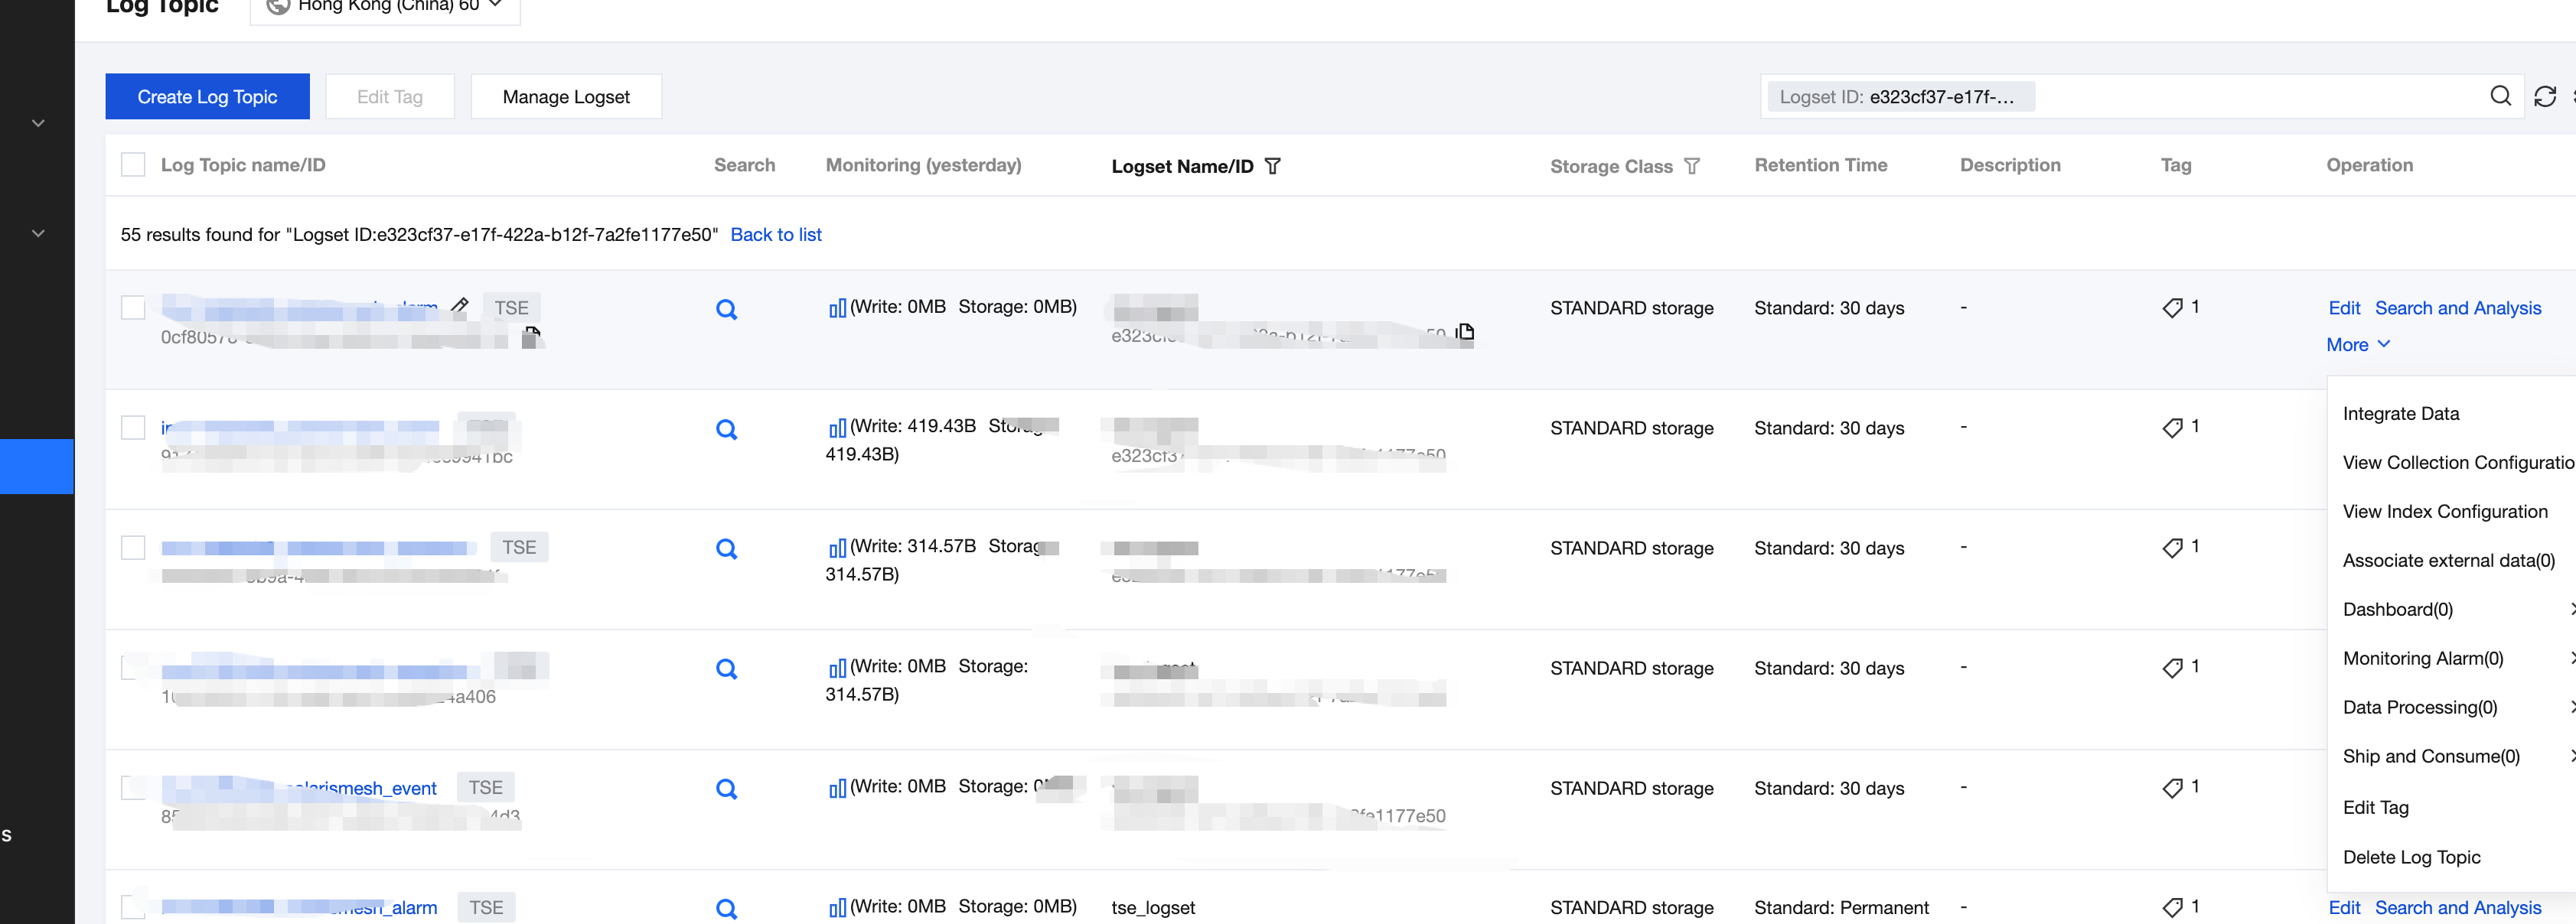
3. In the top tab, select Runtime Logs, and select CLS Logs.
4. Select the log type as "Event" corresponding to logset, and go to the CLS console.
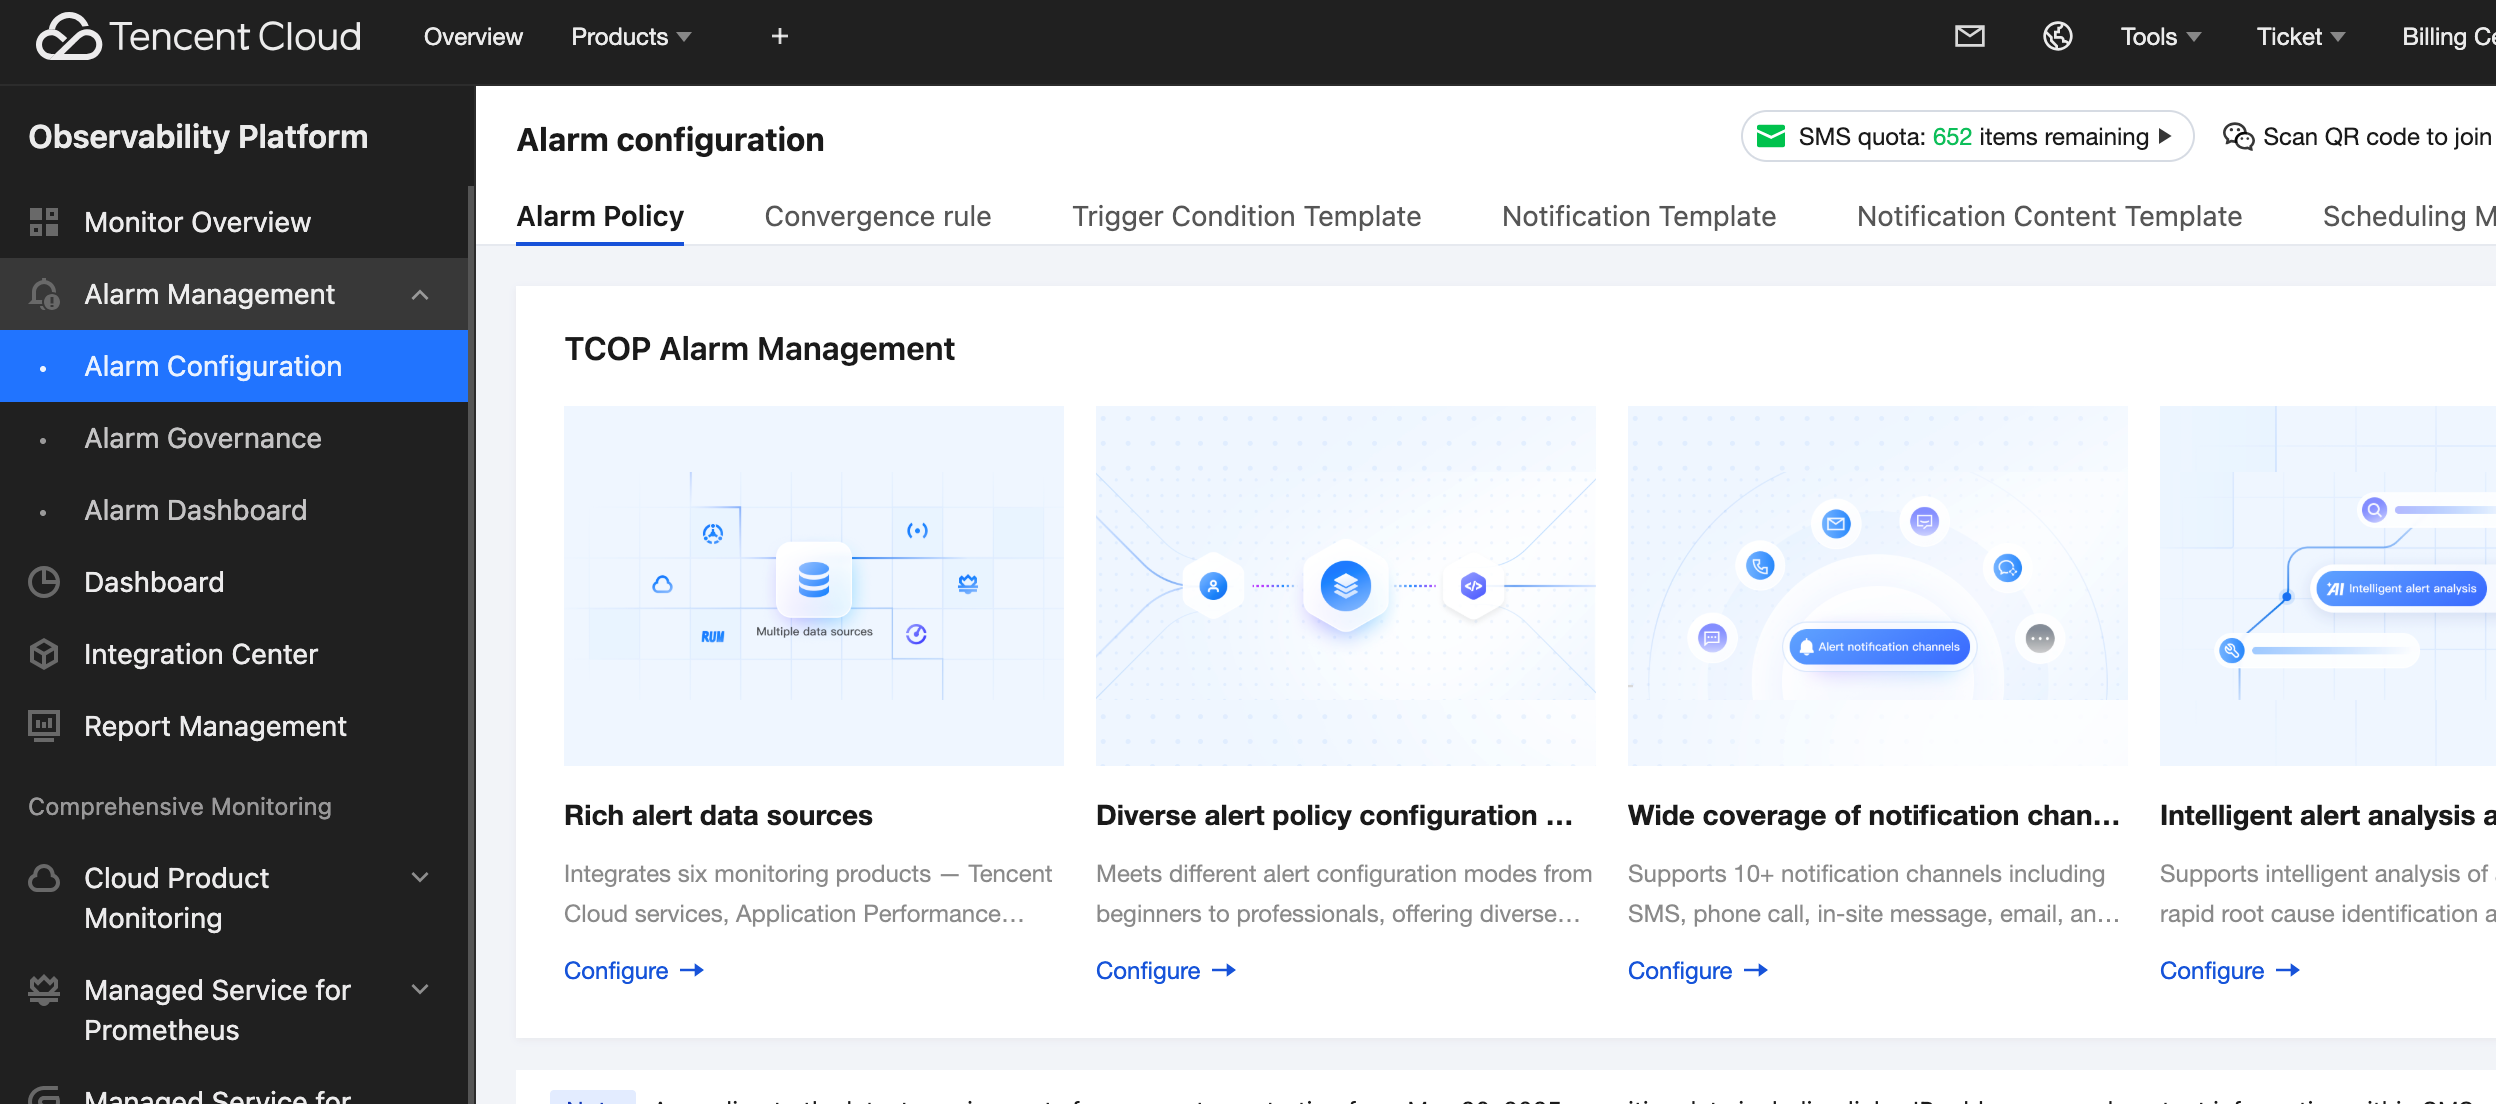
5. Go to the CLS console to configure the alarm policy.
6. Select the log topic with the suffix "polarismesh_even" in the log topic name. In the Operation column, click More and select: Monitoring Advanced - Create New Alarm Policy.
7. On the Create Alarm Policy page, configure the alarm policy. For details, see CLS - Configuring Alarm Policies to configure the alarm policy.
The event_type corresponding to each event is as follows: