tencent cloud

Tencent Cloud Observability Platform

Release Notes and Announcements
Release Notes
Product Introduction
Overview
Strengths
Basic Features
Basic Concepts
Use Cases
Use Limits
Purchase Guide
Tencent Cloud Product Monitoring
Application Performance Management
Mobile App Performance Monitoring
Real User Monitoring
Cloud Automated Testing
Prometheus Monitoring
Grafana
EventBridge
PTS
Quick Start
Monitoring Overview
Instance Group
Tencent Cloud Product Monitoring
Application Performance Management
Real User Monitoring
Cloud Automated Testing
Performance Testing Service
Prometheus Getting Started
Grafana
Dashboard Creation
EventBridge
Alarm Service
Cloud Product Monitoring
Tencent Cloud Service Metrics
Operation Guide
CVM Agents
Cloud Product Monitoring Integration with Grafana
Troubleshooting
Practical Tutorial
Application Performance Management
Product Introduction
Access Guide
Operation Guide
Practical Tutorial
Parameter Information
FAQs
Mobile App Performance Monitoring
Overview
Operation Guide
Access Guide
Practical Tutorial
Tencent Cloud Real User Monitoring
Product Introduction
Operation Guide
Connection Guide
FAQs
Cloud Automated Testing
Product Introduction
Operation Guide
FAQs
Performance Testing Service
Overview
Operation Guide
Practice Tutorial
JavaScript API List
FAQs
Prometheus Monitoring
Product Introduction
Access Guide
Operation Guide
Practical Tutorial
Terraform
FAQs
Grafana
Product Introduction
Operation Guide
Guide on Grafana Common Features
FAQs
Dashboard
Overview
Operation Guide
Alarm Management
Console Operation Guide
Troubleshooting
FAQs
EventBridge
Product Introduction
Operation Guide
Practical Tutorial
FAQs
Report Management
FAQs
General
Alarm Service
Concepts
Monitoring Charts
CVM Agents
Dynamic Alarm Threshold
CM Connection to Grafana
Documentation Guide
Related Agreements
Application Performance Management Service Level Agreement
APM Privacy Policy
APM Data Processing And Security Agreement
RUM Service Level Agreement
Mobile Performance Monitoring Service Level Agreement
Cloud Automated Testing Service Level Agreement
Prometheus Service Level Agreement
TCMG Service Level Agreements
PTS Service Level Agreement
PTS Use Limits
Cloud Monitor Service Level Agreement
API Documentation
History
Introduction
API Category
Making API Requests
Monitoring Data Query APIs
Alarm APIs
Legacy Alert APIs
Notification Template APIs
TMP APIs
Grafana Service APIs
Event Center APIs
TencentCloud Managed Service for Prometheus APIs
Monitoring APIs
Data Types
Error Codes
Glossary

Dashboard

PDF
フォーカスモード
フォントサイズ
最終更新日: 2024-01-27 17:45:42
This document describes the use cases of and the operations directions for dashboards.

Use Cases

Dashboard: is applicable to percentage metrics such as the CPU utilization, memory usage, and disk utilization.
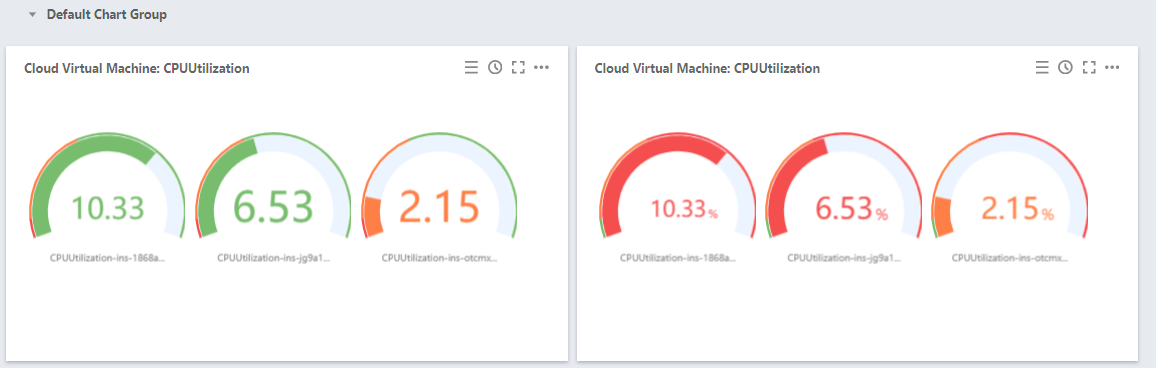
Dashboard configuration effects:


Directions

1. Log in to the Tencent Cloud Observability Platform console and click Dashboard > Default Dashboard on the left sidebar.
2. Click

> Create Chart to go to the chart editing page.
3. In the chart configuration module, select dashboard as the chart type.
4. Configure the dashboard information.

Chart elements

Statistical mode: indicates the metric statistical mode, which can be the current value, the minimum value, the maximum value, the average value, and the sum.
Unit: indicates whether to display the unit of the statistical value. For more information on the meanings of different units, see List of Units.
Precision: indicates the number of decimal places to be retained for the metric statistical value. 0: do not retain decimals. 1: retain one decimal place.

Threshold

Threshold: indicates the thresholds for colors. Format: <Numerical value>,<Numerical value>. For example, if you enter "50,80" in this field, it means that the displayed color of the metric will be green when the metric value is less than 50, orange if the metric value is equal to or greater than 50 but less than 80, and red if the metric value is equal to or greater than 80.
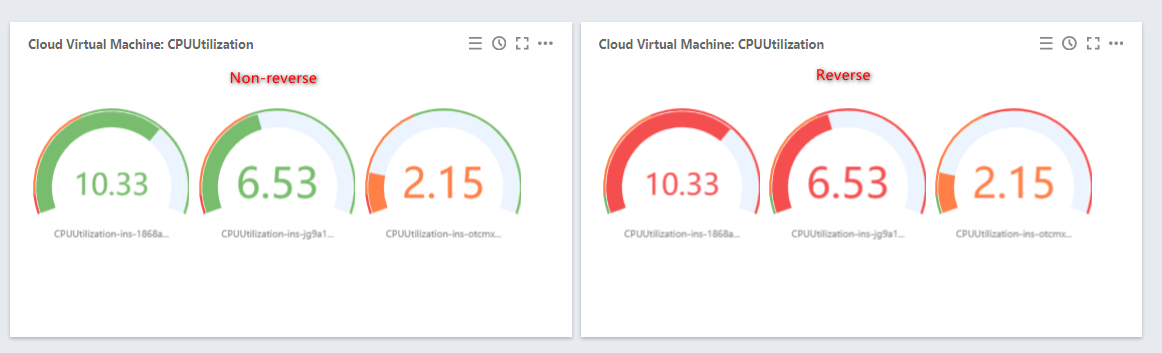
Color: indicates the color sequence. For example, set the "Threshold” field to "50,80".

Non-reverse cases:

If the metric value is less than 50, display green.
If the metric value is equal to or greater than 50 but less than 80, display orange.
If the metric value is equal to or greater than 80, display red.

Reverse cases:

If the metric value is less than 50, display red.
If the metric value is equal to or greater than 50 but less than 80, display orange.
If the metric value is equal to or greater than 80, display green.

507aff74e6af82b156abeb830f60ea19.png


Min, Max: indicates the minimum and maximum values displayed on the dashboard.
Show Threshold: indicates whether to display the threshold for each color on the dashboard.


ヘルプとサポート

この記事はお役に立ちましたか?

フィードバック