A monitoring and alarming system is indispensable for a business production environment. When a failure occurs, a complete monitoring and alarming link is required to push the alarm message in real time and handle the alarm.
Tencent Cloud EventBridge is a secure, stable, and efficient serverless event management platform. EventBridge in Event Center can receive real-time events and relevant data streams from your applications, SaaS services, and Tencent Cloud services. By integrating notification message and SCF, it can send notifications by email, SMS, WeCom, DingTalk, Lark, and more.
Oceanus is a powerful enterprise-grade real-time big data analysis platform based on Apache Flink. It features one-stop development, seamless connection, millisecond-level latency, low costs, high security, and high stability, with the aim to maximize the value of enterprise data and accelerate the construction of real-time digital business capabilities.
By combining EventBridge and SCF, you can collect exception events in your Oceanus cluster and push them in real time. This document describes how to collect an Oceanus cluster status change event and send it to WeCom, DingTalk, and Lark.
Architecture Design
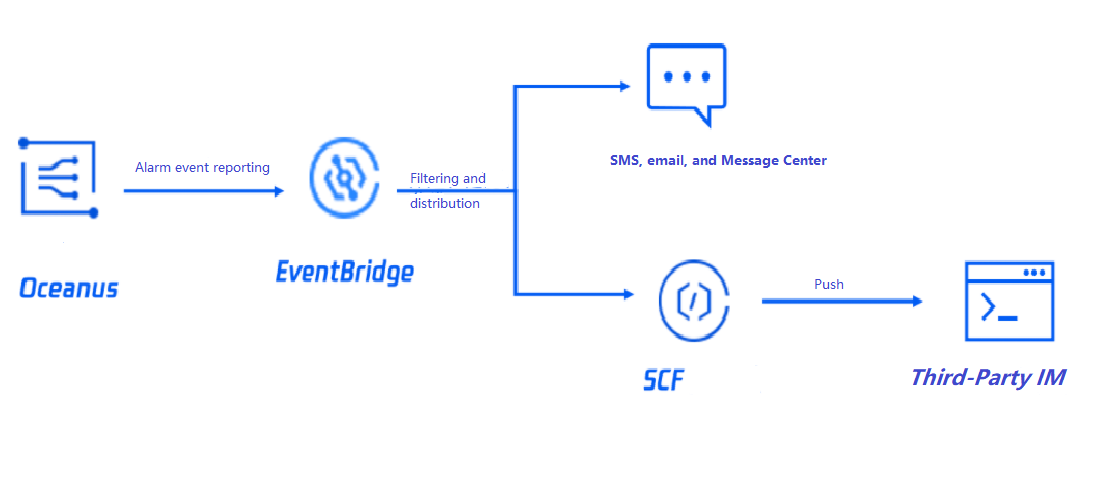
The overall architecture is as shown below. When the Oceanus status changes (for example, an instance gets exceptional, isolated, or disconnected), the Oceanus system will trigger an alarm and actively push it to EventBridge. Then, the alarm will be pushed to the specified target after being filtered by the alarm rules bound to EventBridge. It can also be pushed to more third-party services through SCF.
2. Click Create Event Rule in the Event Rule section.
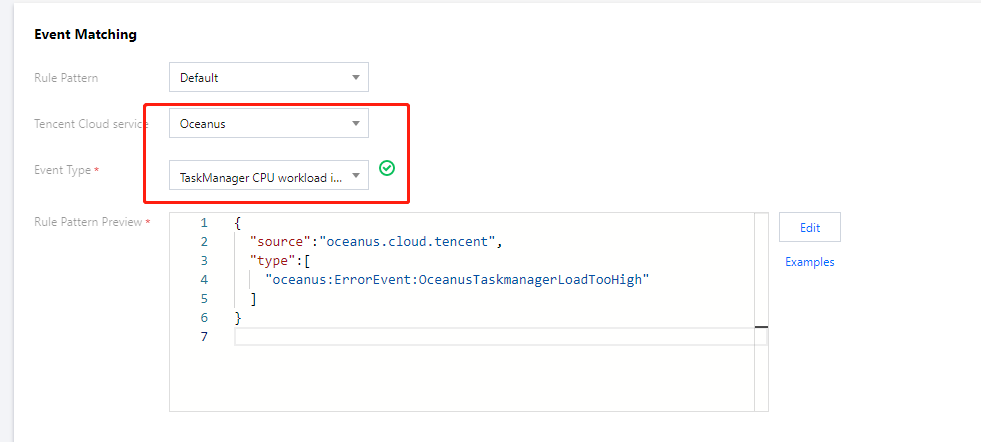
3. On the Create Event Rule > Event Matching page, configure the alarm rule.
This document uses the configuration of the TaskManager CPU workload is too high event alarm in Oceanus as an example. You can also select another event alarm or all events. For more information on event match rules, see Event Pattern.
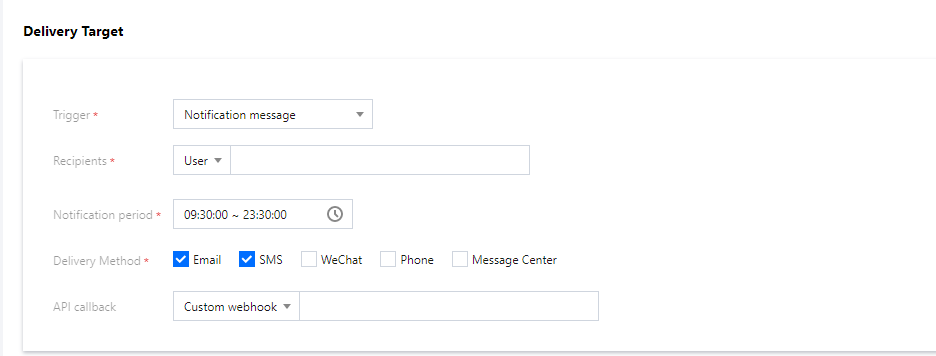
4. On the Create Event Rule > Delivery Target page, configure the push (delivery) target.
You can select a delivery target as needed. Here, two delivery targets of notification message and SCF are used as examples.
Notification message
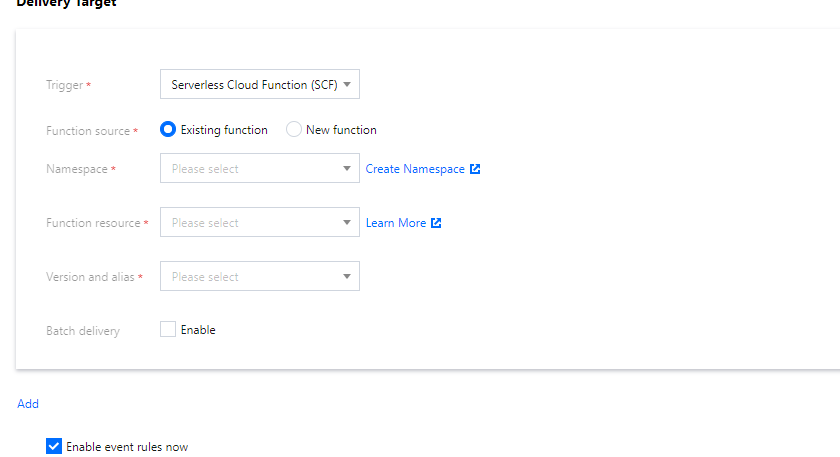
SCF
You can configure a notification message to push your alarm events in the specified delivery method to promptly reach users.
EventBridge allows you to use a webhook over the general HTTP protocol to directly deliver events. If your delivery target has strict requirements for the request format, you can use SCF to convert the format of the events to be delivered first, and then use EventBridge to directly send the original events to the specified function, so as to build a complete push link.
After completing the configuration, you can view and configure the push of alarm events in the EventBridge console.
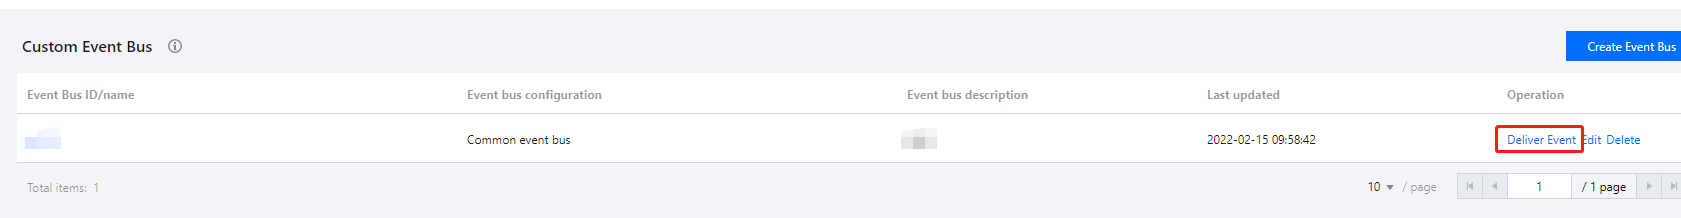
5. Test the alarm link in Event Bus.
Select a bound event bus and click Deliver Event as shown below:
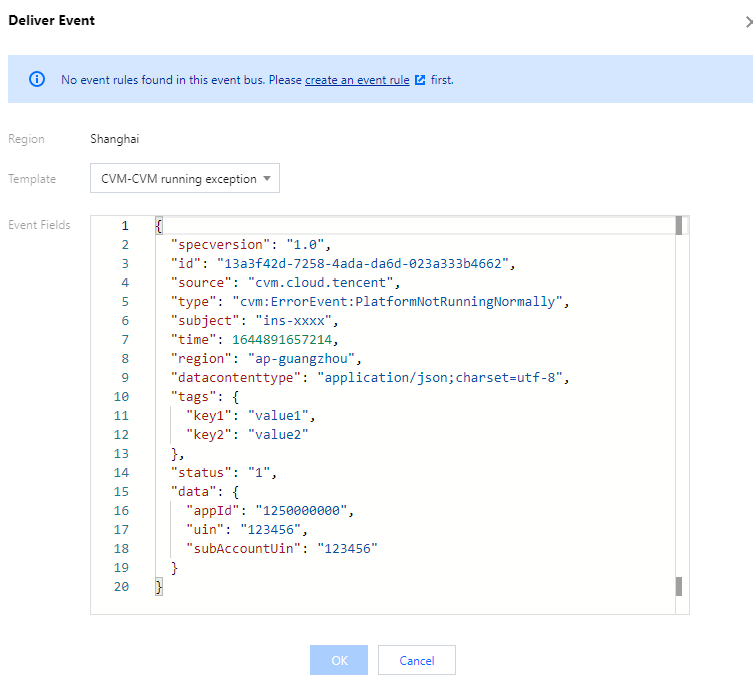
In the Deliver Event pop-up window, select a bound event rule template and click OK for test as shown below:
Note:
You can only modify the content in the data field in the test template, while other fields are fixed and cannot be customized.
6. After completing the configuration, you can view and manage the alarm rule in the EventBridge console.