The real-time session feature focuses on two key metrics: the CPU utilization of the database instance's Proxy node and the number of client connections. It dynamically displays the trends of these metrics while continuously tracking data such as database sessions, access sources, and active connections. Additionally, it supports killing sessions for the current Proxy or all Proxy nodes.
Through real-time sessions, Ops and management personnel can quickly identify the CPU utilization of the current session and efficiently locate logic issues about database session connections that are difficult to detect manually.
2. In the left sidebar, choose Performance Optimization.
3. At the top of the page, select Database Type as Distributed Cache, specify instance ID, and select Real-Time Session tab.
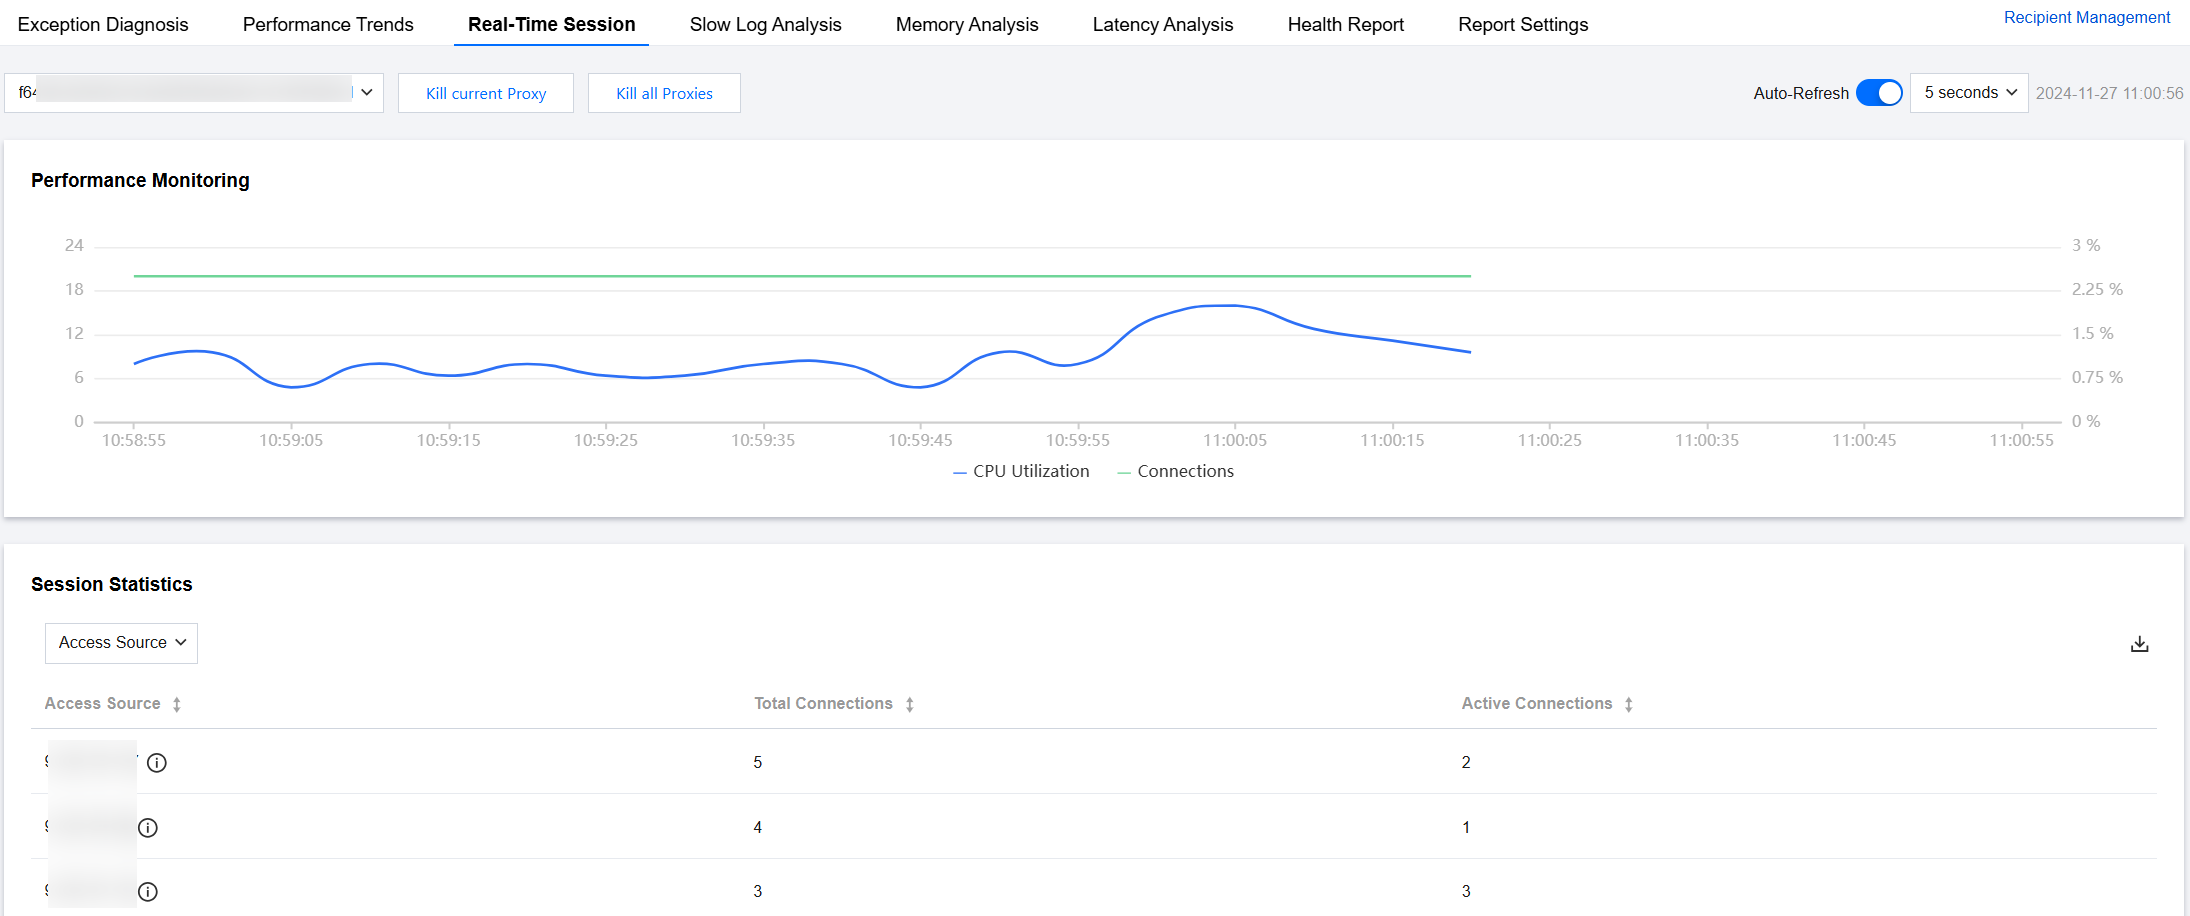
4. From the dropdown list in the upper left corner of the Performance Monitoring trend chart, you can select the CPU Utilization trend chart or Connections trend chart to select the Proxy ID to analyze.
Select the page refresh rate. Options include 5 seconds, 15 seconds, and 30 seconds, with a default value of 5 seconds. You can also stop refreshing.
5. View detailed real-time session data.
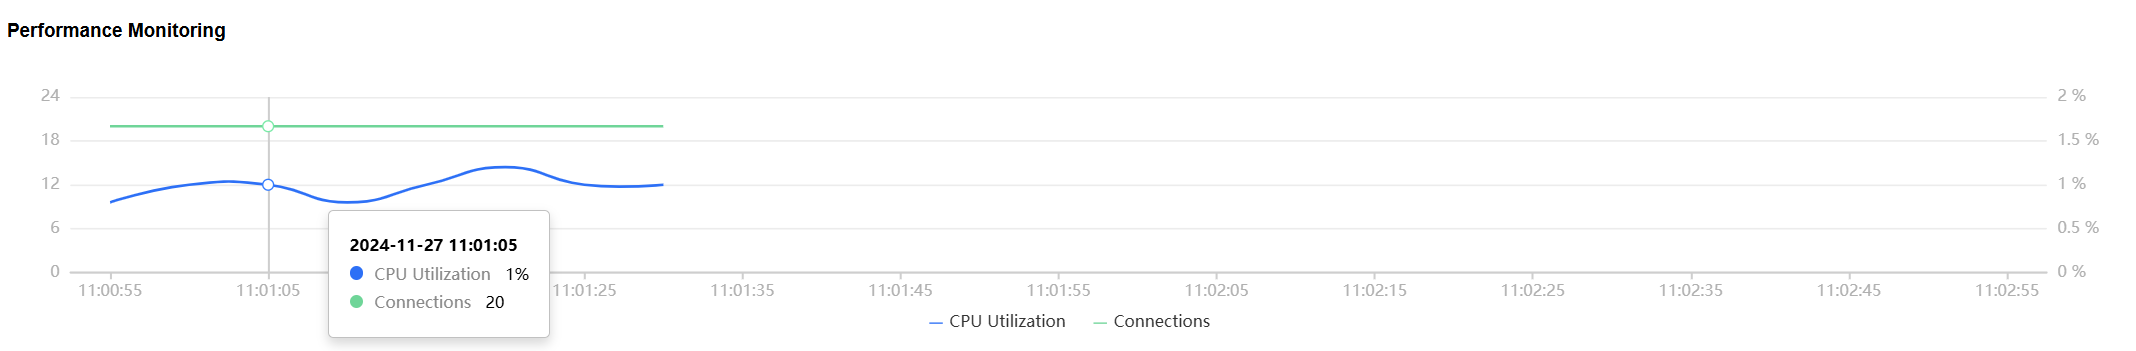
In the Performance Monitoring area, you can view the number of connections and CPU utilization trends of the selected Proxy node.
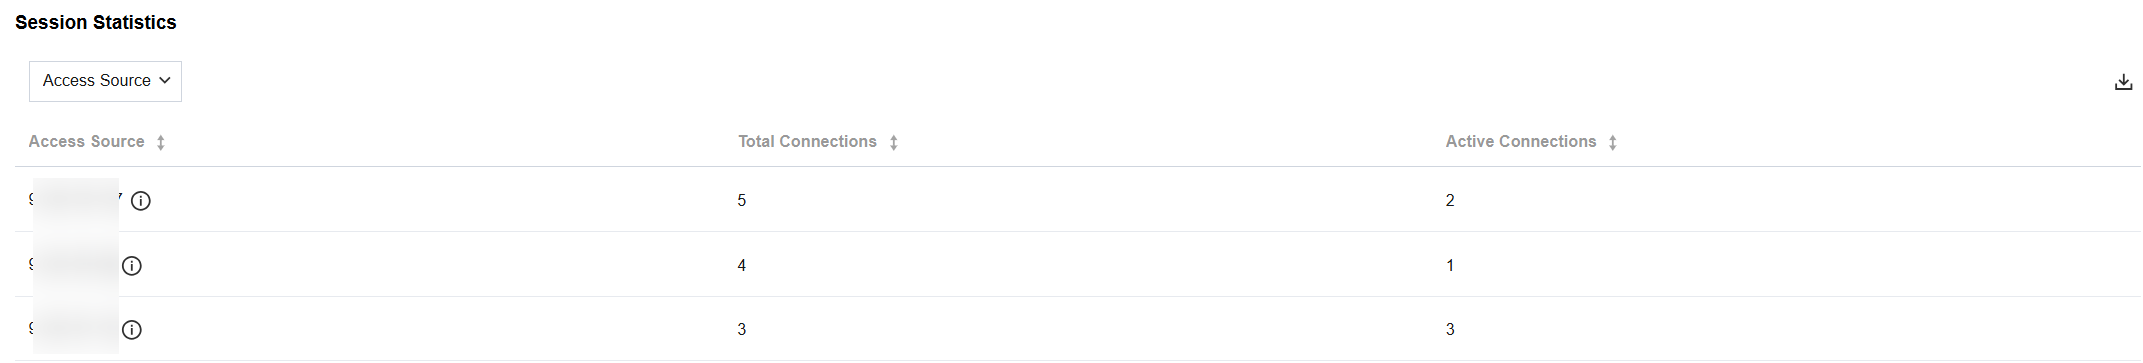
In the Session Statistics area, you can view the statistics of the current access sources, total connections, and active connections of the selected proxy node.
Killing Sessions
When you need to clear the client connections of the current Proxy or all Proxies of the selected Distributed Cache instance, restart, or clear unfinished tasks, use the Kill Session feature to forcibly close all client connections.
This operation is typically used in emergencies, such as long-term blocking or deadlocks, or when a system restart is required to recover data.
Note:
Killing sessions will interrupt ongoing operations and may cause data loss. Use with caution. Before using, back up data and assess risks.
Killing Current Proxy
At the top of the page, click Kill current Proxy. In the pop-up dialog box, click OK.
Killing All Proxies
At the top of the page, click Kill all Proxies. In the pop-up dialog box, clickOK.