Exception Diagnosis
Download
포커스 모드
폰트 크기
Feature Description
The exception diagnosis feature provides you with real-time performance monitoring, health inspections, and failure diagnosis and optimization, so that you can intuitively know the real-time operation status of database instances, locate newly appeared performance exceptions in real time, and optimize the system based on the optimization suggestions. Exception diagnosis provides real-time and historical view modes.
Overview
Log in to the DBbrain console and select Performance Optimization on the left sidebar. On the displayed page, select a database type and an instance at the top, and select the Exception Diagnosis tab.
Viewing Monitoring Information
View metric information
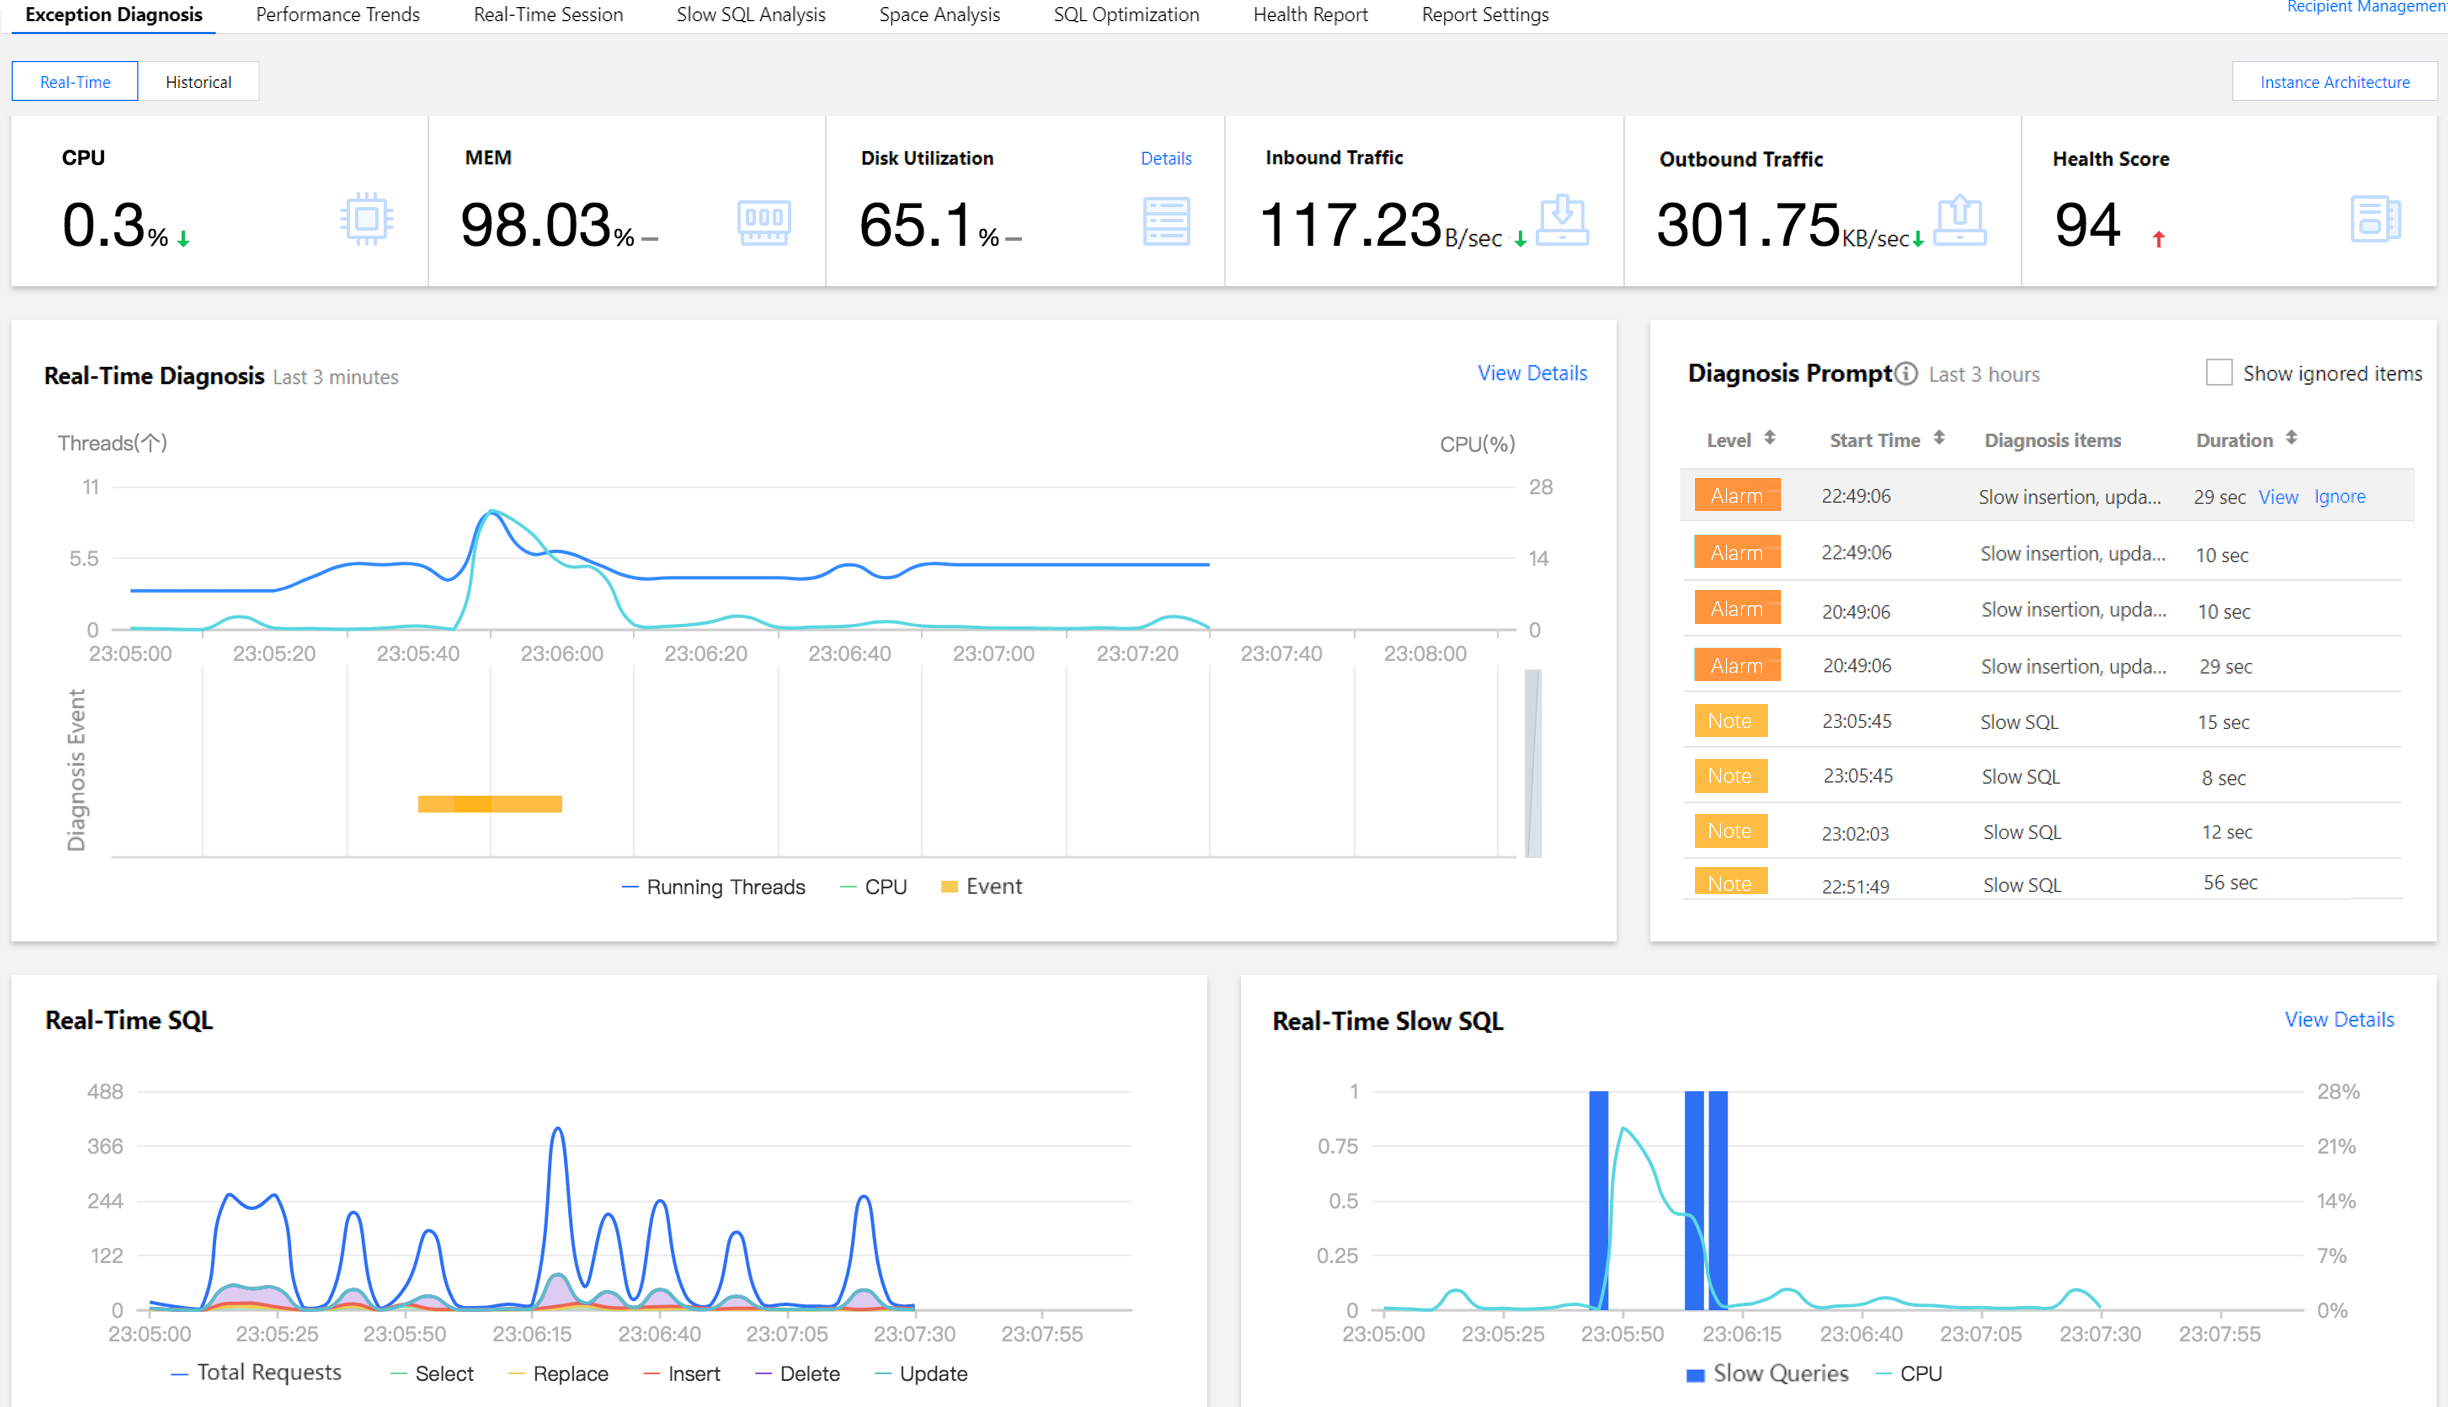
The Exception Diagnosis tab displays CPU, MEM, Disk Utilization, Outbound Traffic, and Health Score. To view details on disk utilization, click Details in the top-right corner. AI-based health scores can reflect the actual status of your databases.
View the instance architecture diagram
On the exception diagnosis page, select Real-time at the top of the page, and click Instance Architecture in the upper-right corner to view the instance's health score, runtime metrics, and 3D or planar views.
Note:
Only MySQL databases support viewing the instance architecture.
Viewing Diagnosis Information
The Real-Time Diagnosis or Diagnosis Records section displays the current instance's real-time or historical information about the number of running threads, CPU utilization, and diagnosis events.
The Diagnosis Prompt section displays the overview information of diagnosis event history, including Level (Healthy, Note, Alarm, Serious, or Critical), Start Time, Diagnosis items, and Duration. DBbrain performs health inspections on the instance once every ten minutes.
Viewing diagnosis details
1. Log in to the DBbrain console and select Performance Optimization on the left sidebar. On the displayed page, select a database type and an instance at the top, and select the Exception Diagnosis tab.
2. In the Real-Time Diagnosis or Diagnosis Records section, select a time range and zoom in the view by using the mouse wheel. You can click View Details or click an item in the Diagnosis Prompt section to enter the Diagnosis Details page.
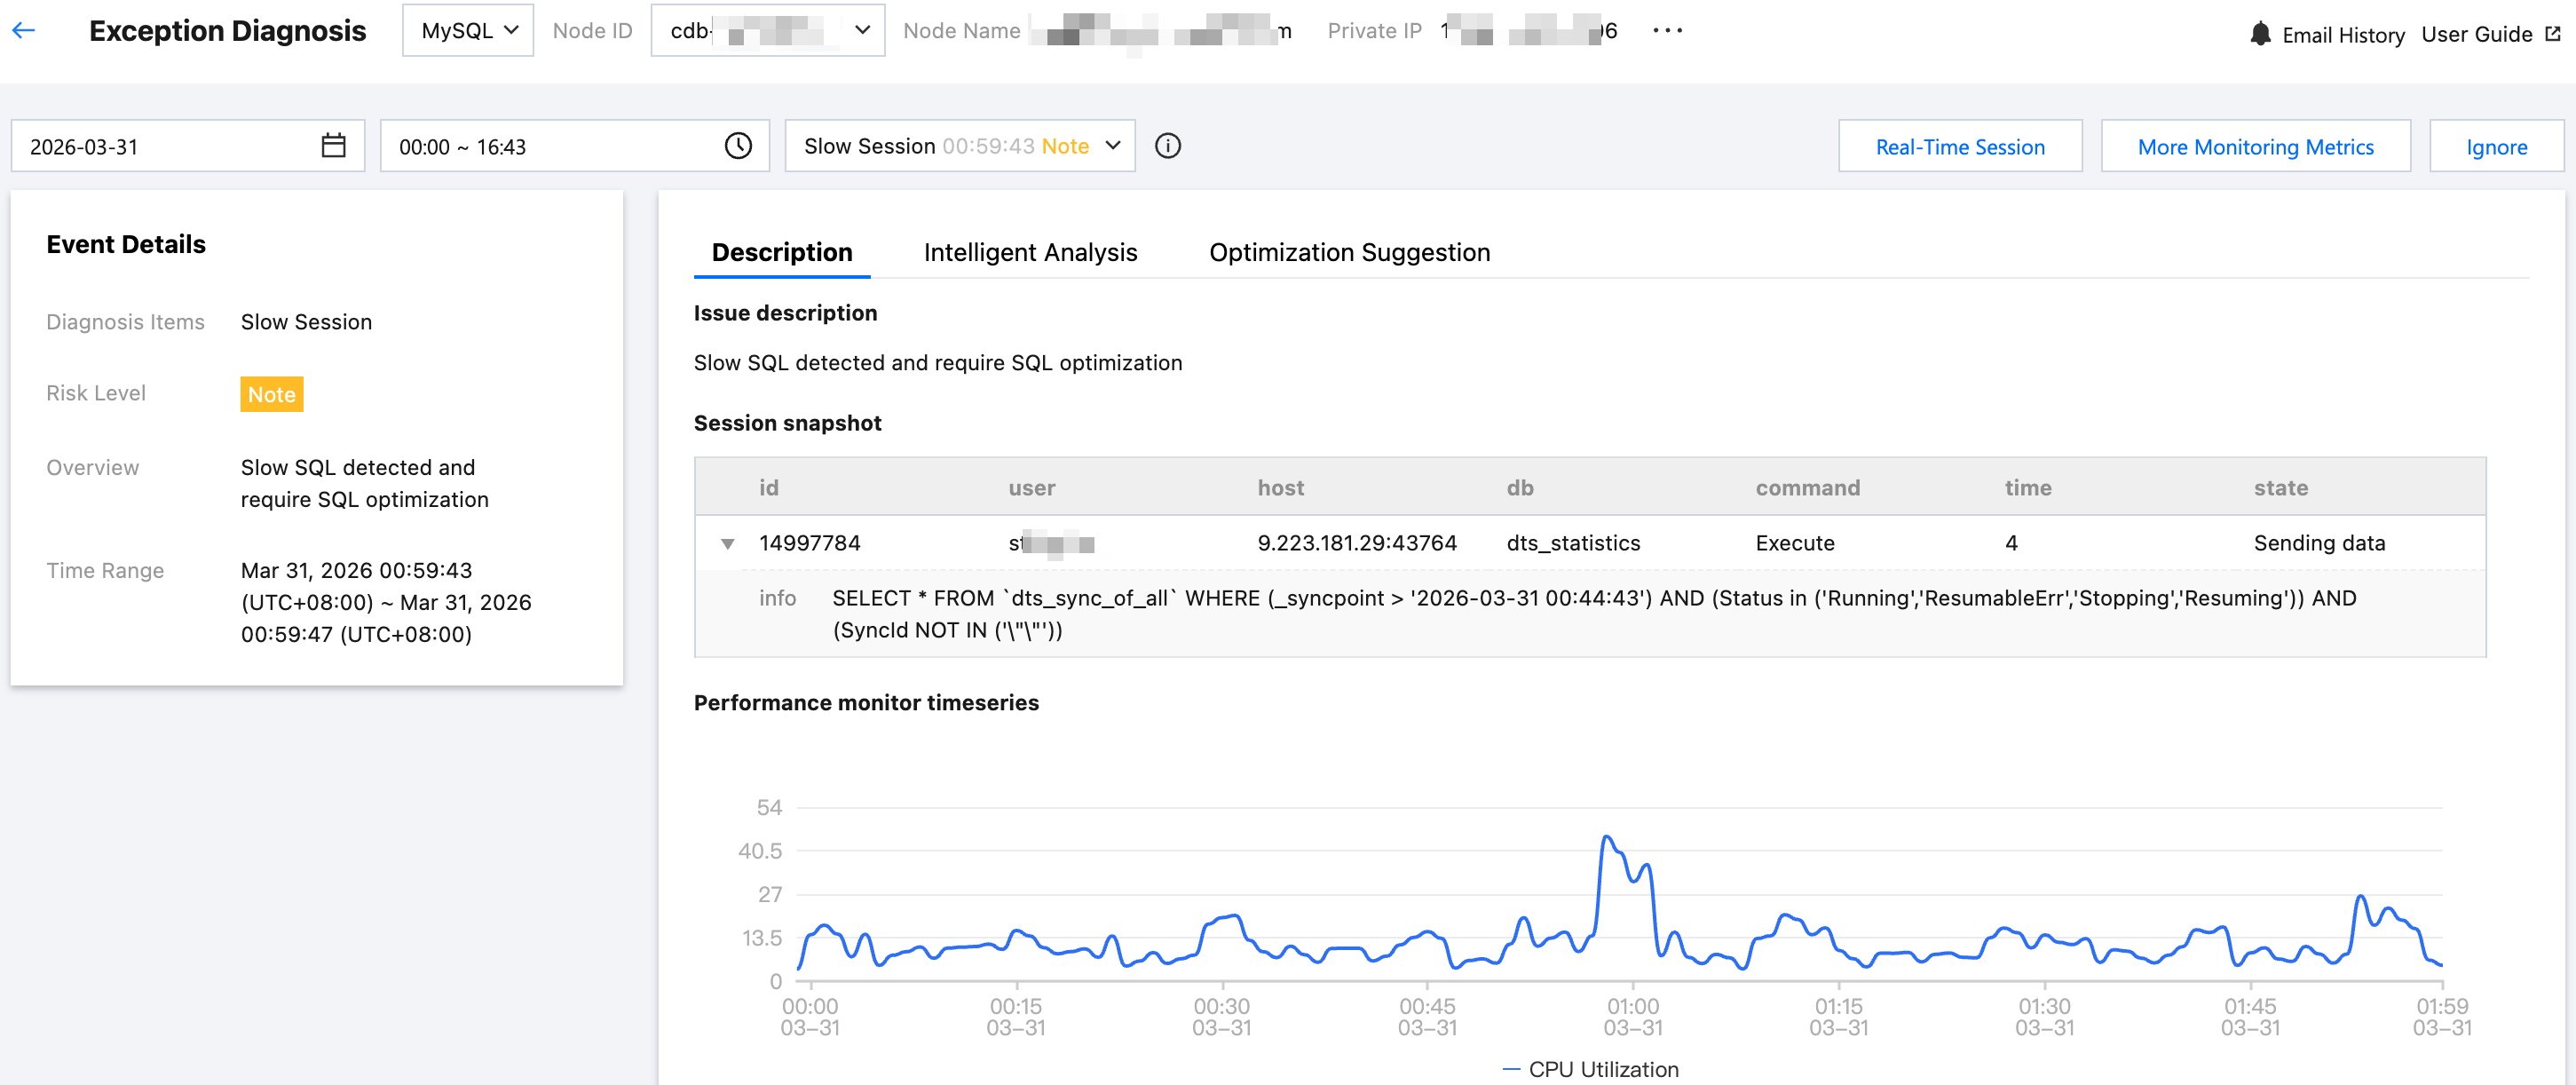
3. Clicking a diagnosis event in the view will display the details of the event.
Event Details: Include the Diagnosis items, Time Range, Risk Level, Duration, and Overview.
Description: Includes problem snapshots and performance trends of the exception or health inspection event.
Intelligent Analysis: Analyzes the root cause of the performance exception to help you locate the specific operation.
Optimization Suggestion: Provides optimization suggestions, including but not limited to SQL optimization (index and rewrite), resource configuration optimization, and parameter fine-tuning.
On the Optimization Suggestions page, click Optimization Comparison to view the SQL execution plan, index recommendations, table structure, and cost comparison before and after SQL optimization in the pop-up window.
SQL cost is estimated by analyzing statistical information of related database tables, OPTIMIZER_SWITCH configurations, and distinctiveness of index fields. This provides an overall estimation of the optimized SQL statement cost. Visual charts intuitively demonstrate the performance improvement achieved through SQL optimization. You can further verify optimization effectiveness by comparing execution plans before and after optimization.
Ignoring/Unignoring an alarm
Note:
Only diagnosis item alarms that are not generated by health inspections can be ignored or unignored.
In the Diagnosis Prompt section, hover the cursor over an event alarm, click Ignore, and select either Ignore this item or Ignore this type, then click OK.
Ignore This Item: ignores only this specific alarm.
Ignore This Type: ignores exception alarms caused by the same root cause.
Ignored diagnosis events will be displayed in gray.
To unignore, click Unignore and then click OK.
To display ignored alarms, select Show Ignored item.
Click Manage to view ignored content and ignored types.
You can go to the event details page and click Ignore or Unignore in the upper-right corner.
Viewing SQL and Slow SQL Information
The Real-Time SQL or Historical SQL section displays the overall information and distribution of requests made to the instance, including the trends of total requests as well as SELECT, REPLACE, INSERT, DELETE, and UPDATE requests.
The Real-Time Slow SQL or Historical Slow SQL section displays the trends of slow SQL statements (slow logs) and CPU utilization. You can click View Details in the top-right corner to enter the Slow SQL Analysis page and view analysis details.
Note:
For self-built database instances accessed directly, as server resource monitoring metrics cannot be collected, some features may not be displayed. We recommend you access such instances through the Agent.
Detailed Description of Diagnosis Items
Diagnosis items are the objects for intelligent diagnosis. Their types include performance, availability, reliability, and maintainability. Each diagnosis item belongs to only one type.
Diagnosis Item Name | Diagnosis Item Type | Description | Risk level classification | MySQL | TDSQL-C MySQL | Self-Built MySQL |
Connectivity | Availability | Inability to establish a database connection | Critical | ✓ | ✓ | ✓ |
Insert, update, delete operation slow | Performance | Excessive time to complete the INSERT, UPDATE, or DELETE operations | Serious: caused by a lock wait Alarm: not caused by a lock wait | ✓ | ✓ | ✓ |
Slow Session | Performance | There are slow sessions that are still running and have not completed. | Note | ✓ | ✓ | ✓ |
Slow SQL | Performance | Existence of slow query statements that require optimization | Note | ✓ | ✓ | ✓ |
Waiting for row lock | Performance | Existence of transactions waiting for locks for an excessively long time | Serious | ✓ | ✓ | ✓ |
Transaction not committed | Performance | Existence of uncommitted transactions for an excessively long time | Critical | ✓ | ✓ | ✓ |
DDL is waiting for table metadata lock | Performance | Existence of threads waiting for metadata locks while executing DDL statements | Serious | ✓ | ✓ | ✓ |
Insert, update, delete statement is waiting for table metadata lock | Performance | Existence of threads waiting for metadata locks while executing INSERT, UPDATE, and DELETE (IUD) statements | Serious | ✓ | ✓ | ✓ |
Select statement is waiting for table metadata lock | Performance | Existence of threads waiting for metadata locks while executing SELECT statements | Serious | ✓ | ✓ | ✓ |
Dead lock | Reliability | Database deadlocks | Critical | ✓ | ✓ | ✓ |
Read locks | Performance | Existence of threads waiting for global read-only locks | Critical | ✓ | ✓ | ✓ |
SQL statement is waiting for metadata lock | Performance | Existence of threads waiting for metadata locks while executing SQL statements other than DDL, IUD, and SELECT statements | Alarm | ✓ | ✓ | ✓ |
Waiting for flush tables | Performance | There are threads waiting for the flush tables status. | Critical: Number of active sessions > 30 Severe: 20 < number of active sessions ≤ 30 Alarm: number of active sessions ≤ 20 | ✓ | ✓ | ✓ |
Active session number is high | Performance | Number of active sessions exceeding three times the CPU specification of a database instance | Note | ✓ | ✓ | ✓ |
High concurrency request | Performance | Generation of high concurrency or high stress requests | Critical: CPU utilization > 80 Severe: 60 < CPU utilization ≤ 80 Alarm: 40 < CPU utilization ≤ 60 | ✓ | ✓ | ✓ |
Too many prepare statement | Performance | The number of unclosed prepared statements is too high (16382 is the default maximum allowed by MySQL). | Critical: Number of prepared statements > 16382 Severe: 14695 < Number of prepared statements ≤ 16382 Alarm: 11505 < Number of prepared statements ≤ 14695 Notice: Number of prepared statements ≤ 11505 | ✓ | ✓ | ✓ |
Disk space utilization | Reliability | Excessively high disk utilization | Critical: Disk utilization > 95 Severe: 90 < Disk utilization ≤ 95 Alarm: 85 < Disk utilization ≤ 90 Notice: 80 < Disk utilization ≤ 85 | ✓ | ✓ | ✓ |
Memory utilization | Performance | Excessively high memory utilization | Critical: Memory utilization > 100 Severe: 95 < Memory utilization ≤ 100 Alarm: 90 < Memory utilization ≤ 95 | ✓ | ✓ | - |
CPU utilization | Performance | Excessively high CPU utilization | Critical: CPU utilization > 80 Severe: 60 < CPU utilization ≤ 80 Alarm: 40 < CPU utilization ≤ 60 | ✓ | ✓ | ✓ |
Low table open cache hit rate | Performance | Low hit rate of table open cache | Alarm | ✓ | ✓ | ✓ |
Risk account | Maintainability | Existence of anonymous accounts and accounts without passwords | Note | ✓ | ✓ | ✓ |
Big table | Maintainability | Single table size exceeding 10% of the instance's disk specification | Critical: Space occupied by a single table > 40% of disk capacity Severe: 30% of disk capacity < space occupied by a single table ≤ 40% of disk capacity Alarm: 20% of disk capacity < space occupied by a single table ≤ 30% of disk capacity Note: 10% of disk capacity < space occupied by a single table ≤ 20% of disk capacity | ✓ | ✓ | ✓ |
Replication IO thread error | Reliability | Primary-secondary interruption due to replication I/O thread interruption | Critical: interruption not caused by a restart Note: interruption caused by a restart | ✓ | ✓ | - |
Insufficient resources for RO instance | Reliability | Critical: read-only delay exceeds 30 seconds and the number of CPU cores in the read-only instance is less than that in the primary instance. | Alarm | ✓ | - | - |
Replication SQL thread error | Reliability | Primary-secondary interruption due to replication SQL thread interruption | Critical: interruption not caused by a restart | ✓ | ✓ | - |
Replication delay by DDL | Reliability | Primary-secondary replication latency caused by DDL (including primary-read-only latency and primary-secondary database latency) | Critical: read-only delay > 10 minutes. Serious: Read-only latency ≤ 10 minutes or secondary database latency > 10 minutes Alarm: Secondary database latency ≤ 10 min | ✓ | ✓ | - |
Replication delay by transaction | Reliability | Primary-secondary replication latency caused by transactions (including primary-read-only latency and primary-secondary database latency) | Critical: read-only delay > 10 minutes. Serious: Read-only latency ≤ 10 minutes or secondary database latency > 10 minutes Alarm: Secondary database latency ≤ 10 min | ✓ | ✓ | - |
Replication delay by global read lock | Reliability | Primary-secondary replication latency caused by global read-only locks (including primary-read-only latency and primary-secondary database latency) | Critical: read-only delay > 10 minutes. Serious: Read-only latency ≤ 10 minutes or secondary database latency > 10 minutes Alarm: Secondary database latency ≤ 10 min | ✓ | ✓ | - |
Auto-increment key exhaustion | Availability | Auto-increment value exceeding 80% of the auto-increment primary key's maximum value | Critical: Auto-increment value > 80% of the maximum value | ✓ | ✓ | - |
Replication delay | Availability | Primary-secondary replication latency (including primary-read-only latency and primary-secondary database latency) | Critical: read-only delay > 10 minutes. Serious: Read-only latency ≤ 10 minutes or secondary database latency > 10 minutes Alarm: Secondary database latency ≤ 10 min | ✓ | ✓ | - |
Master-Salve switch | Availability | Switchover between the primary instance and a secondary instance | Critical | ✓ | - | - |
Instance migration caused by host server failure | Availability | ServerfailureInstanceMigration | Critical | ✓ | - | - |
Ro instance removal | Availability | If a read-only replica fails or exceeds the latency threshold, it will be removed. | Critical | ✓ | - | - |
Out of storage | Availability | The database disk usage exceeds the purchased space. | Critical | ✓ | - | - |
Out of Memory | Availability | The database memory usage is overloaded, resulting in an Out of Memory (OOM) condition. | Critical | ✓ | - | - |
CPU utilization fluctuation | Performance | The monitoring indicator shows a rapid spike in CPU usage. | Note | ✓ | - | - |
Memory utilization fluctuation | Performance | The monitoring indicator shows a rapid spike in memory usage. | Note | ✓ | - | - |
Disk space utilization fluctuation | Performance | The monitoring indicator shows a rapid spike in disk usage. | Note | ✓ | - | - |
High Delay in Maintenance Time Window | Availability | During the maintenance window, the replica instance delay exceeds 10 minutes and the replica instance delay exceeds the maximum allowed delay time. | Critical | ✓ | - | - |
Note:
For self-built database instances accessed via the Agent access method, there are currently no diagnostic items related to primary/secondary replication.
Self-built database instances accessed via the direct connection method lack diagnostic items related to host resources and primary/secondary replication.
피드백