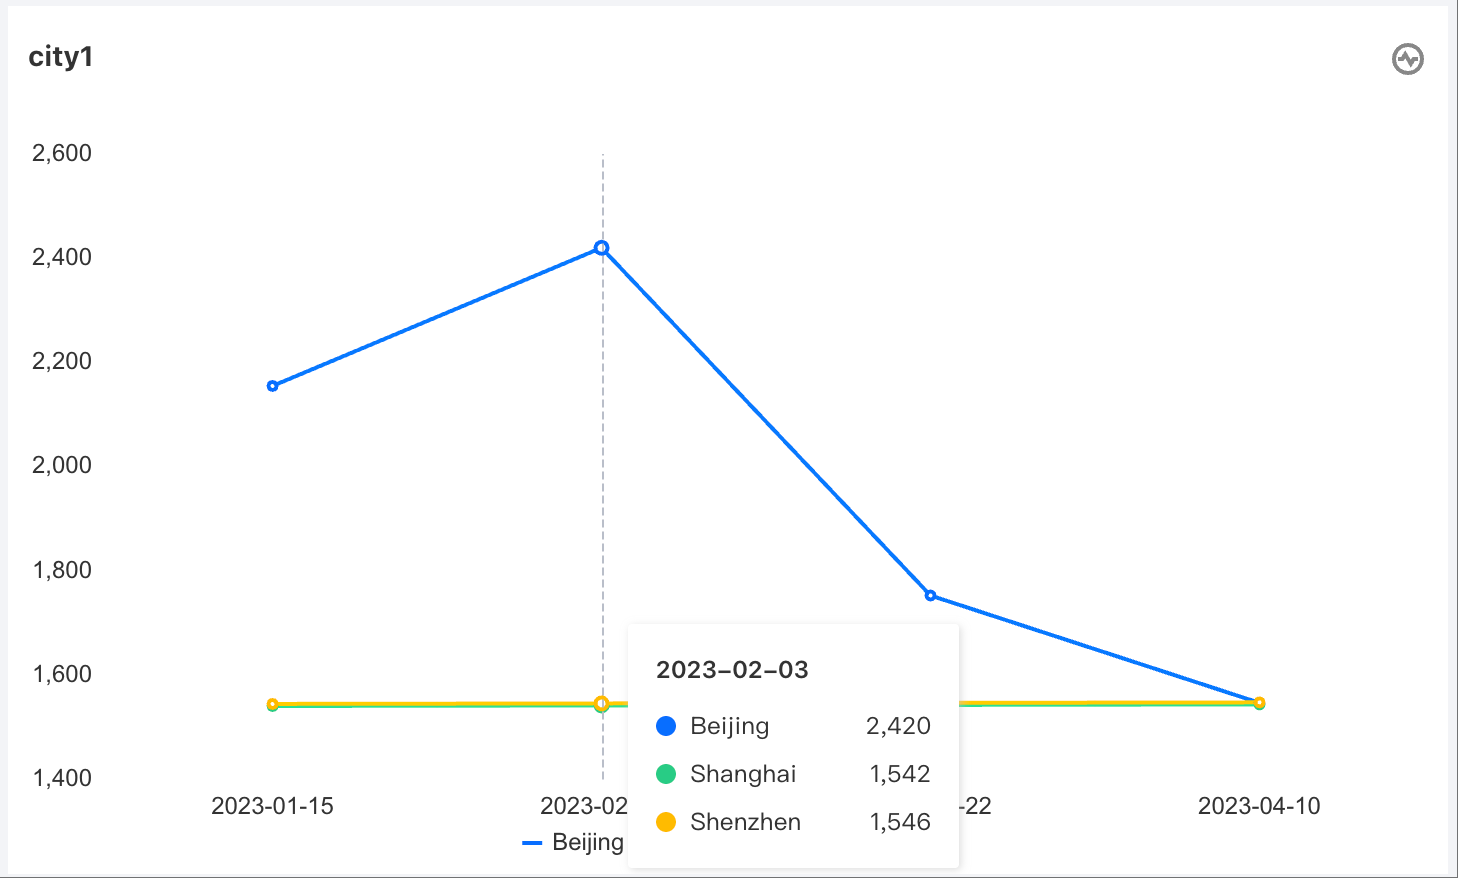
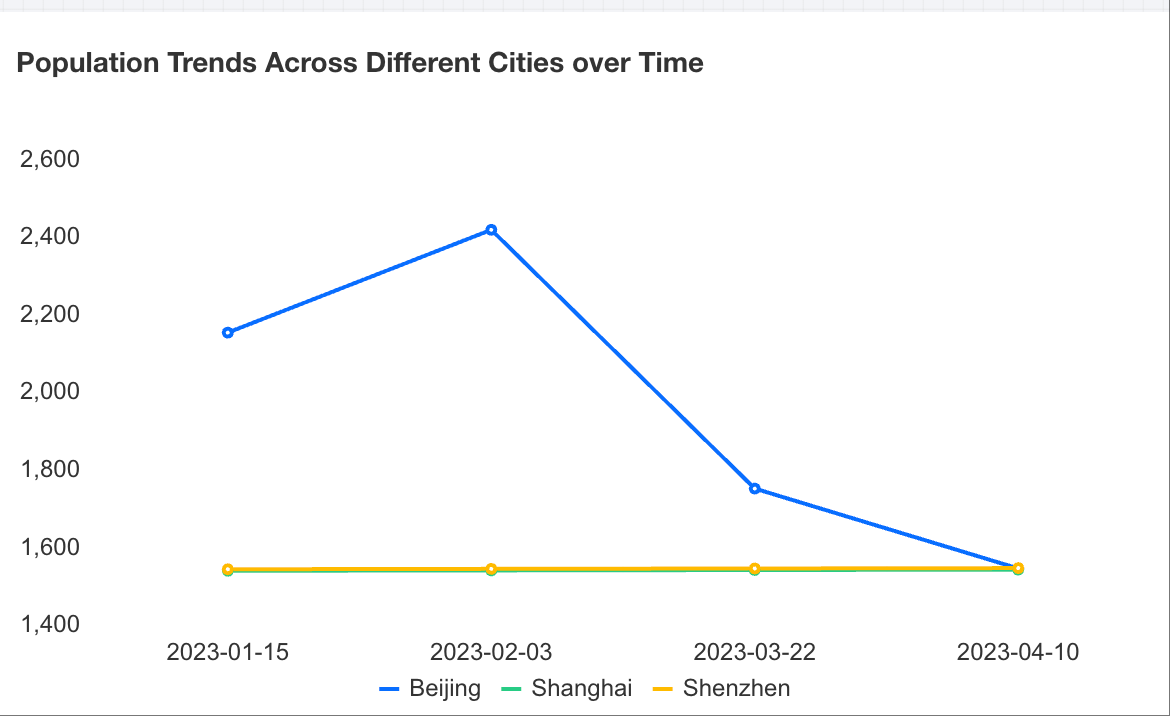
Trend analysis usually adopts line charts (or area charts). Line charts can display continuous data over time, suitable for showing trends at equal time intervals. In line charts, category data is evenly distributed along the horizontal axis, and all value data is evenly distributed along the vertical axis. The following example uses population trends across different cities over time to introduce how to create a trend analysis chart.
Adding Components
Drag and drop the
chart component from the component pane on the left to the canvas.
Configuring Query Conditions
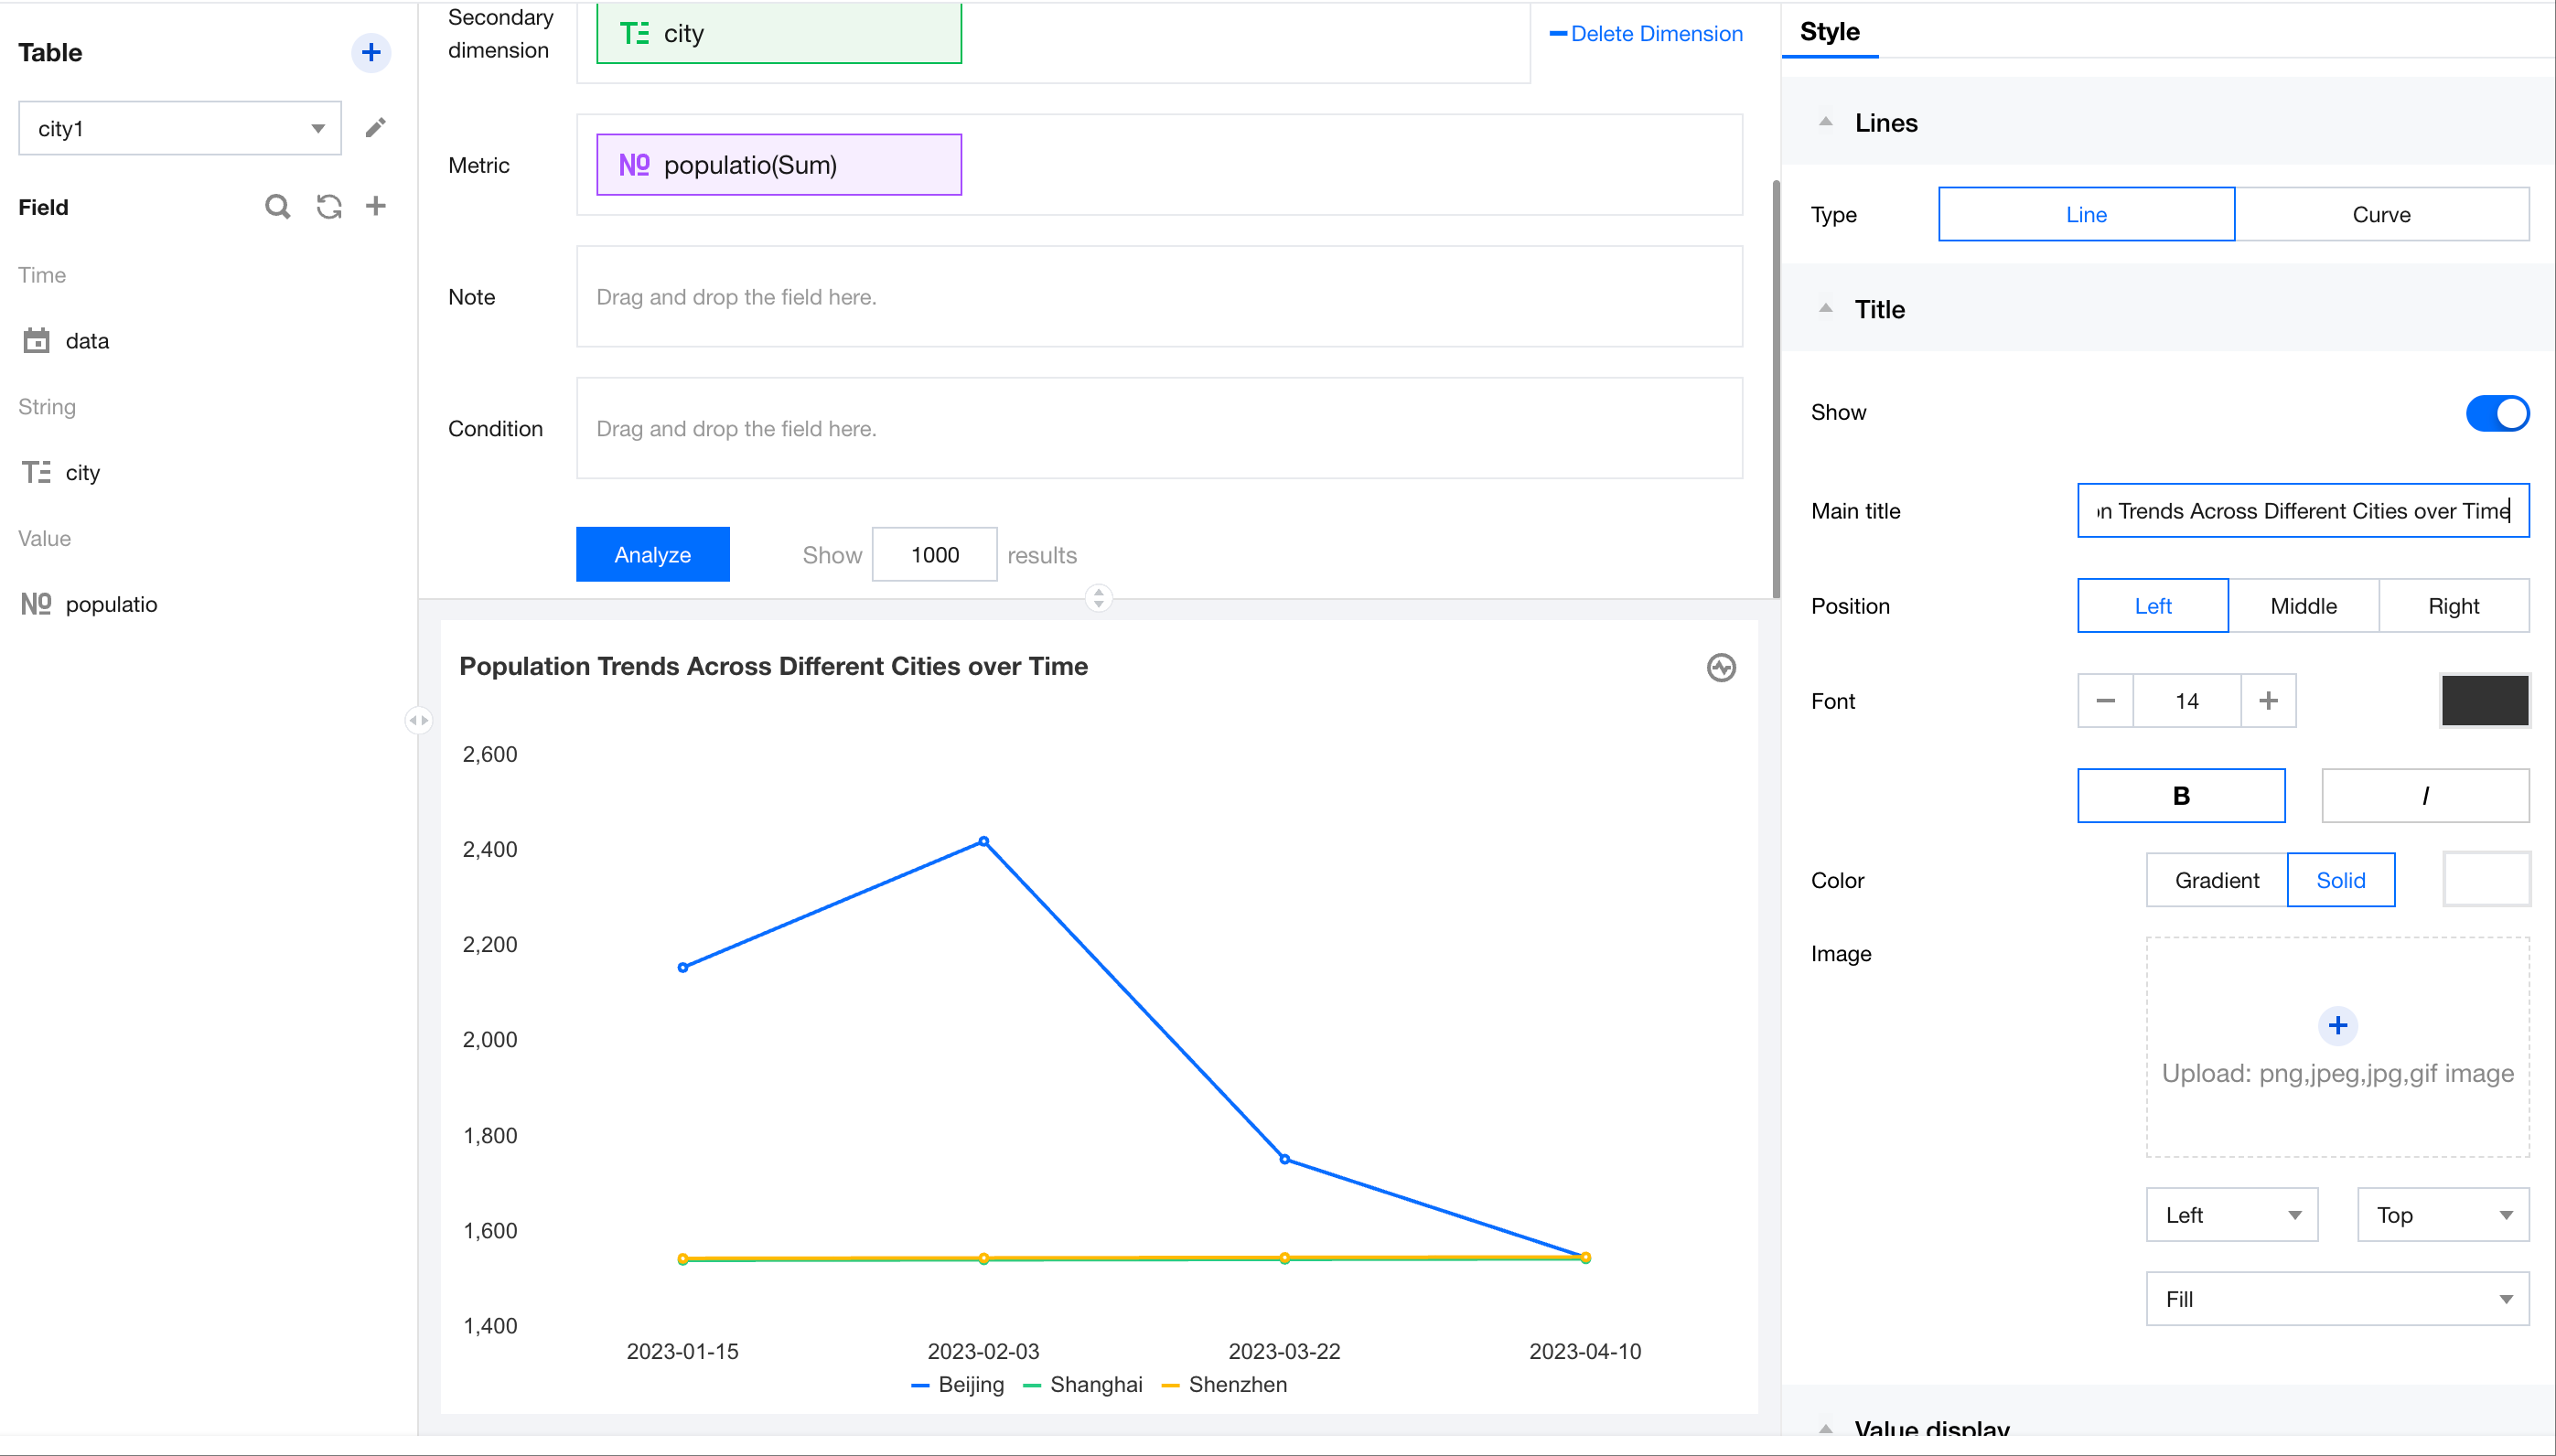
After selecting the data table on the left, drag the "date" and "city" dimensions to the dimension axis, and drag "population" to the metric axis. Click Analyze to generate a trend chart.
Setting Chart Titles
In the title area on the right, enter the title text "Population Trends Across Different Cities over Time" and update the title.