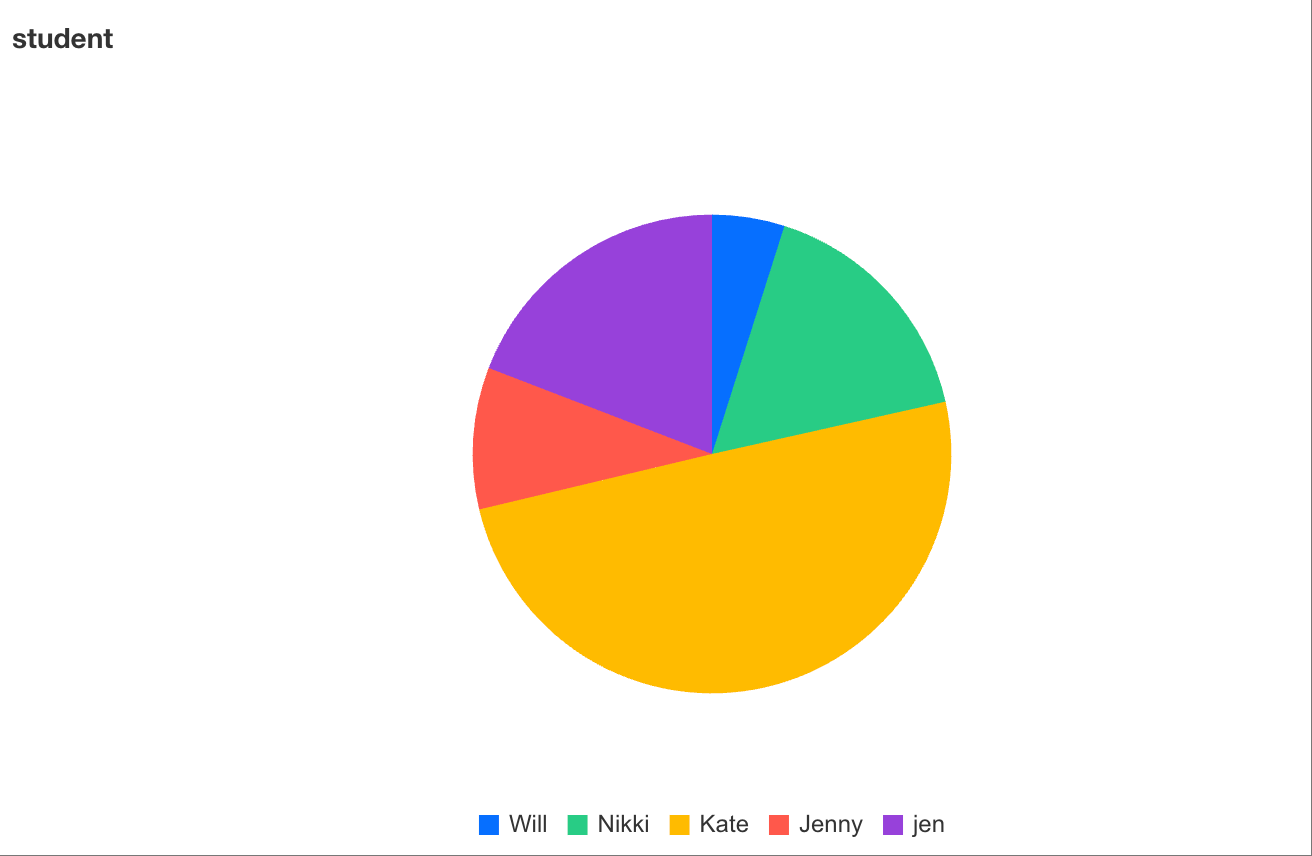
Proportion analysis usually adopts pie charts (or donut charts). A pie chart displays the relative size of each part within a data series as a proportion of the whole. Each slice in a pie chart represents the proportion of a specific item. The following example introduces how to create a proportion analysis chart using students' score proportions.
Adding Components
Drag and drop the
chart component from the component pane on the left to the canvas.
Configuring Query Conditions
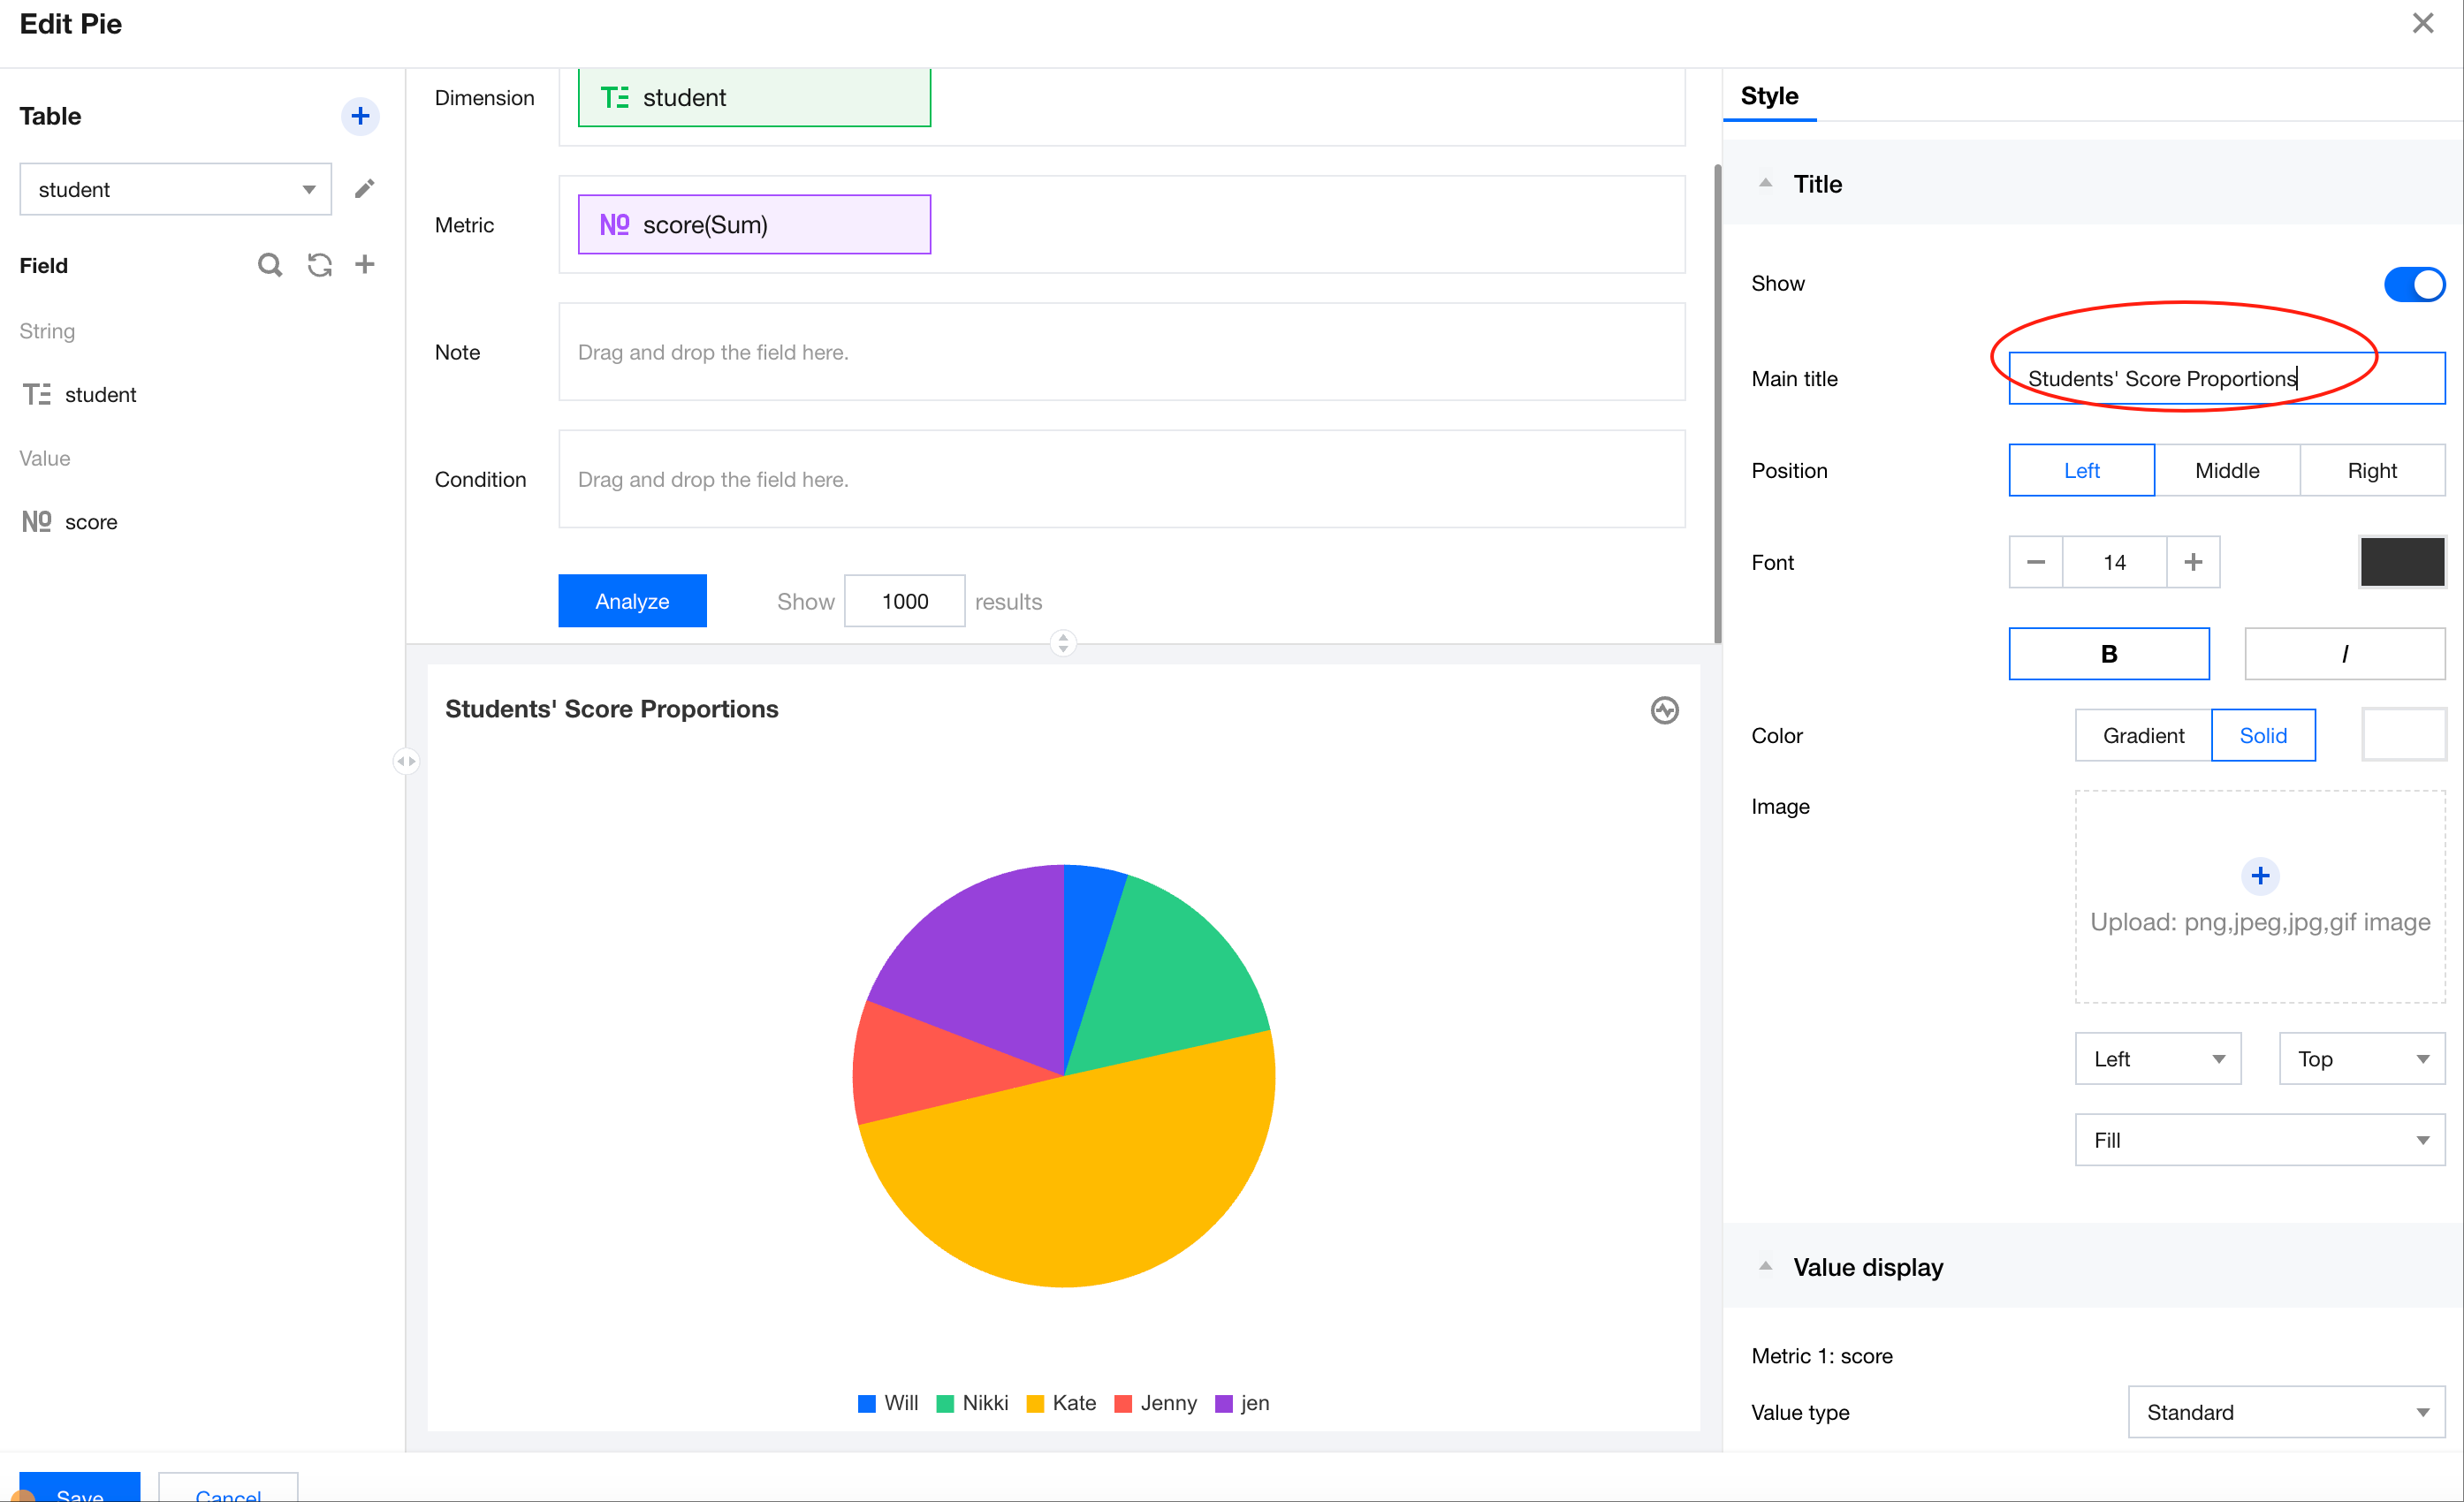
Drag "student" from the data list on the left to the dimension area and "score" to the metric area, and click Analyze to generate a pie chart.
Setting Chart Titles
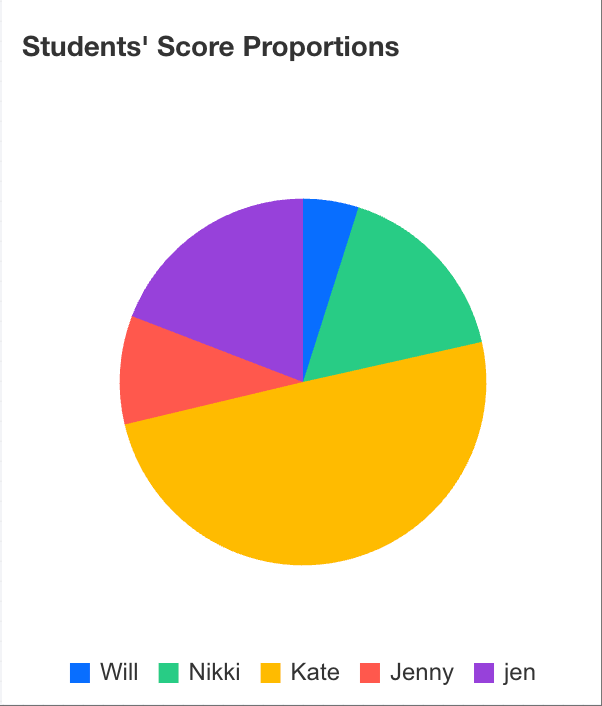
In the title area on the right, enter the title text "Students' Score Proportions" and update the title.