tencent cloud

Tencent Cloud Observability Platform

Release Notes and Announcements
Release Notes
Product Introduction
Overview
Strengths
Basic Features
Basic Concepts
Use Cases
Use Limits
Purchase Guide
Tencent Cloud Product Monitoring
Application Performance Management
Mobile App Performance Monitoring
Real User Monitoring
Cloud Automated Testing
Prometheus Monitoring
Grafana
EventBridge
PTS
Quick Start
Monitoring Overview
Instance Group
Tencent Cloud Product Monitoring
Application Performance Management
Real User Monitoring
Cloud Automated Testing
Performance Testing Service
Prometheus Getting Started
Grafana
Dashboard Creation
EventBridge
Alarm Service
Cloud Product Monitoring
Tencent Cloud Service Metrics
Operation Guide
CVM Agents
Cloud Product Monitoring Integration with Grafana
Troubleshooting
Practical Tutorial
Application Performance Management
Product Introduction
Access Guide
Operation Guide
Practical Tutorial
Parameter Information
FAQs
Mobile App Performance Monitoring
Overview
Operation Guide
Access Guide
Practical Tutorial
Tencent Cloud Real User Monitoring
Product Introduction
Operation Guide
Connection Guide
FAQs
Cloud Automated Testing
Product Introduction
Operation Guide
FAQs
Performance Testing Service
Overview
Operation Guide
Practice Tutorial
JavaScript API List
FAQs
Prometheus Monitoring
Product Introduction
Access Guide
Operation Guide
Practical Tutorial
Terraform
FAQs
Grafana
Product Introduction
Operation Guide
Guide on Grafana Common Features
FAQs
Dashboard
Overview
Operation Guide
Alarm Management
Console Operation Guide
Troubleshooting
FAQs
EventBridge
Product Introduction
Operation Guide
Practical Tutorial
FAQs
Report Management
FAQs
General
Alarm Service
Concepts
Monitoring Charts
CVM Agents
Dynamic Alarm Threshold
CM Connection to Grafana
Documentation Guide
Related Agreements
Application Performance Management Service Level Agreement
APM Privacy Policy
APM Data Processing And Security Agreement
RUM Service Level Agreement
Mobile Performance Monitoring Service Level Agreement
Cloud Automated Testing Service Level Agreement
Prometheus Service Level Agreement
TCMG Service Level Agreements
PTS Service Level Agreement
PTS Use Limits
Cloud Monitor Service Level Agreement
API Documentation
History
Introduction
API Category
Making API Requests
Monitoring Data Query APIs
Alarm APIs
Legacy Alert APIs
Notification Template APIs
TMP APIs
Grafana Service APIs
Event Center APIs
TencentCloud Managed Service for Prometheus APIs
Monitoring APIs
Data Types
Error Codes
Glossary

TKE Monitoring

PDF
포커스 모드
폰트 크기
마지막 업데이트 시간: 2024-01-27 17:45:42

New TKE Monitoring Features

● Monitored objects can be updated automatically. ● Workload/Component/Node monitoring scenarios are added. ● More monitoring metrics are added. The total number of new TKE metrics reaches 140. ● You can block a special object (such as a frequently alarming pod) in a specific monitoring dimension.

Directions

This document describes how to automatically update a monitored object in the dashboard, automatically update an alarm object, and block a frequently triggered alarm object by taking the "TKE monitoring - pod" dimension as an example.

Automatically updating monitored object in dashboard

2. Select Dashboard > Dashboard List > Create Dashboard > Create Chart.
3. Configure the monitoring chart as detailed below:
Monitoring Type: select Cloud Product Monitoring here.
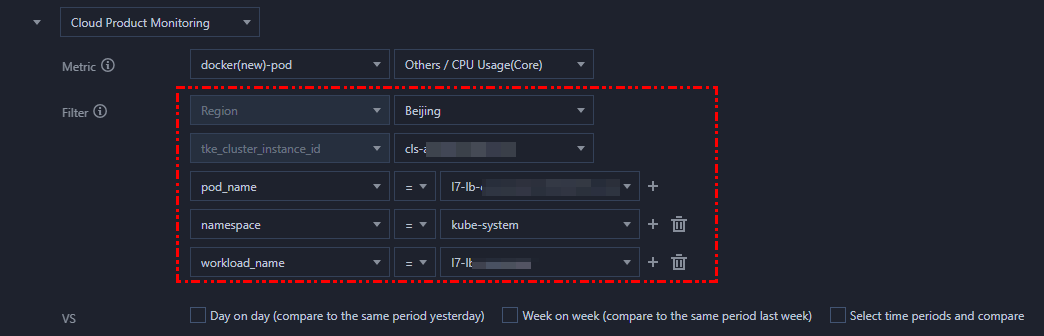
Metric: select "TKE (New) - pod" as the service and "CPU utilization (%)" as the metric here.
Filter: you can filter the objects to be bound to the chart by dimension (such as region, cluster, namespace, and workload).
Region: select the region of the monitored object.
Cluster: select the cluster of the monitored object.
Filter: you need to configure two filters, namely, the namespace and workload balance type, to monitor all pods under the specified workload and to automatically update the monitored object in the dashboard when pods are created/updated frequently, as shown below:


4. After completing the configuration, click Save in the top-right corner of the page to save the chart.

Automatically updating alarm object

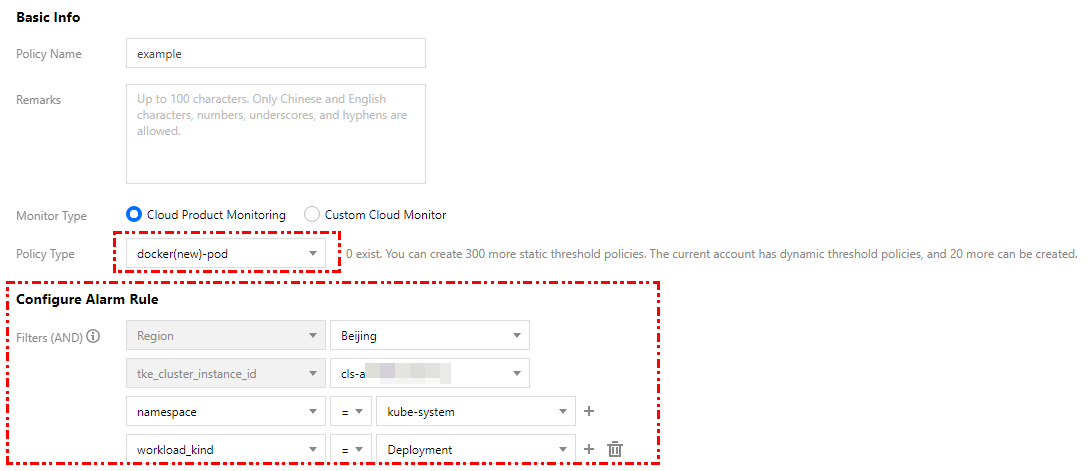
2. Select Alarm Configuration > Alarm Policy > Create to enter the alarm policy creation page.
3. Select "TKE (New) - pod" as the policy type and configure the alarm object as detailed below:
Region: select the region of the monitored object.
Cluster: select the cluster of the monitored object.
Filter: you need to configure two filters, namely, the namespace and workload balance type, to monitor all pods under the specified workload and to automatically update the alarm object when pods are created/updated frequently, as shown below:


Note:
For more information on how to configure an alarm, please see Creating Alarm Policy.

Blocking frequently triggered alarm object

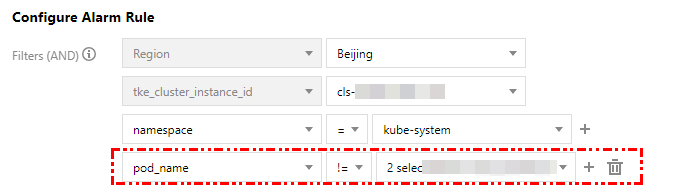
When a pod frequently triggers an alarm, you can block some or all alarm objects under the node as instructed below.
As shown below, you can block some pod alarms by configuring the "!=" operator for the pod name.


도움말 및 지원

문제 해결에 도움이 되었나요?

피드백