tencent cloud

Tencent Cloud Observability Platform

Release Notes and Announcements
Release Notes
Product Introduction
Overview
Strengths
Basic Features
Basic Concepts
Use Cases
Use Limits
Purchase Guide
Tencent Cloud Product Monitoring
Application Performance Management
Mobile App Performance Monitoring
Real User Monitoring
Cloud Automated Testing
Prometheus Monitoring
Grafana
EventBridge
PTS
Quick Start
Monitoring Overview
Instance Group
Tencent Cloud Product Monitoring
Application Performance Management
Real User Monitoring
Cloud Automated Testing
Performance Testing Service
Prometheus Getting Started
Grafana
Dashboard Creation
EventBridge
Alarm Service
Cloud Product Monitoring
Tencent Cloud Service Metrics
Operation Guide
CVM Agents
Cloud Product Monitoring Integration with Grafana
Troubleshooting
Practical Tutorial
Application Performance Management
Product Introduction
Access Guide
Operation Guide
Practical Tutorial
Parameter Information
FAQs
Mobile App Performance Monitoring
Overview
Operation Guide
Access Guide
Practical Tutorial
Tencent Cloud Real User Monitoring
Product Introduction
Operation Guide
Connection Guide
FAQs
Cloud Automated Testing
Product Introduction
Operation Guide
FAQs
Performance Testing Service
Overview
Operation Guide
Practice Tutorial
JavaScript API List
FAQs
Prometheus Monitoring
Product Introduction
Access Guide
Operation Guide
Practical Tutorial
Terraform
FAQs
Grafana
Product Introduction
Operation Guide
Guide on Grafana Common Features
FAQs
Dashboard
Overview
Operation Guide
Alarm Management
Console Operation Guide
Troubleshooting
FAQs
EventBridge
Product Introduction
Operation Guide
Practical Tutorial
FAQs
Report Management
FAQs
General
Alarm Service
Concepts
Monitoring Charts
CVM Agents
Dynamic Alarm Threshold
CM Connection to Grafana
Documentation Guide
Related Agreements
Application Performance Management Service Level Agreement
APM Privacy Policy
APM Data Processing And Security Agreement
RUM Service Level Agreement
Mobile Performance Monitoring Service Level Agreement
Cloud Automated Testing Service Level Agreement
Prometheus Service Level Agreement
TCMG Service Level Agreements
PTS Service Level Agreement
PTS Use Limits
Cloud Monitor Service Level Agreement
API Documentation
History
Introduction
API Category
Making API Requests
Monitoring Data Query APIs
Alarm APIs
Legacy Alert APIs
Notification Template APIs
TMP APIs
Grafana Service APIs
Event Center APIs
TencentCloud Managed Service for Prometheus APIs
Monitoring APIs
Data Types
Error Codes
Glossary

Startup Monitoring

PDF
포커스 모드
폰트 크기
마지막 업데이트 시간: 2024-05-14 12:36:06
Startup monitoring requires the use of the qapm-plugin plugin for instrumentation during compilation. The default instrumentation points are the various lifecycles of the Application and Activity. In the App SDK, the default startup time is measured from Application's attachBaseContext to the end of onResume of the first Activity.

Prerequisites

The qapm-plugin has been configured in the app-level build.gradle.

Configuration Process

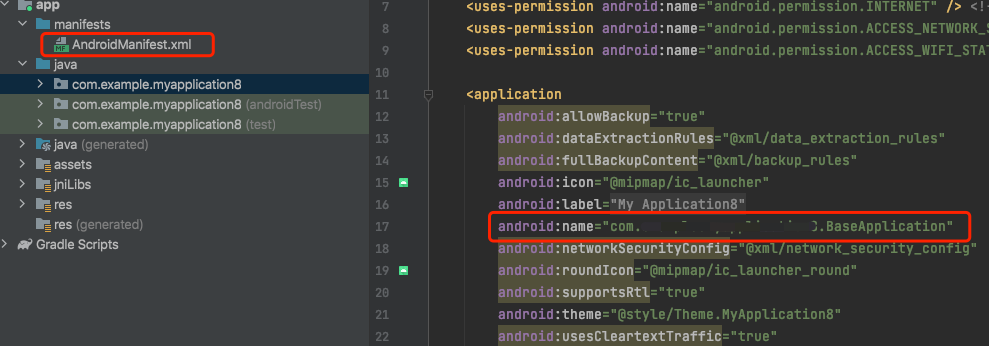
1. Manually add an Application subclass, such as BaseApplication (the name is not restricted, and the subclass does not need to implement any methods or add any attributes).
2. In the AndroidManifest.xml file, add the android:name attribute to the application node, with the value being "package name+Application subclass name".


Additional Tracking

If you want to measure the execution time of certain methods within the startup interval, additional tracking is required, as shown below:
Refer to the code:
QAPM.beginScene(StageConstant.QAPM_APPLAUNCH, "Method Name", QAPM.ModeResource);
/**Service logic*/
QAPM.endScene(StageConstant.QAPM_APPLAUNCH, "Method Name", QAPM.ModeResource);
If you want to set your own end point for the startup, additional tracking must be done within 20s after the first Activity calls onResume, as shown below:
Refer to the code:
/**
* Users who need to customize the end point must do so within 20s after onResume. Otherwise, APM's end point will be used.
*/
QAPM.endScene(StageConstant.QAPM_APPLAUNCH, QAPM.ModeResource);

Verifying Whether the Feature Is Working Properly

If the following log message appears 20 seconds after each startup or switch to background, it indicates successful reporting of startup metric data.
Retrieval tag: [plugin::114]


Note:
It requires the qapm-plugin for instrumentation and you must manually add an Application subclass. Otherwise, it will not work.
Individual event data will be reported only if the total startup time exceeds 2.5s.

Calculation

Cold Startup:

Occurs after the app starts from the device or after the system terminates the app for the first time.
Android calculation method: mainActivityOnResume_end - attachBaseContext_start.
iOS calculation method: Time of the first frame of the first page UI displayed on screen - App process creation time.

Initial Startup:

Indicates the first launch after the app installation, which is a special case of cold startup.
Android calculation method: mainActivityOnResume_end - attachBaseContext_start
iOS calculation method: Time of the first frame of the first page UI displayed on screen - App process creation time.

Warm Startup:

Under the premise that process and Activity instances still exist (for iOS, the app is in the background and alive). If the app switches to the background for three minutes and then switches back to the foreground, it is defined as a warm startup.
Android calculation method: activityOnResume_end - activityOnRestart_start.
iOS calculation method: ApplicationDidBecomeActive - ApplicationWillEnterForeground.

Startup Duration:

Total boot time / Total boot count


도움말 및 지원

문제 해결에 도움이 되었나요?

피드백