When using PostgreSQL, you need to monitor its running status to know whether it runs normally and troubleshoot its faults. TMP provides an exporter to monitor PostgreSQL and offers an out-of-the-box Grafana monitoring dashboard for it. This document describes how to deploy the PostgreSQL exporter and integrate it with the alert feature.
Note:
For easier export installation and management, we recommend you use TKE for unified management.
Prerequisites
You have created a TKE cluster in the region and VPC of your TMP instance.
You have located and integrated the target TKE cluster in the Integrate with TKE section of the target TMP instance in the TMP console. For more information, please see Agent Management.
1. On the left sidebar, select Workload > Deployment to enter the Deployment page.
2. In the top-right corner of the page, click Create via YAML to create a YAML configuration as detailed below:
You can use Kubernetes Secrets to manage and encrypt passwords. When starting the PostgreSQL exporter, you can directly use the Secret key but need to adjust the corresponding password. Below is a sample YAML configuration:
On the Deployment management page, click Create and select the target namespace to deploy the service. You can create in the console. Here, YAML is used to deploy the exporter. Below is a sample YAML configuration (please directly copy the following content and adjust the corresponding parameters based on your actual business needs):
apiVersion: apps/v1
kind: Deployment
metadata:
name: postgres-test
namespace: postgres-test
labels:
app: postgres
app.kubernetes.io/name: postgresql
spec:
replicas:1
selector:
matchLabels:
app: postgres
app.kubernetes.io/name: postgresql
template:
metadata:
labels:
app: postgres
app.kubernetes.io/name: postgresql
spec:
containers:
-name: postgres-exporter
image: wrouesnel/postgres_exporter:latest
args:
-"--web.listen-address=:9187"
-"--log.level=debug"
env:
-name: DATA_SOURCE_USER
valueFrom:
secretKeyRef:
name: postgres-test
key: username
-name: DATA_SOURCE_PASS
valueFrom:
secretKeyRef:
name: postgres-test
key: password
-name: DATA_SOURCE_URI
value:"x.x.x.x:5432/postgres?sslmode=disable"
ports:
-name: http-metrics
containerPort:9187
Note:
In the above sample, the username and password in Secret are passed in to the environment variables DATA_SOURCE_USER and DATA_SOURCE_PASS, so the username and password cannot be viewed in plaintext. You can also use DATA_SOURCE_USER_FILE/DATA_SOURCE_PASS_FILE to read the username and password from the file, or use DATA_SOURCE_NAME to put them in the connection string, such as postgresql://login:password@hostname:port/dbname.
Parameter description
The query part (after ?) in the DATA_SOURCE_URI/DATA_SOURCE_NAME connection string supports the following parameters (the latest supported parameters listed in Connection String Parameters shall prevail):
Parameter
Description
sslmode
Whether to use SSL. Valid values:
- disable
Do not use SSL
- require
Always use (skip verification)
- verify-ca
Always use (check whether the certificate provided by the server is issued by a trusted CA)
- verify-full
Always use (check whether the certificate provided by the server is issued by a trusted CA and whether the hostname matches the certificate)
fallback_application_name
Alternative application_name
connect_timeout
Maximum connection wait time in seconds. `0` indicates to wait infinitely
sslcert
Certificate file path. The file data must be in PEM format
SSHKey
Private key file path. The file data must be in PEM format
sslrootcert
Root certificate file path. The file data must be in PEM format
Other supported exporter parameters are as detailed below (for more information, please see PostgreSQL Server Exporter):
Parameter
Description
Environment Variable
--web.listen-address
Listening address. Default value: :9487
PG_EXPORTER_WEB_LISTEN_ADDRESS
--web.telemetry-path
Path under which to expose metrics. Default value: /metrics
PG_EXPORTER_WEB_TELEMETRY_PATH
--extend.query-path
Path of a YAML file containing custom queries to run. For more information, please see queries.yaml
PG_EXPORTER_EXTEND_QUERY_PATH
--disable-default-metrics
Uses only metrics supplied from queries.yaml
PG_EXPORTER_DISABLE_DEFAULT_METRICS
--disable-settings-metrics
Skips scraping pg_settings metrics
PG_EXPORTER_DISABLE_SETTINGS_METRICS
--auto-discover-databases
Whether to discover the databases in the PostgreSQL instance dynamically
PG_EXPORTER_AUTO_DISCOVER_DATABASES
--dumpmaps
Prints the internal metric information to help troubleshoot custom queries (do not use it unless for debugging)
-
--constantLabels
Custom label provided in the format of key=value. Multiple labels are separated with ,
PG_EXPORTER_CONSTANT_LABELS
--exclude-databases
Database to be excluded. It takes effect only if --auto-discover-databases is enabled
You cannot get the PostgreSQL instance operation time through curl http://exporter:9187/metrics. You can define a queries.yaml file to get this metric:
2. Mount the ConfigMap to a directory in the exporter as a volume.
3. Use the ConfigMap through --extend.query-path to aggregate the information of the aforementioned Secret and Deployment. The YAML file after aggregation is as shown below:
# Note: the following document sample code creates a namespace named `postgres-test`, which is for reference only
apiVersion: v1
kind: Namespace
metadata:
name: postgres-test
# The following document sample code creates a Secret containing a username and password
---
apiVersion: v1
kind: Secret
metadata:
name: postgres-test-secret
namespace: postgres-test
type: Opaque
stringData:
username: postgres
password: you-guess
# The following document sample code creates a `queries.yaml` file containing custom metrics
---
apiVersion: v1
kind: ConfigMap
metadata:
name: postgres-test-configmap
namespace: postgres-test
data:
queries.yaml:|
pg_postmaster:
query: "SELECT pg_postmaster_start_time as start_time_seconds from pg_postmaster_start_time()"
master: true
metrics:
- start_time_seconds:
usage: "GAUGE"
description: "Time at which postmaster started"
# The following document sample code mounts the Secret and ConfigMap and defines exporter deployment-related parameters such as image
---
apiVersion: apps/v1
kind: Deployment
metadata:
name: postgres-test
namespace: postgres-test
labels:
app: postgres
app.kubernetes.io/name: postgresql
spec:
replicas:1
selector:
matchLabels:
app: postgres
app.kubernetes.io/name: postgresql
template:
metadata:
labels:
app: postgres
app.kubernetes.io/name: postgresql
spec:
containers:
-name: postgres-exporter
image: wrouesnel/postgres_exporter:latest
args:
-"--web.listen-address=:9187"
-"--extend.query-path=/etc/config/queries.yaml"
-"--log.level=debug"
env:
-name: DATA_SOURCE_USER
valueFrom:
secretKeyRef:
name: postgres-test-secret
key: username
-name: DATA_SOURCE_PASS
valueFrom:
secretKeyRef:
name: postgres-test-secret
key: password
-name: DATA_SOURCE_URI
value:"x.x.x.x:5432/postgres?sslmode=disable"
ports:
-name: http-metrics
containerPort:9187
volumeMounts:
-name: config-volume
mountPath: /etc/config
volumes:
-name: config-volume
configMap:
name: postgres-test-configmap
4. Run curl http://exporter:9187/metrics, and you can use the custom queries.yaml to query the PostgreSQL instance start time as follows:
# HELP pg_postmaster_start_time_seconds Time at which postmaster started
You need to use the configuration in Getting metric to get the PostgreSQL instance start time.
1. In the TMP instance list, find the corresponding TMP instance, click
on the right of the instance ID to open your Grafana page, and enter your account and password to access the Grafana visual dashboard operation section.
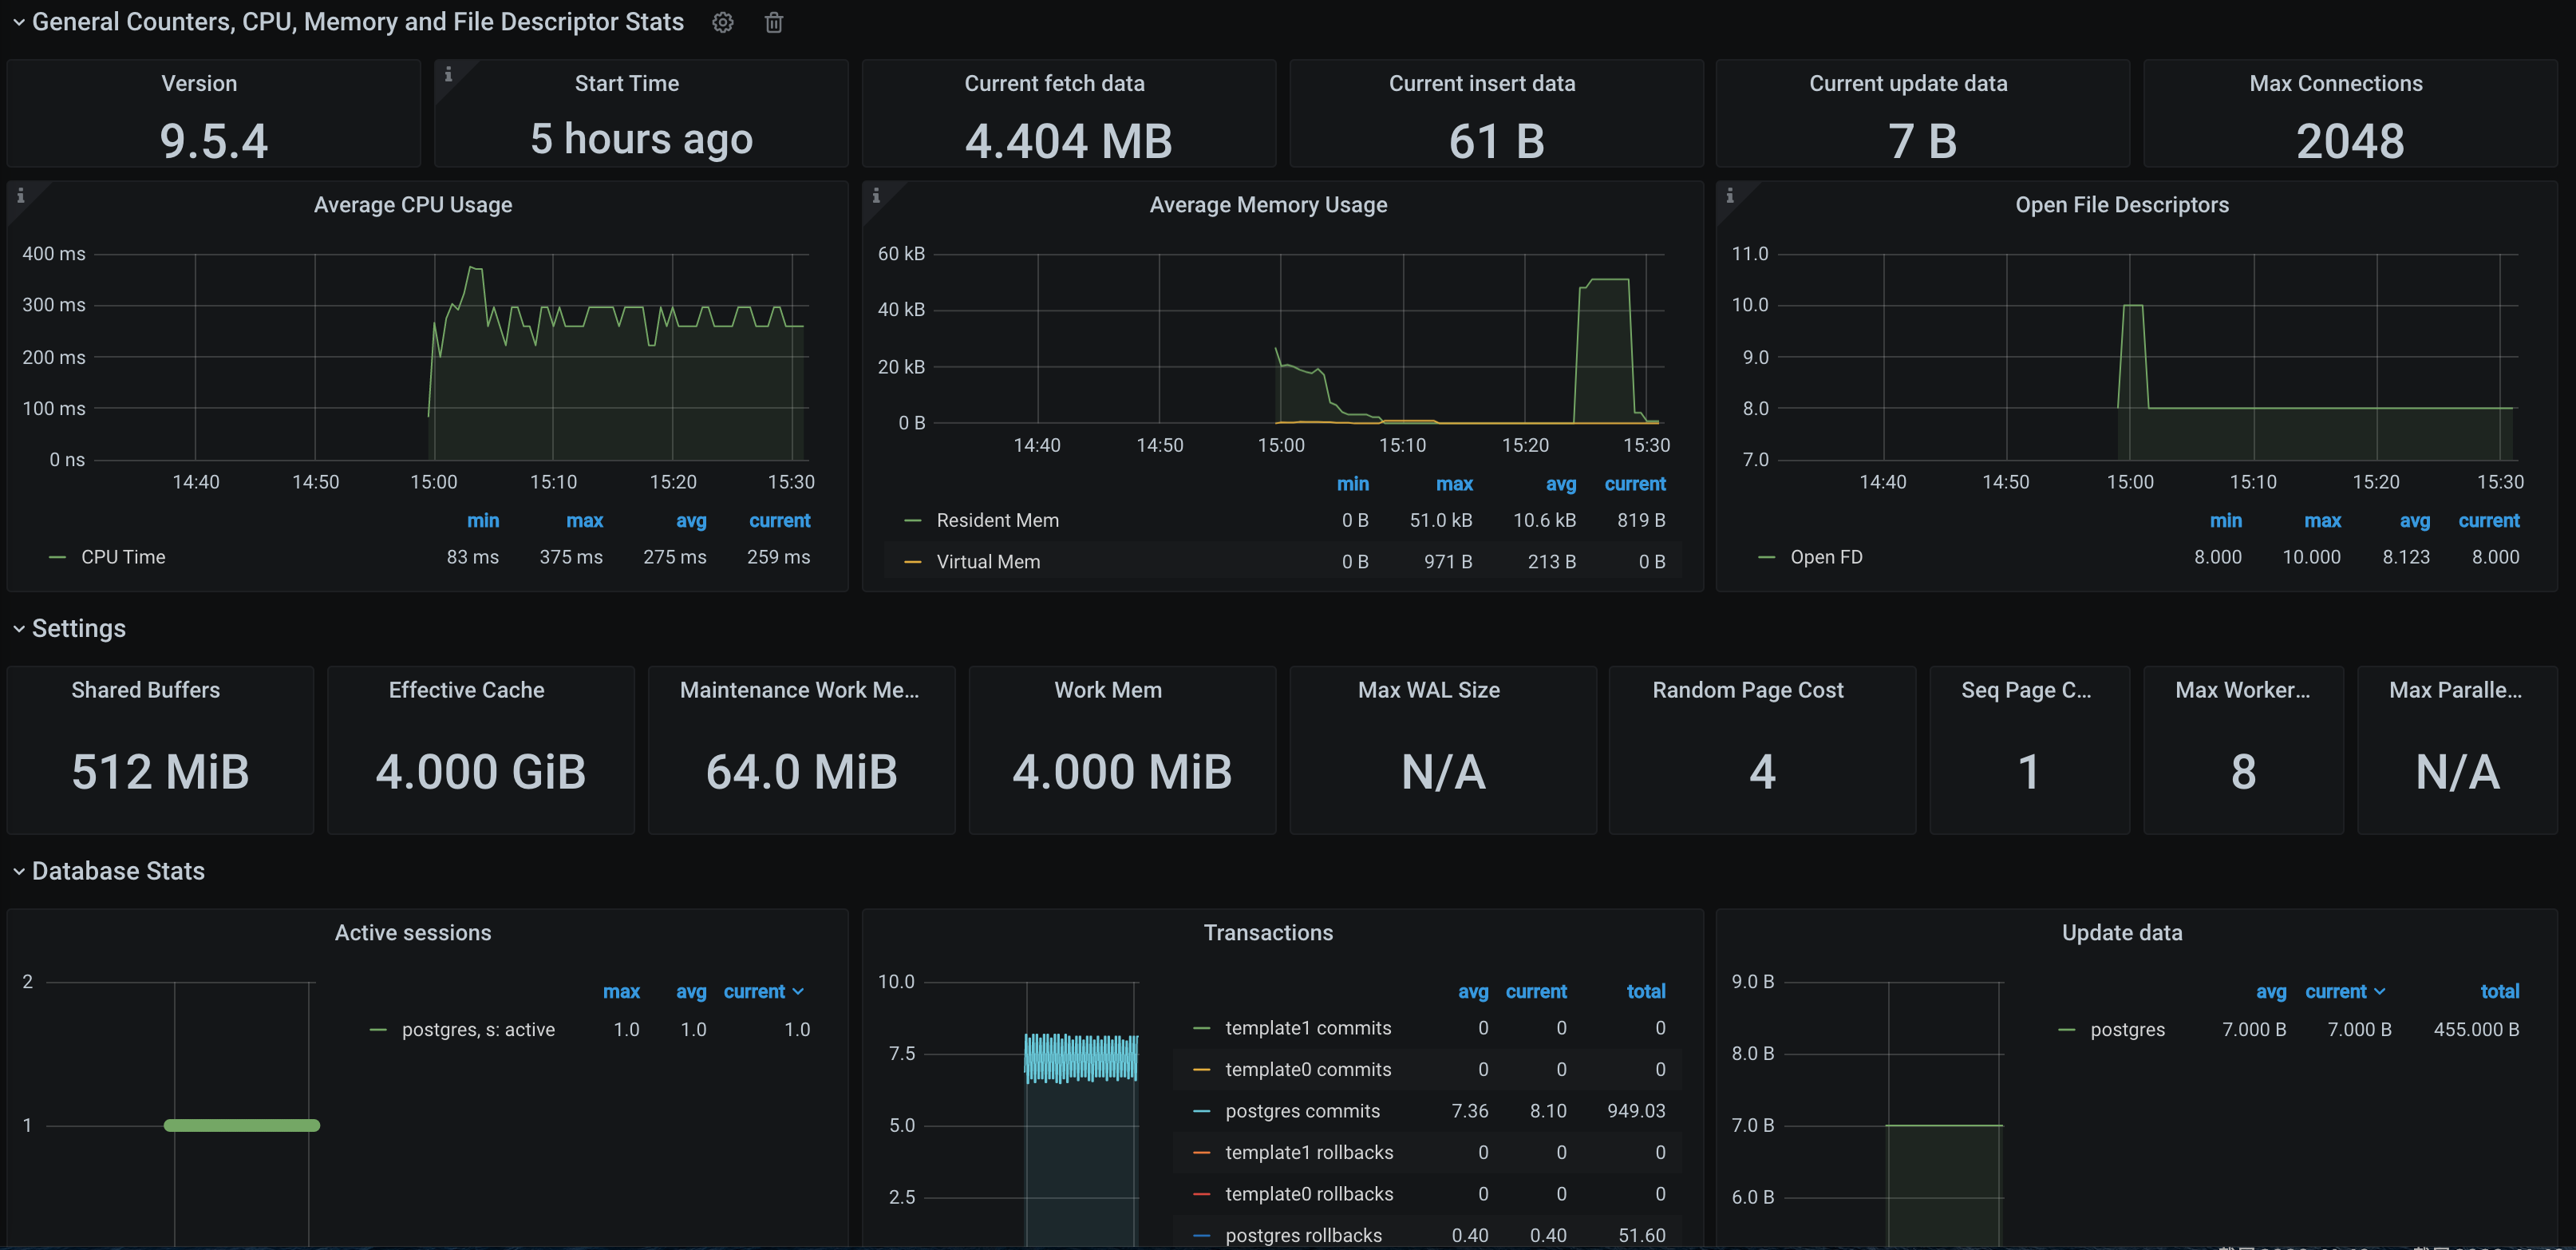
2. Enter Grafana, click the
icon to expand the monitoring dashboard, and click the name of the corresponding monitoring chart to view the monitoring data.
Integrating with alert feature
1. Log in to the TMP console and select the target TMP instance to enter the management page.
2. Click Alerting Rule and add the corresponding alerting rules. For more information, please see Creating Alerting Rule.
Note:
TMP will provide more PostgreSQL alerting templates in the near future.