tencent cloud

Tencent Cloud Observability Platform

Release Notes and Announcements
Release Notes
Product Introduction
Overview
Strengths
Basic Features
Basic Concepts
Use Cases
Use Limits
Purchase Guide
Tencent Cloud Product Monitoring
Application Performance Management
Mobile App Performance Monitoring
Real User Monitoring
Cloud Automated Testing
Prometheus Monitoring
Grafana
EventBridge
PTS
Quick Start
Monitoring Overview
Instance Group
Tencent Cloud Product Monitoring
Application Performance Management
Real User Monitoring
Cloud Automated Testing
Performance Testing Service
Prometheus Getting Started
Grafana
Dashboard Creation
EventBridge
Alarm Service
Cloud Product Monitoring
Tencent Cloud Service Metrics
Operation Guide
CVM Agents
Cloud Product Monitoring Integration with Grafana
Troubleshooting
Practical Tutorial
Application Performance Management
Product Introduction
Access Guide
Operation Guide
Practical Tutorial
Parameter Information
FAQs
Mobile App Performance Monitoring
Overview
Operation Guide
Access Guide
Practical Tutorial
Tencent Cloud Real User Monitoring
Product Introduction
Operation Guide
Connection Guide
FAQs
Cloud Automated Testing
Product Introduction
Operation Guide
FAQs
Performance Testing Service
Overview
Operation Guide
Practice Tutorial
JavaScript API List
FAQs
Prometheus Monitoring
Product Introduction
Access Guide
Operation Guide
Practical Tutorial
Terraform
FAQs
Grafana
Product Introduction
Operation Guide
Guide on Grafana Common Features
FAQs
Dashboard
Overview
Operation Guide
Alarm Management
Console Operation Guide
Troubleshooting
FAQs
EventBridge
Product Introduction
Operation Guide
Practical Tutorial
FAQs
Report Management
FAQs
General
Alarm Service
Concepts
Monitoring Charts
CVM Agents
Dynamic Alarm Threshold
CM Connection to Grafana
Documentation Guide
Related Agreements
Application Performance Management Service Level Agreement
APM Privacy Policy
APM Data Processing And Security Agreement
RUM Service Level Agreement
Mobile Performance Monitoring Service Level Agreement
Cloud Automated Testing Service Level Agreement
Prometheus Service Level Agreement
TCMG Service Level Agreements
PTS Service Level Agreement
PTS Use Limits
Cloud Monitor Service Level Agreement
API Documentation
History
Introduction
API Category
Making API Requests
Monitoring Data Query APIs
Alarm APIs
Legacy Alert APIs
Notification Template APIs
TMP APIs
Grafana Service APIs
Event Center APIs
TencentCloud Managed Service for Prometheus APIs
Monitoring APIs
Data Types
Error Codes
Glossary

Rule Management

PDF
포커스 모드
폰트 크기
마지막 업데이트 시간: 2024-11-01 10:01:08

Overview

You can manage the TMP recording rules in the TMP console to avoid the hassle of having to modify the configuration file in native Prometheus.

Preparations

1. Log in to the TMP console.
2. Create a TMP instance as instructed in Creating Instance.
3. Enter the TMP instance management page through the instance list.
4. Manage recording rules as instructed in Overview.

Directions

Creating a Rule

1. On the instance management page, select the instance on which you want to perform the pre-aggregation operation, and enter the instance details page.
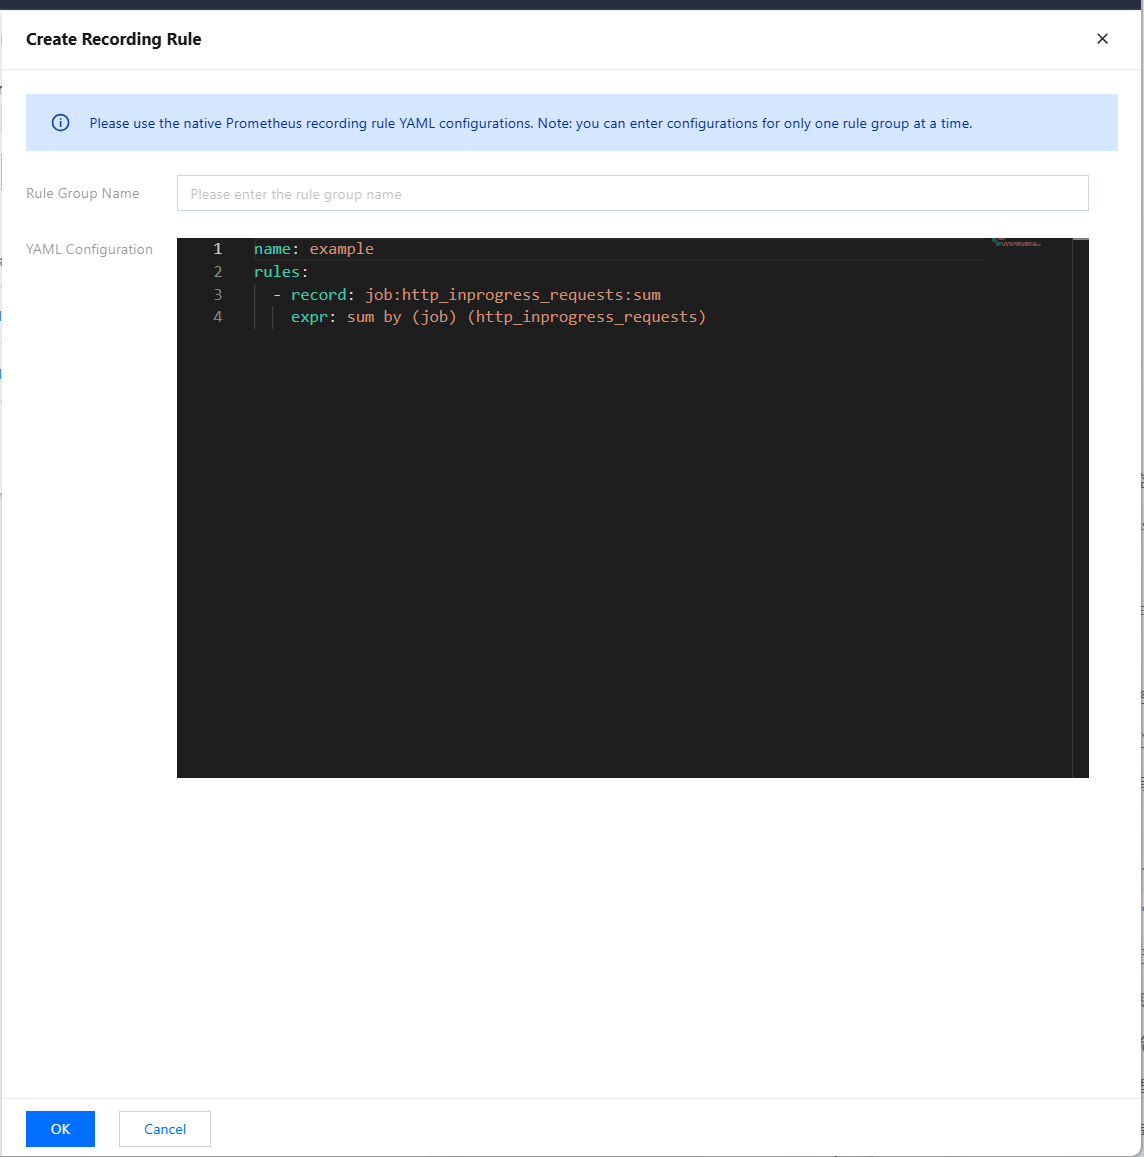
2. In the navigation bar at the top, choose Recording Rule > Create Recording Rule to go to the rule creation page. Adjust the expression and the new metric name to be generated according to your actual needs, as shown below. For specific terms, see Overview.


3. Click OK.

Managing a Rule

In the rule list, you can temporarily Disable rules or enable rules that are not enabled. Once disabled, a rule will stop working, and the collection of related recording metrics will also stop.

Deleting a Rule

1. You can delete rules that are no longer used.
2. Select the rule to be deleted in the list and confirm in the pop-up window. Once deleted, a rule will stop working.


도움말 및 지원

문제 해결에 도움이 되었나요?

피드백