To avoid additional Ops workload caused by hundreds of similar alarms due to the same issue, we have introduced the alarm suppression feature. Alarm suppression means that if an alarm of a certain type is triggered, other related similar alarms will be suppressed. For example, if the alarm content is that a certain cluster is inaccessible, you can configure Inhibition rules to silence all other alarms related to that cluster.
2. In the Prometheus instance list, click Instance ID/Name.
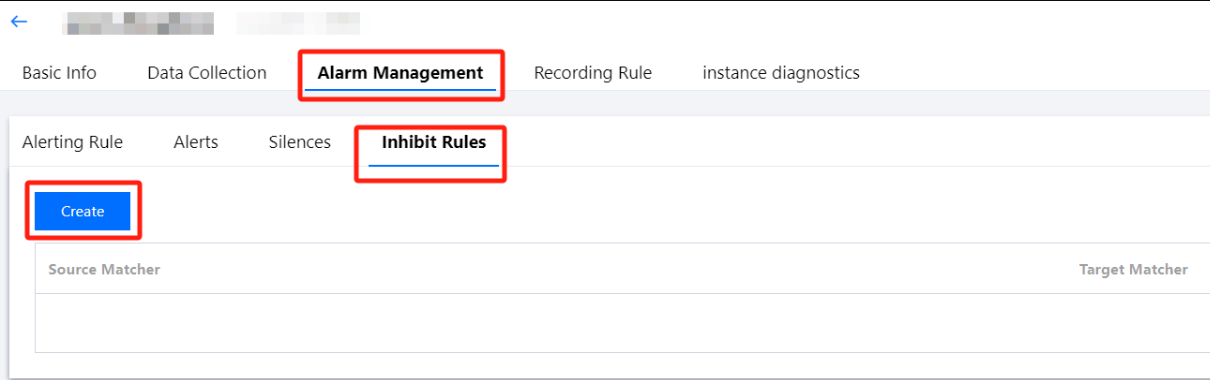
3. Enter the Prometheus Management Center, and click Alarm Management > Inhibit Rules > Create in the top navigation bar.
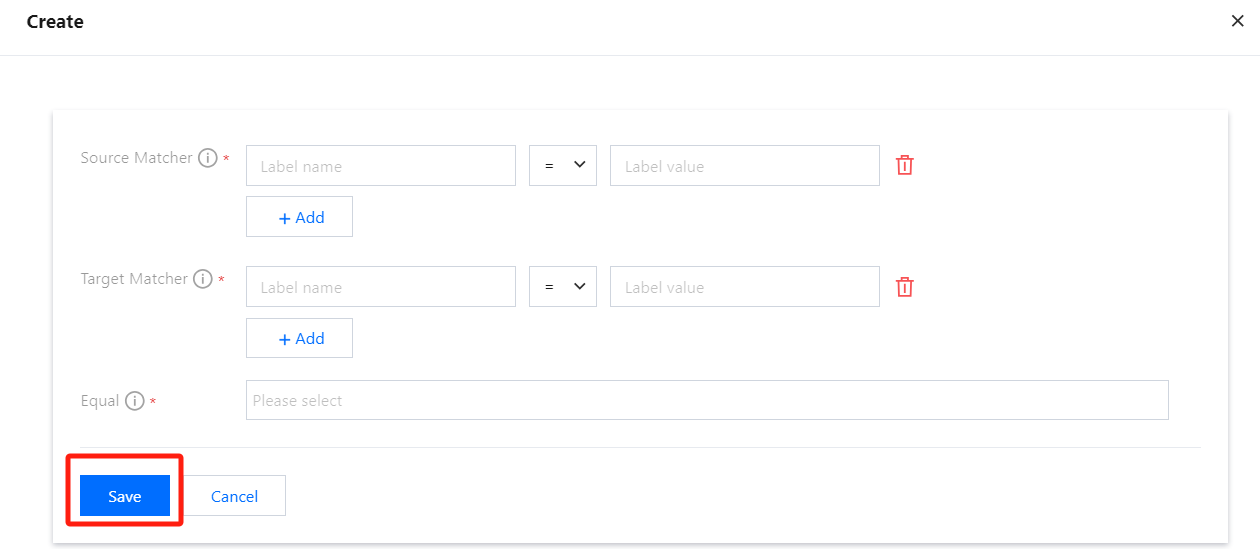
4. After navigating to the Create page, configure the suppression rules as prompted by the page, then click Save.
Parameter Description
Parameter
Description
Source Matcher
Triggered alarm. Select Label name, Condition, and Label value.
Target Matcher
Alarms to be silenced. Select Label name, Condition, and Label value.
Equal
The target and source alarm must have the same label value for the label name in the matching criteria. Select Label name.
Note:
Inhibition rules configuration: When there is an alarm (source) that meets a certain rule, the suppression rule will silence another alarm (target) that meets a different rule. The target and source alarm must have the same label value for the label name in the matching criteria.
To prevent self-suppression alarms, alarms that match both the target and source rules cannot be suppressed by other alarms that also match both target and source rules (including themselves). Therefore, it is recommended to design the source and target rules of alarms in such a way that no alarm matches both the source and target rules simultaneously.
Example
Use Cases: Alarm on High Server CPU Load
Scenario Description:
In a monitoring system, two alarms are configured:
Alarm A: CPU load exceeds 90%.
Alarm B: System response time exceeds 500 ms.
Both alarms are triggered by the same cause: high CPU load on the server, leading to degraded system performance.
The policy rules for Alarm A are as follows:alert: HighCPUUsage
expr: avg(rate(cpu_usage_seconds_total[5m])) by (instance) > 0.9The policy rules for Alarm B are as follows:alert: HighResponseTime
expr: avg(response_time_seconds) by (instance) > 0.5The Inhibition rule configuration is as follows:
Source: alert=HighCPUUsage
Target: alert=HighResponseTime
Matching criteria: instance
Overall Effect:
The average rate of the cpu_usage_seconds_total metric over 5 minutes is 95%. If the metric's label instance=instanceX, Alarm A will be triggered, and an alarm notification will be sent.
The average value of the response_time_seconds metric is 0.8s. If the metric's label instance=instanceX, Alarm B will be triggered, but no alarm notification will be sent because the Inhibition rule is matched.