Analyze various exceptions, such as JavaScript errors, Promise errors, Ajax request exceptions, JavaScript loading exceptions, and API return code exceptions.
Page view
Display page view metrics (UV and PV) and support multidimensional page view analysis.
API monitoring
Monitor call conditions, such as HTTP code success rate, retcode success rate, and API request duration.
Static resource
Static resources in a frontend HTML page include JavaScript, CSS, and image files. If the loading of such files goes too slowly or fails, the page will get stuck and stop responding.
Custom speed test
Custom data reporting. You need to select an application connection method as instructed in Connection Guide and then use the reportTime or time and timeEnd method to customize breakpoints to report data as instructed in Instance Method.
Custom event
Custom event reporting. You need to select an application connection method as instructed in Connection Guide and then use the reportEvent method to customize events to be reported as instructed in Instance Method.
Note:
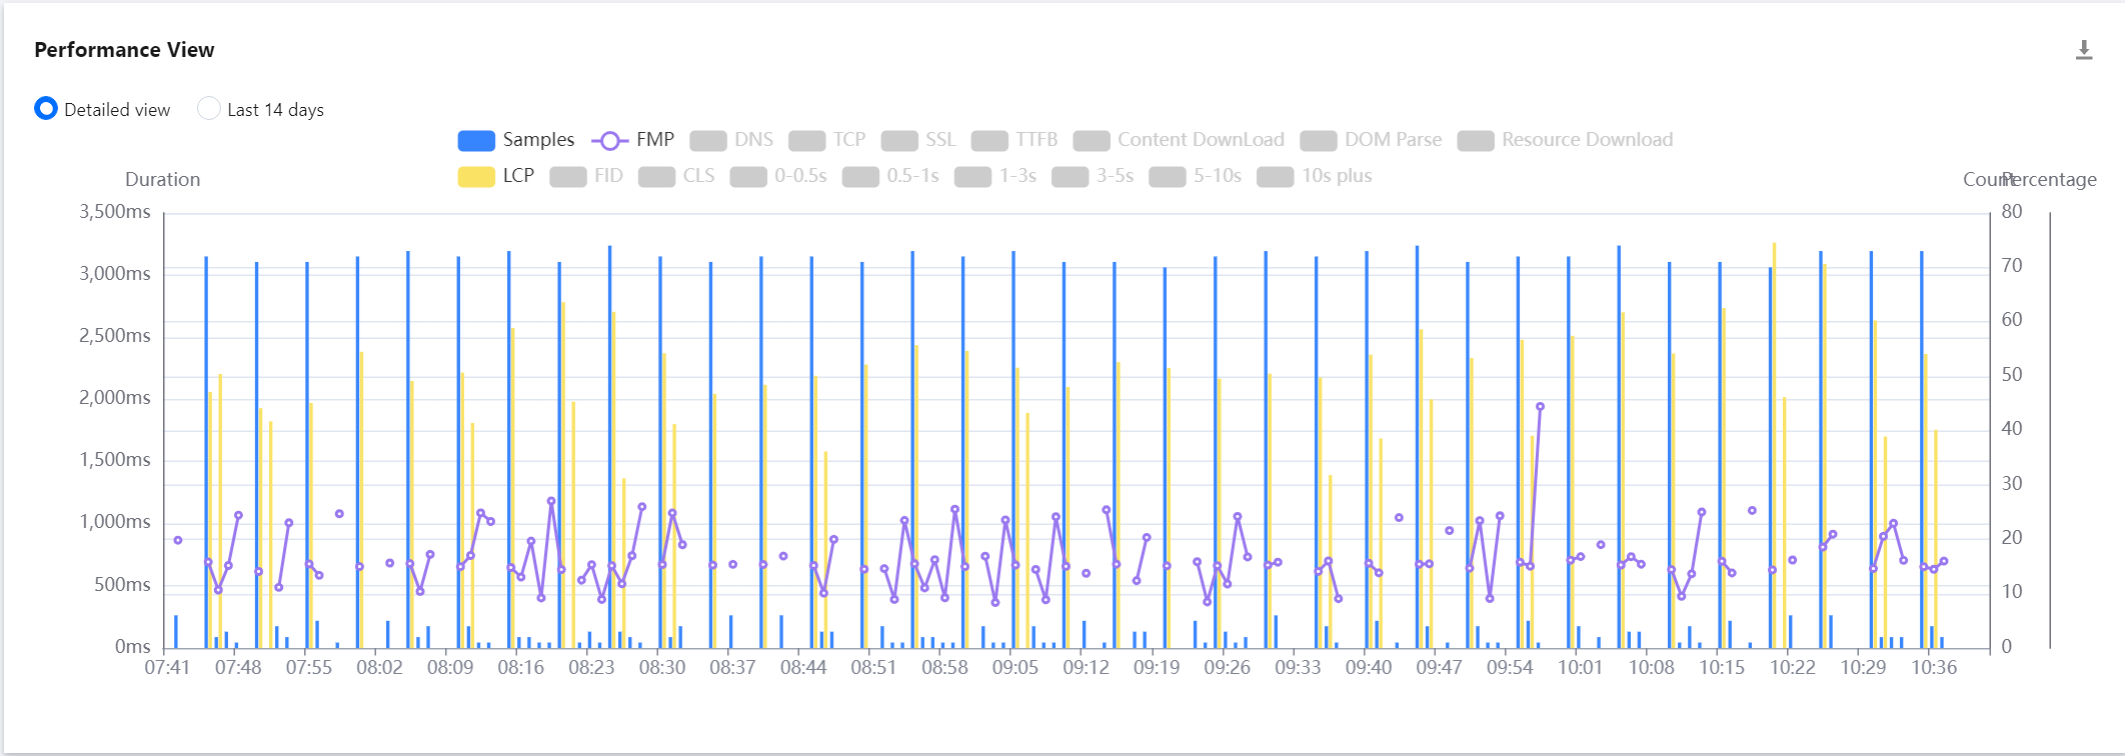
LCP indicates the duration to render the largest content element visible in the viewport, from when the user requests the URL.
The overview view displays the change trends of key page performance metrics.
You can click a legend above the chart to hide or show the corresponding data.
You can display the trend for the specified time period or the past 14 days.
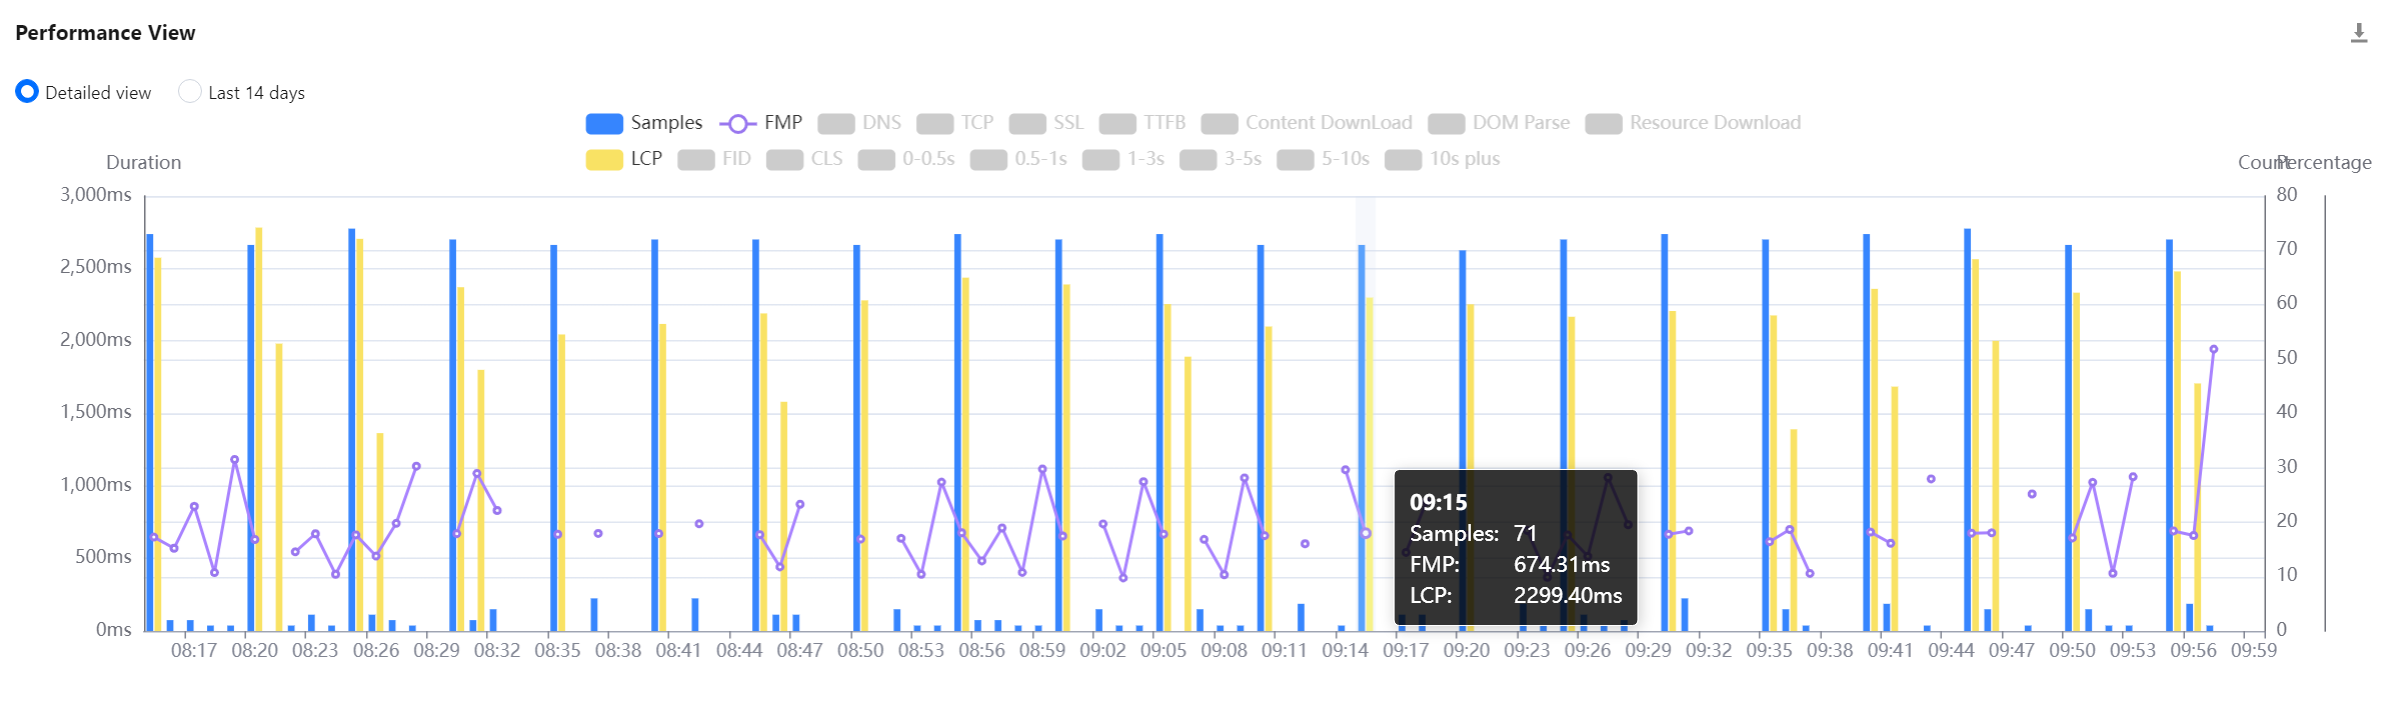
You can drag the curve to display the FMP at a specific time point.
You can mouse over the chart and scroll up and down to adjust its time span.
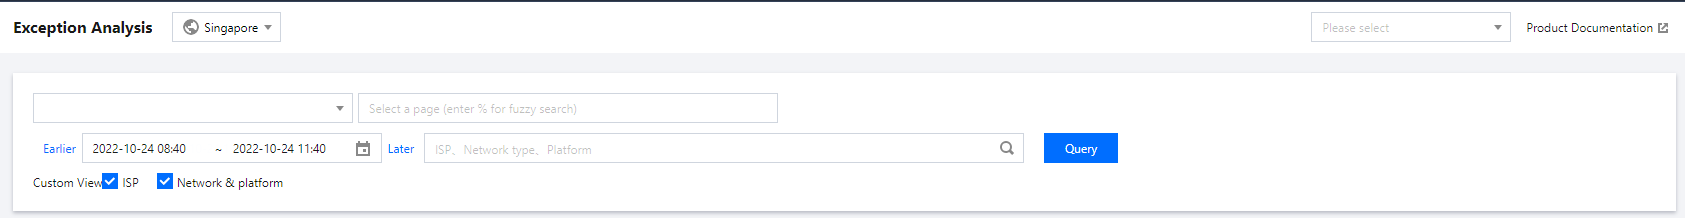
Custom view selection
You can select the views to be displayed at the top of the page.
After you select the views, frontend performance data in multiple dimensions is displayed at the bottom of the page. It facilitates you to analyze the frontend performance data in multiple dimensions.
Other views
View Name
Description
Network/Platform view
It uses a pie chart to display the number of exceptions, percentage, and firstScreenTime of pages from each network type/platform, such as 3G, 4G, and Wi-Fi networks as well as macOS, Windows, and iOS platforms.
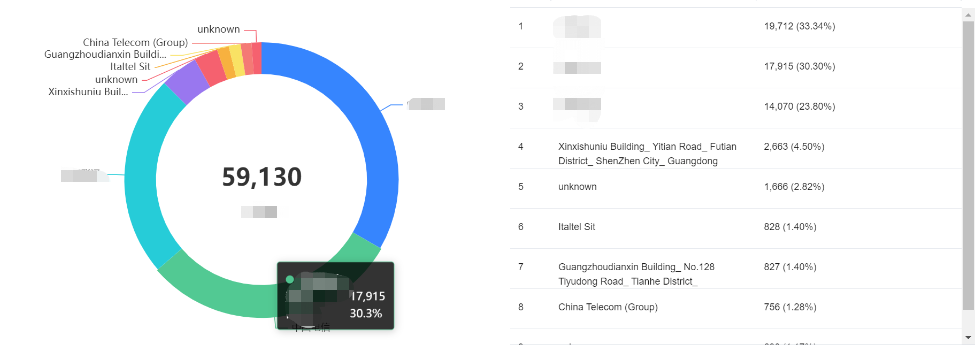
ISP view
It uses a pie chart to display the number of exceptions, percentage, and firstScreenTime of pages from each ISP such as China Mobile, China Telecom, and China Unicom.
Region view
It uses a pie chart to display the number of exceptions, percentage, and firstScreenTime of pages from each region.
Brand/Model view
It uses a pie chart to display the number of exceptions, percentage, and firstScreenTime of pages from each mobile phone brand/model.
Browser view
It uses a pie chart to display the number of exceptions, percentage, and firstScreenTime of pages from each browser.
Version view
It uses a pie chart to display the number of exceptions, percentage, and firstScreenTime of pages from each application version. You can use new Aegis to pass in version during application connection to customize the version information related to development. The SDK version is used by default.
ext1/ext2/ext3 views
They are custom views. You can customize their parameters passed in during reporting. For details, see Connection Guide.