This document describes how to create a file transfer task to test the speed of file upload/download and get the speed of application data transfer, which reflects the actual bandwidth fluctuations.
3. Click Create task at the top of the Tasks page.
4. Configure the basic information as follows:
Configuration Item
Description
Test mode
Select Regular test.
Task type
Select File transfer (upload/download) on the PC or mobile.
Test address
Enter the target web application address starting with http:// or https://.
For example:
1. Domain: http://www.tencent.com
2. Domain and port: http://www.tencent.com:80
Note: You need to enter the port when using TCP or UDP in Ping monitoring.
Test task name
Enter a custom test task name.
Test frequency
It can be 1 minute, 5 minutes, 10 minutes, 15 minutes, 30 minutes, 60 minutes, or 120 minutes. For example, if you select 5 minutes, each testing node will be tested once every five minutes.
5. Configure the testing node as follows:
5.1 Select the method: You can select Recommended location group or Custom location group (the former contains common nodes).
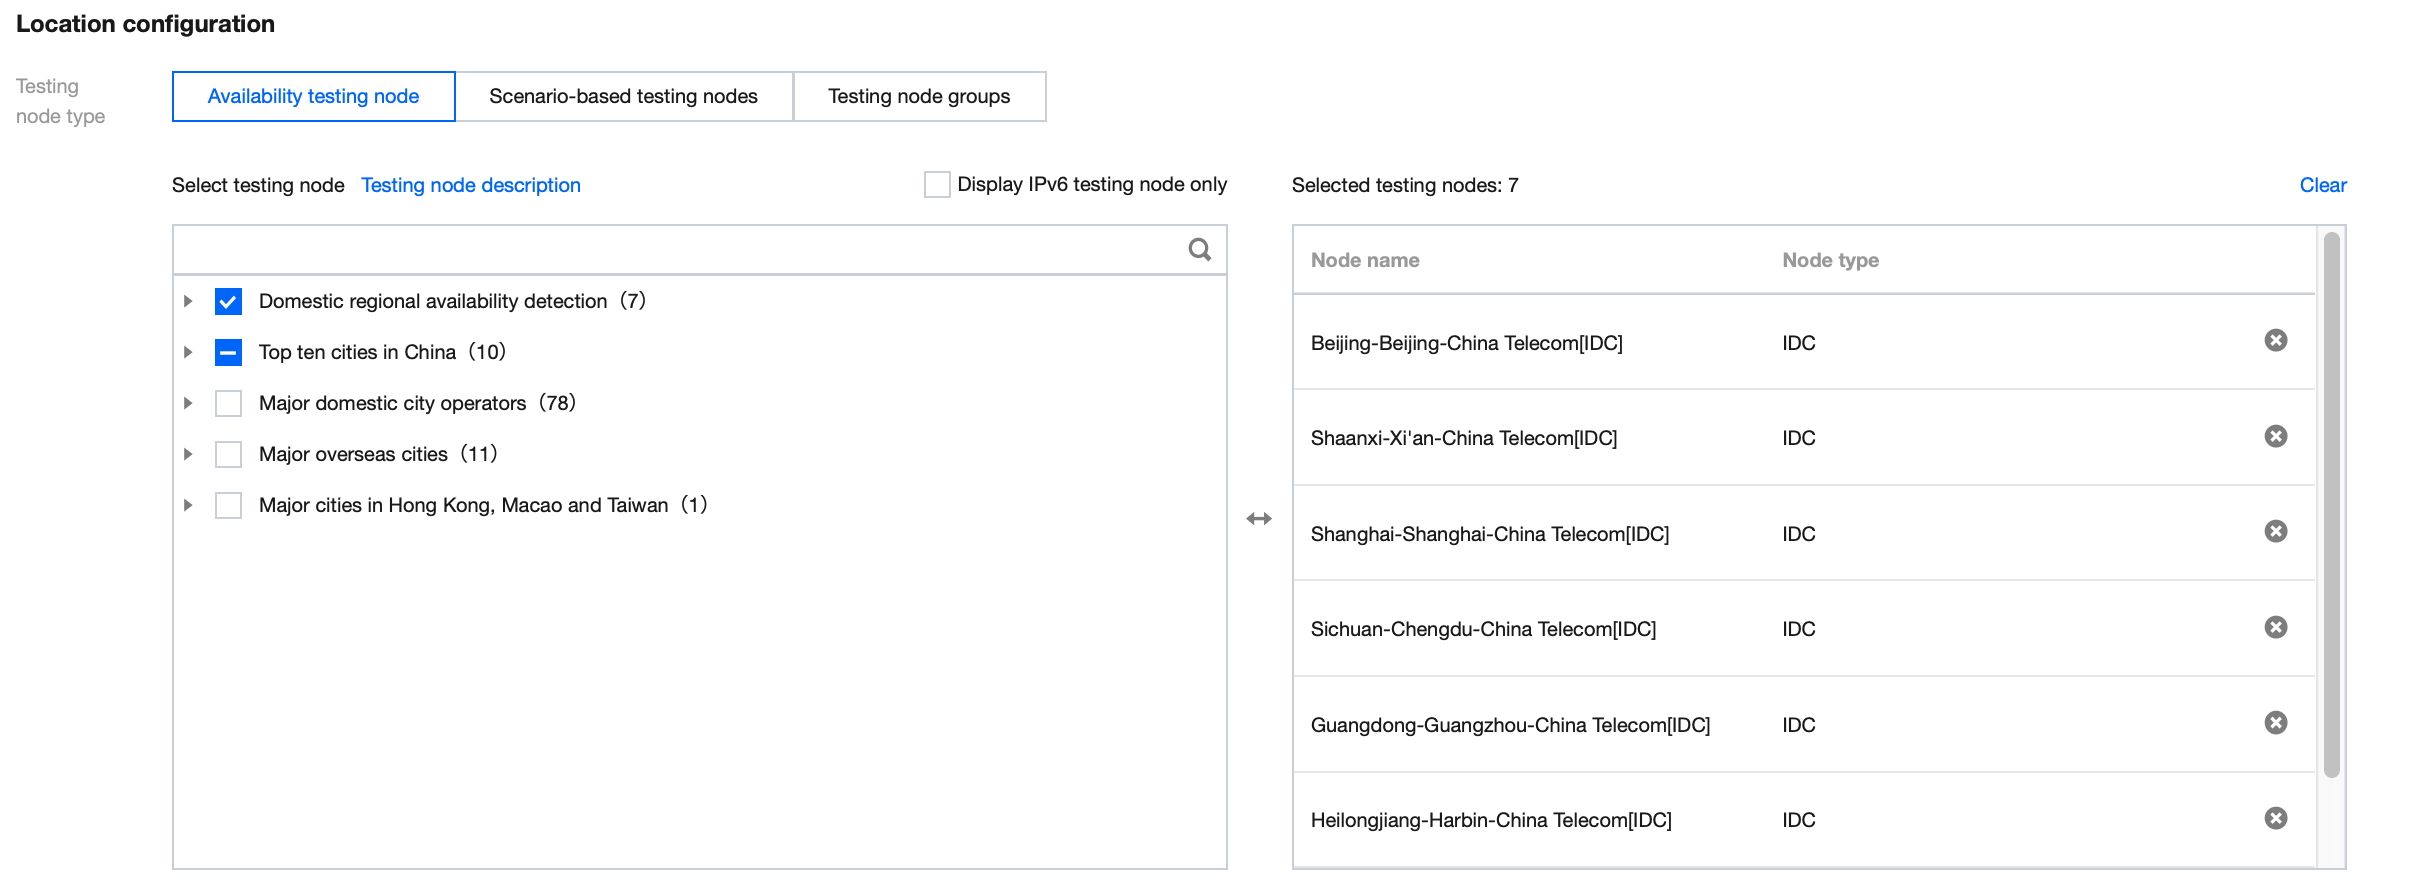
5.2 Select the location:
Availability testing nodes: Only network quality and API monitoring tasks are supported. This option is suitable for network quality monitoring, API availability monitoring, and hijacking and blocking detection.
Scenario-based testing nodes: This option is suitable for page user experience and streaming lag monitoring, availability testing under poor network conditions, CDN selection, and path optimization. It covers global IDC, PC, and mobile testing nodes.
Recommended testing node group: Commonly used and recommended testing nodes.
Custom testing node group: Select the region, node type, and testing node on the right box. Node types are as detailed below:
Testing node Type
Description
IDC
It is the testing node deployed on the PC to test the PC user experience.
LastMile
It is the testing node deployed on the end user's PC to test the end user's experience on the PC.
My testing node group: You can select a common testing node group in Scenario-based testing nodes and click Create testing node group in the bottom-right corner. Then, you can directly select a common testing node you created from My testing node group when creating a task.
Suggestions for selection
IDC and LastMile have different network environments, and the former is more stable than the latter.
To test the business availability, you can select the more stable IDC.
To check the access experience and network conditions of end users, we recommend you select LastMile or Mobile to simulate the user access to an application.
6. Configure the test parameters (optional) as follows:
File upload:
Configuration Item
Description
Default Value
IP type
It can be Auto, IPv4, or IPv6.
Auto
Upload method
It can be POST or PUT.
POST
Download URL of the file to be uploaded
The specified file will be downloaded through the URL for the upload task. The file size should not exceed the set transferred file size.
-
File MD5
It is optional. If it is not specified, the file to be uploaded will be automatically generated by the testing node.
-
Transferred file size
Define the size of the file to be uploaded, which must be greater than 0 KB and smaller than or equal to 51,200 KB.
1,024 KB
Custom host
It supports polling by IP or random monitoring. Separate IP addresses by comma.
If the IP from the DNS query is not in the allowlist, hijacking occurred, and the hijacking result can be selected and viewed in the details of the testing statistics. For more information, see Hijacking Monitoring Parameter Description.
-
DNS hijacking blocklist
If the IP from the DNS query is in the blocklist, hijacking occurred, and the hijacking result can be selected and viewed in the details of the testing statistics. For more information, see Hijacking Monitoring Parameter Description.