tencent cloud

Tencent Cloud Observability Platform

Release Notes and Announcements
Release Notes
Product Introduction
Overview
Strengths
Basic Features
Basic Concepts
Use Cases
Use Limits
Purchase Guide
Tencent Cloud Product Monitoring
Application Performance Management
Mobile App Performance Monitoring
Real User Monitoring
Cloud Automated Testing
Prometheus Monitoring
Grafana
EventBridge
PTS
Quick Start
Monitoring Overview
Instance Group
Tencent Cloud Product Monitoring
Application Performance Management
Real User Monitoring
Cloud Automated Testing
Performance Testing Service
Prometheus Getting Started
Grafana
Dashboard Creation
EventBridge
Alarm Service
Cloud Product Monitoring
Tencent Cloud Service Metrics
Operation Guide
CVM Agents
Cloud Product Monitoring Integration with Grafana
Troubleshooting
Practical Tutorial
Application Performance Management
Product Introduction
Access Guide
Operation Guide
Practical Tutorial
Parameter Information
FAQs
Mobile App Performance Monitoring
Overview
Operation Guide
Access Guide
Practical Tutorial
Tencent Cloud Real User Monitoring
Product Introduction
Operation Guide
Connection Guide
FAQs
Cloud Automated Testing
Product Introduction
Operation Guide
FAQs
Performance Testing Service
Overview
Operation Guide
Practice Tutorial
JavaScript API List
FAQs
Prometheus Monitoring
Product Introduction
Access Guide
Operation Guide
Practical Tutorial
Terraform
FAQs
Grafana
Product Introduction
Operation Guide
Guide on Grafana Common Features
FAQs
Dashboard
Overview
Operation Guide
Alarm Management
Console Operation Guide
Troubleshooting
FAQs
EventBridge
Product Introduction
Operation Guide
Practical Tutorial
FAQs
Report Management
FAQs
General
Alarm Service
Concepts
Monitoring Charts
CVM Agents
Dynamic Alarm Threshold
CM Connection to Grafana
Documentation Guide
Related Agreements
Application Performance Management Service Level Agreement
APM Privacy Policy
APM Data Processing And Security Agreement
RUM Service Level Agreement
Mobile Performance Monitoring Service Level Agreement
Cloud Automated Testing Service Level Agreement
Prometheus Service Level Agreement
TCMG Service Level Agreements
PTS Service Level Agreement
PTS Use Limits
Cloud Monitor Service Level Agreement
API Documentation
History
Introduction
API Category
Making API Requests
Monitoring Data Query APIs
Alarm APIs
Legacy Alert APIs
Notification Template APIs
TMP APIs
Grafana Service APIs
Event Center APIs
TencentCloud Managed Service for Prometheus APIs
Monitoring APIs
Data Types
Error Codes
Glossary

Tencent Cloud Service Integration

PDF
포커스 모드
폰트 크기
마지막 업데이트 시간: 2025-08-21 16:52:06
You can perform the following operations on the Tencent Cloud service integration page:
View available integrations
Manage installed integrations
Configure service roles

Prerequisites

1. Log in to the TCMG console.
2. Find the corresponding Grafana instance in the list and click its instance ID to enter the Grafana instance management page.
3. Click Tencent Cloud Service Integration on the left sidebar.

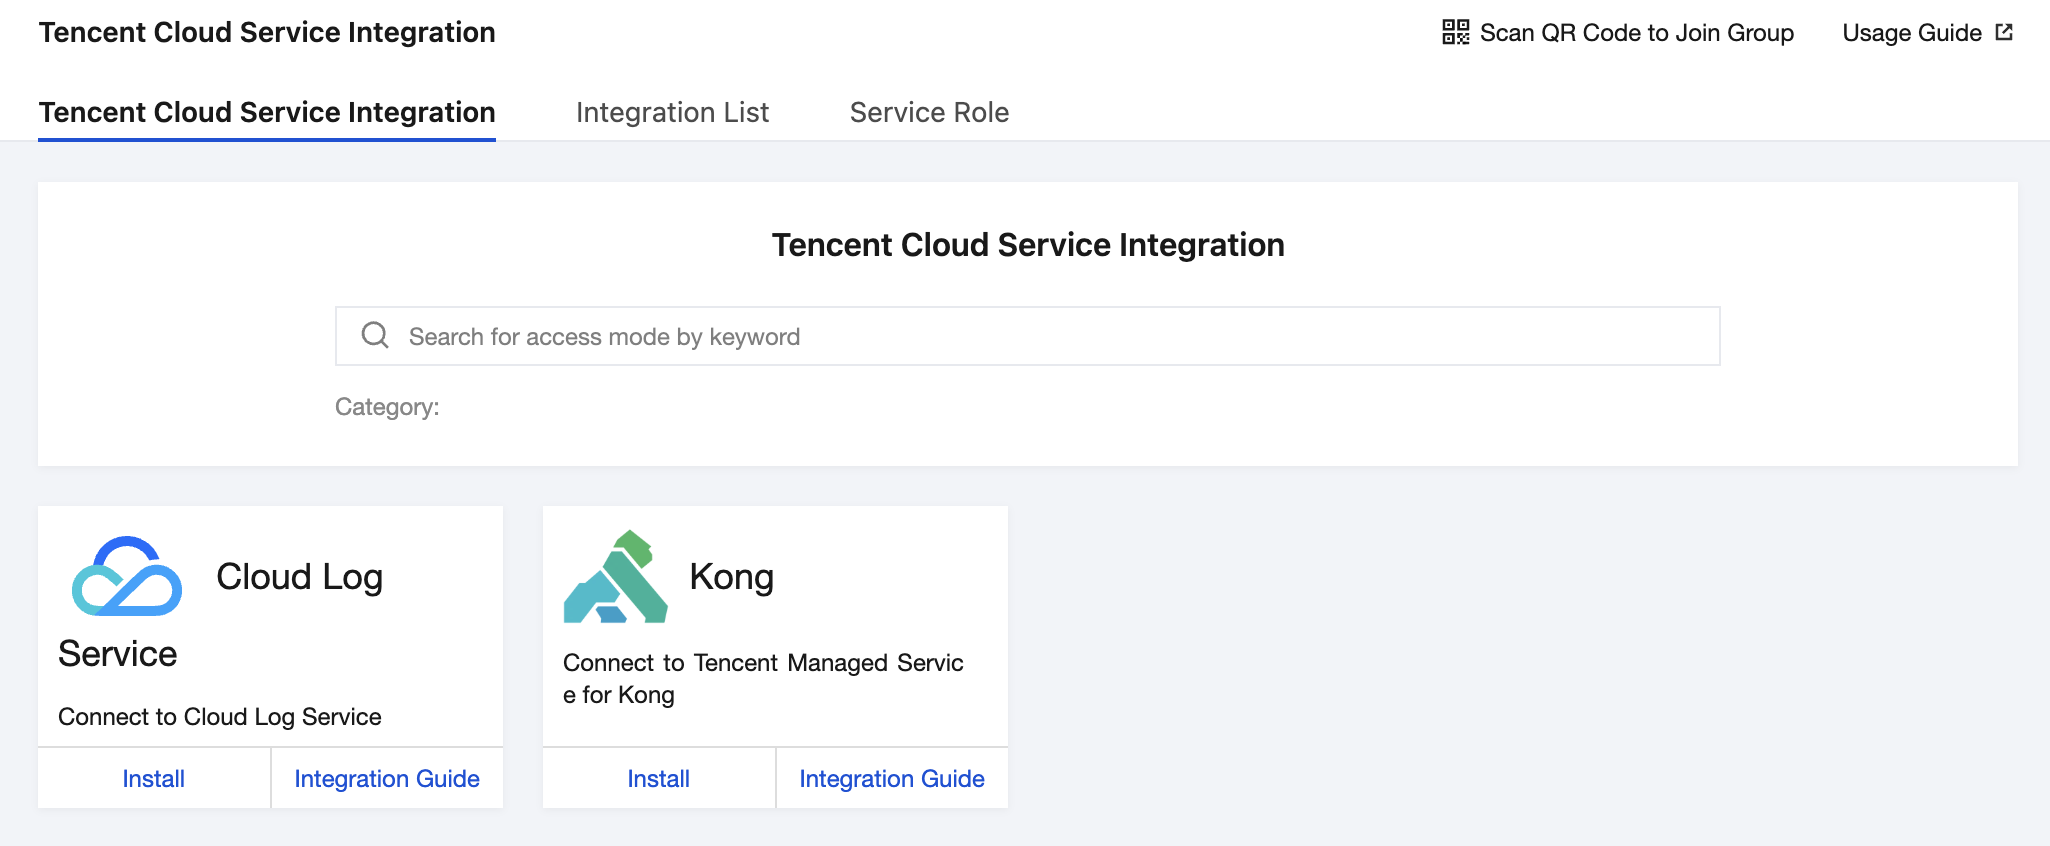
Viewing Available Integrations

On the Tencent Cloud Service Integration page, you can view and search for the available integrations of the current instance and install and connect them. After they are connected successfully, their monitoring data will be displayed on the Grafana dashboard.


Prometheus

1. Click Install below Prometheus to enter the installation page.
2. Configure the data source:
Data Source Name: enter the Prometheus instance ID.
Data Source Address: enter the private network address of Prometheus such as http://x.x.x.x:9090.
UID: it is the unique data source ID. We recommend you enter the Prometheus instance ID.
Account: Appid of your Tencent Cloud account, i.e., the account on the Prometheus instance details page.
Password: token on the Prometheus instance details page.
Dashboard Configuration: the dashboards in the Prometheus integration center will be automatically installed through this optional parameter, so you don't need to enter it.
3. After completing the configuration, click Save. After the system is rebooted, you can view the installed Prometheus data source on the Grafana data source page.

CLS

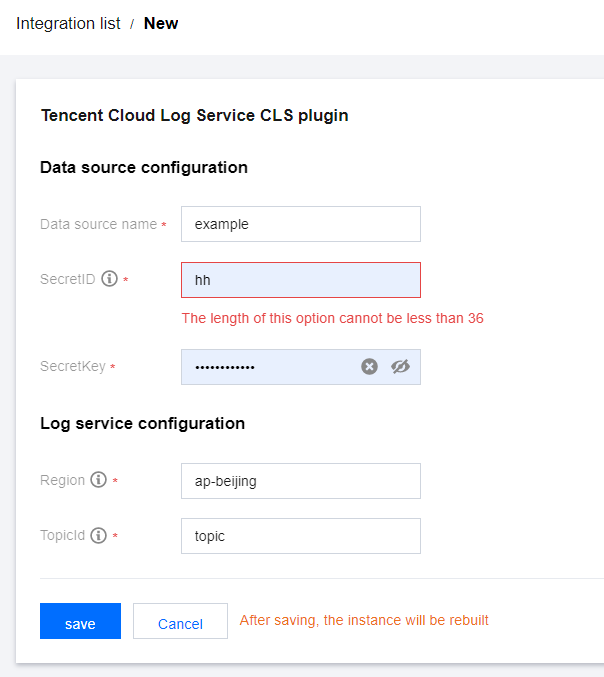
1. Click Install below CLS to enter the installation page.


2. Configure the data source:
Data Source Name: enter the data source name.
SecretID: enter your SecretID.
SecretKey: enter your SecretKey.
3. Configure CLS:
Region: region such as ap-guangzhou. For the complete list, see Available Regions.
TopicId: log topic. For more information, see Log Topic.
4. After completing the configuration, click Save. After the system is rebooted, you can view the installed CLS data source on the Grafana data source page.

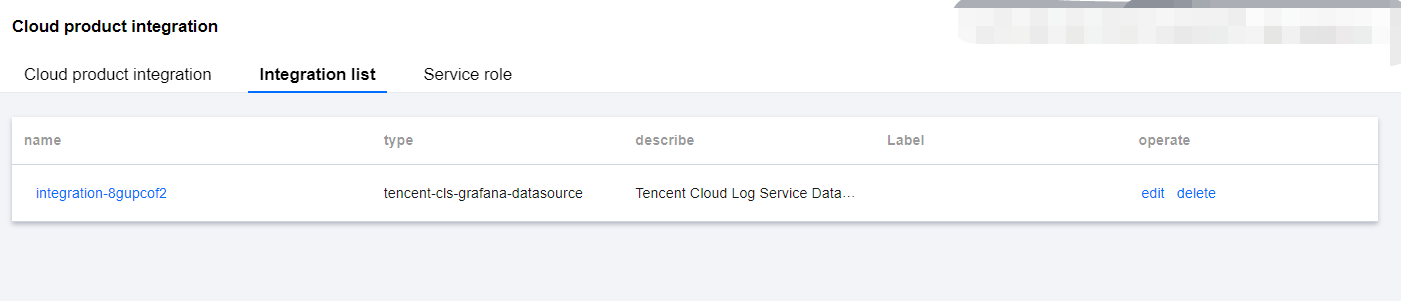
Managing Installed Integrations

Select Integration List to view the installed integrations, which may be installed by you or automatically by Tencent Cloud services through the binding relationship and can be deleted in the Operation column.


도움말 및 지원

문제 해결에 도움이 되었나요?

피드백