tencent cloud

Tencent Cloud Observability Platform

Release Notes and Announcements
Release Notes
Product Introduction
Overview
Strengths
Basic Features
Basic Concepts
Use Cases
Use Limits
Purchase Guide
Tencent Cloud Product Monitoring
Application Performance Management
Mobile App Performance Monitoring
Real User Monitoring
Cloud Automated Testing
Prometheus Monitoring
Grafana
EventBridge
PTS
Quick Start
Monitoring Overview
Instance Group
Tencent Cloud Product Monitoring
Application Performance Management
Real User Monitoring
Cloud Automated Testing
Performance Testing Service
Prometheus Getting Started
Grafana
Dashboard Creation
EventBridge
Alarm Service
Cloud Product Monitoring
Tencent Cloud Service Metrics
Operation Guide
CVM Agents
Cloud Product Monitoring Integration with Grafana
Troubleshooting
Practical Tutorial
Application Performance Management
Product Introduction
Access Guide
Operation Guide
Practical Tutorial
Parameter Information
FAQs
Mobile App Performance Monitoring
Overview
Operation Guide
Access Guide
Practical Tutorial
Tencent Cloud Real User Monitoring
Product Introduction
Operation Guide
Connection Guide
FAQs
Cloud Automated Testing
Product Introduction
Operation Guide
FAQs
Performance Testing Service
Overview
Operation Guide
Practice Tutorial
JavaScript API List
FAQs
Prometheus Monitoring
Product Introduction
Access Guide
Operation Guide
Practical Tutorial
Terraform
FAQs
Grafana
Product Introduction
Operation Guide
Guide on Grafana Common Features
FAQs
Dashboard
Overview
Operation Guide
Alarm Management
Console Operation Guide
Troubleshooting
FAQs
EventBridge
Product Introduction
Operation Guide
Practical Tutorial
FAQs
Report Management
FAQs
General
Alarm Service
Concepts
Monitoring Charts
CVM Agents
Dynamic Alarm Threshold
CM Connection to Grafana
Documentation Guide
Related Agreements
Application Performance Management Service Level Agreement
APM Privacy Policy
APM Data Processing And Security Agreement
RUM Service Level Agreement
Mobile Performance Monitoring Service Level Agreement
Cloud Automated Testing Service Level Agreement
Prometheus Service Level Agreement
TCMG Service Level Agreements
PTS Service Level Agreement
PTS Use Limits
Cloud Monitor Service Level Agreement
API Documentation
History
Introduction
API Category
Making API Requests
Monitoring Data Query APIs
Alarm APIs
Legacy Alert APIs
Notification Template APIs
TMP APIs
Grafana Service APIs
Event Center APIs
TencentCloud Managed Service for Prometheus APIs
Monitoring APIs
Data Types
Error Codes
Glossary
문서Tencent Cloud Observability PlatformPrometheus MonitoringPractical TutorialConfiguring a Public Network Address for a Prometheus Instance

Configuring a Public Network Address for a Prometheus Instance

PDF
포커스 모드
폰트 크기
마지막 업데이트 시간: 2025-04-23 15:51:29
This document introduces how to configure a public network address for Prometheus monitoring.

Practice Steps

Step 1: Purchasing a Prometheus Instance

1. Log in to TMP Console.
2. Click Create in the upper left corner to enter the Prometheus purchase page. You can purchase the corresponding instance based on your actual needs. For details, see Creating Instance.
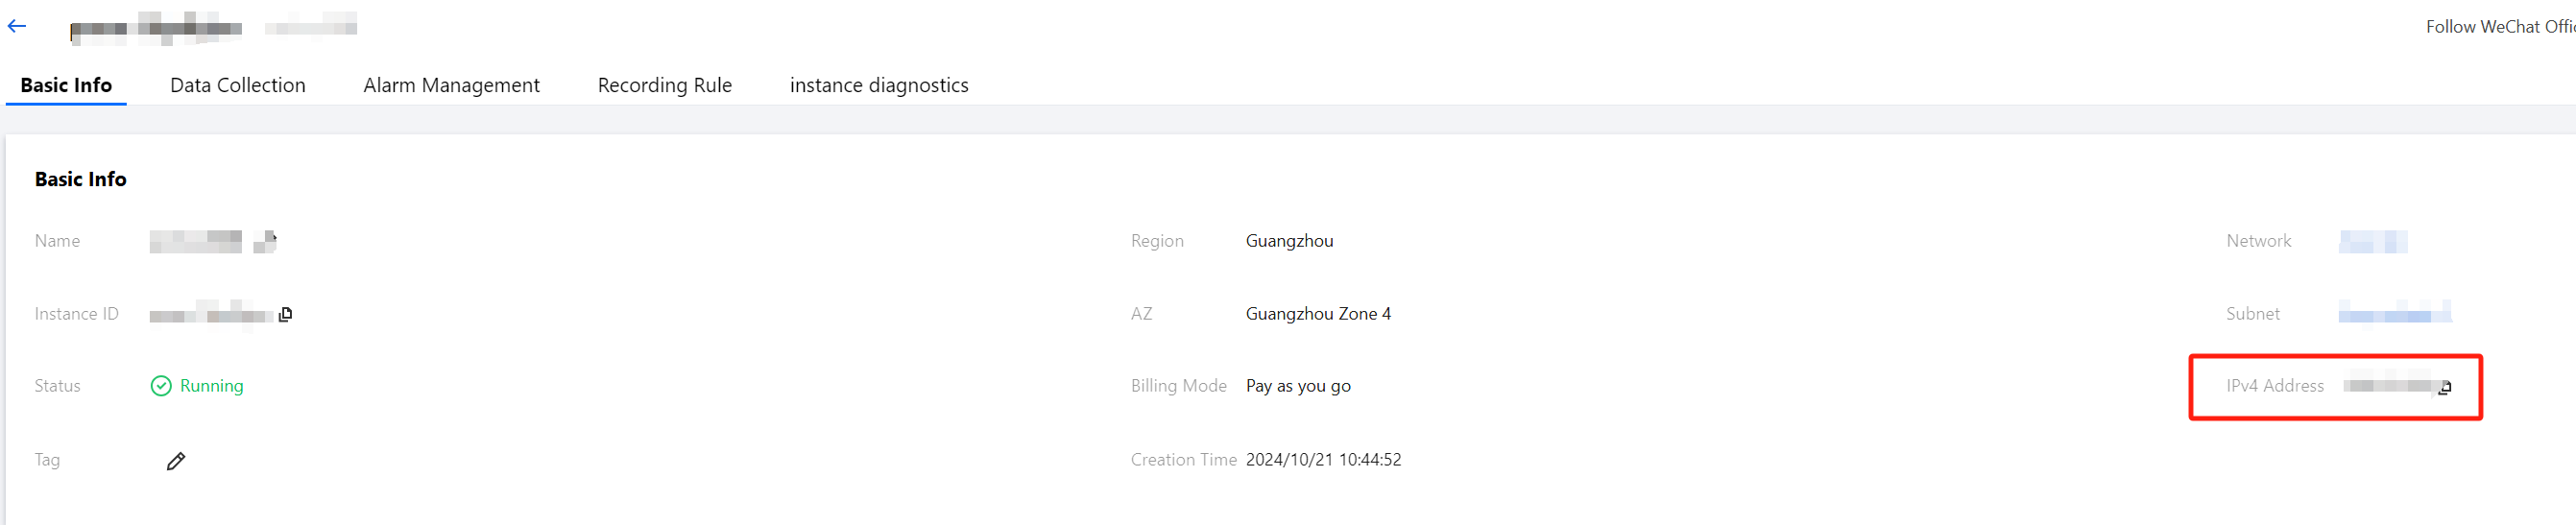
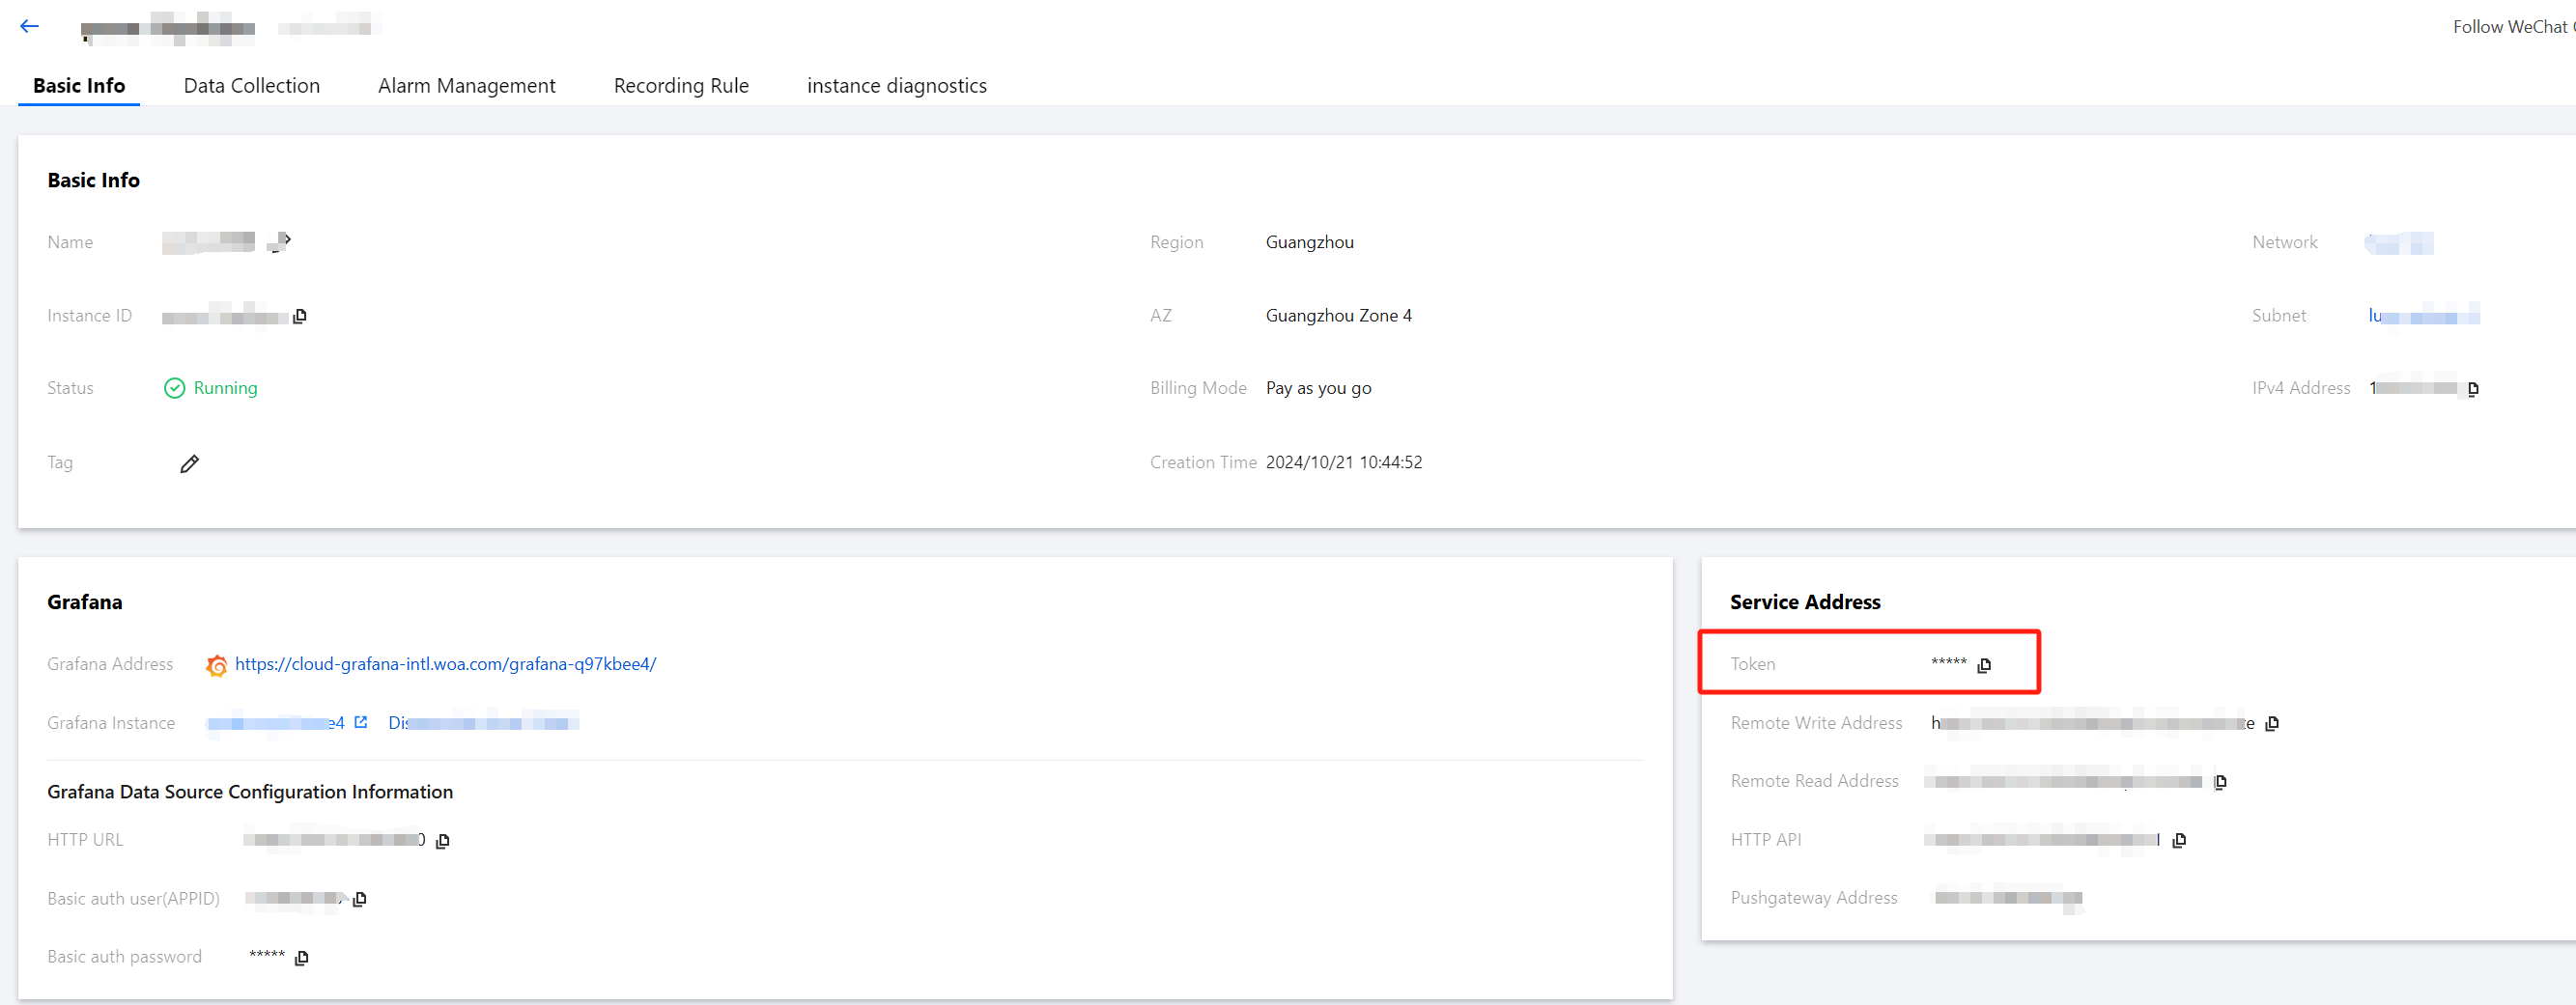
3. After successfully purchasing, click the ID/Name of the created instance to enter the Basic Info of the instance details page to obtain the Prometheus IPV4 address.


Step 2: Creating a CLB Instance for the Public Network

1. Go to the CLB Console and create a CLB instance.
2. Fill in the information as prompted. For detailed instructions, see Creating a CLB Instance.
Note:
To bind the private IP address of a Prometheus instance, you need to create a CLB instance under the same VPC as this Prometheus instance. If a CLB instance already exists on the public network, no creation is required.
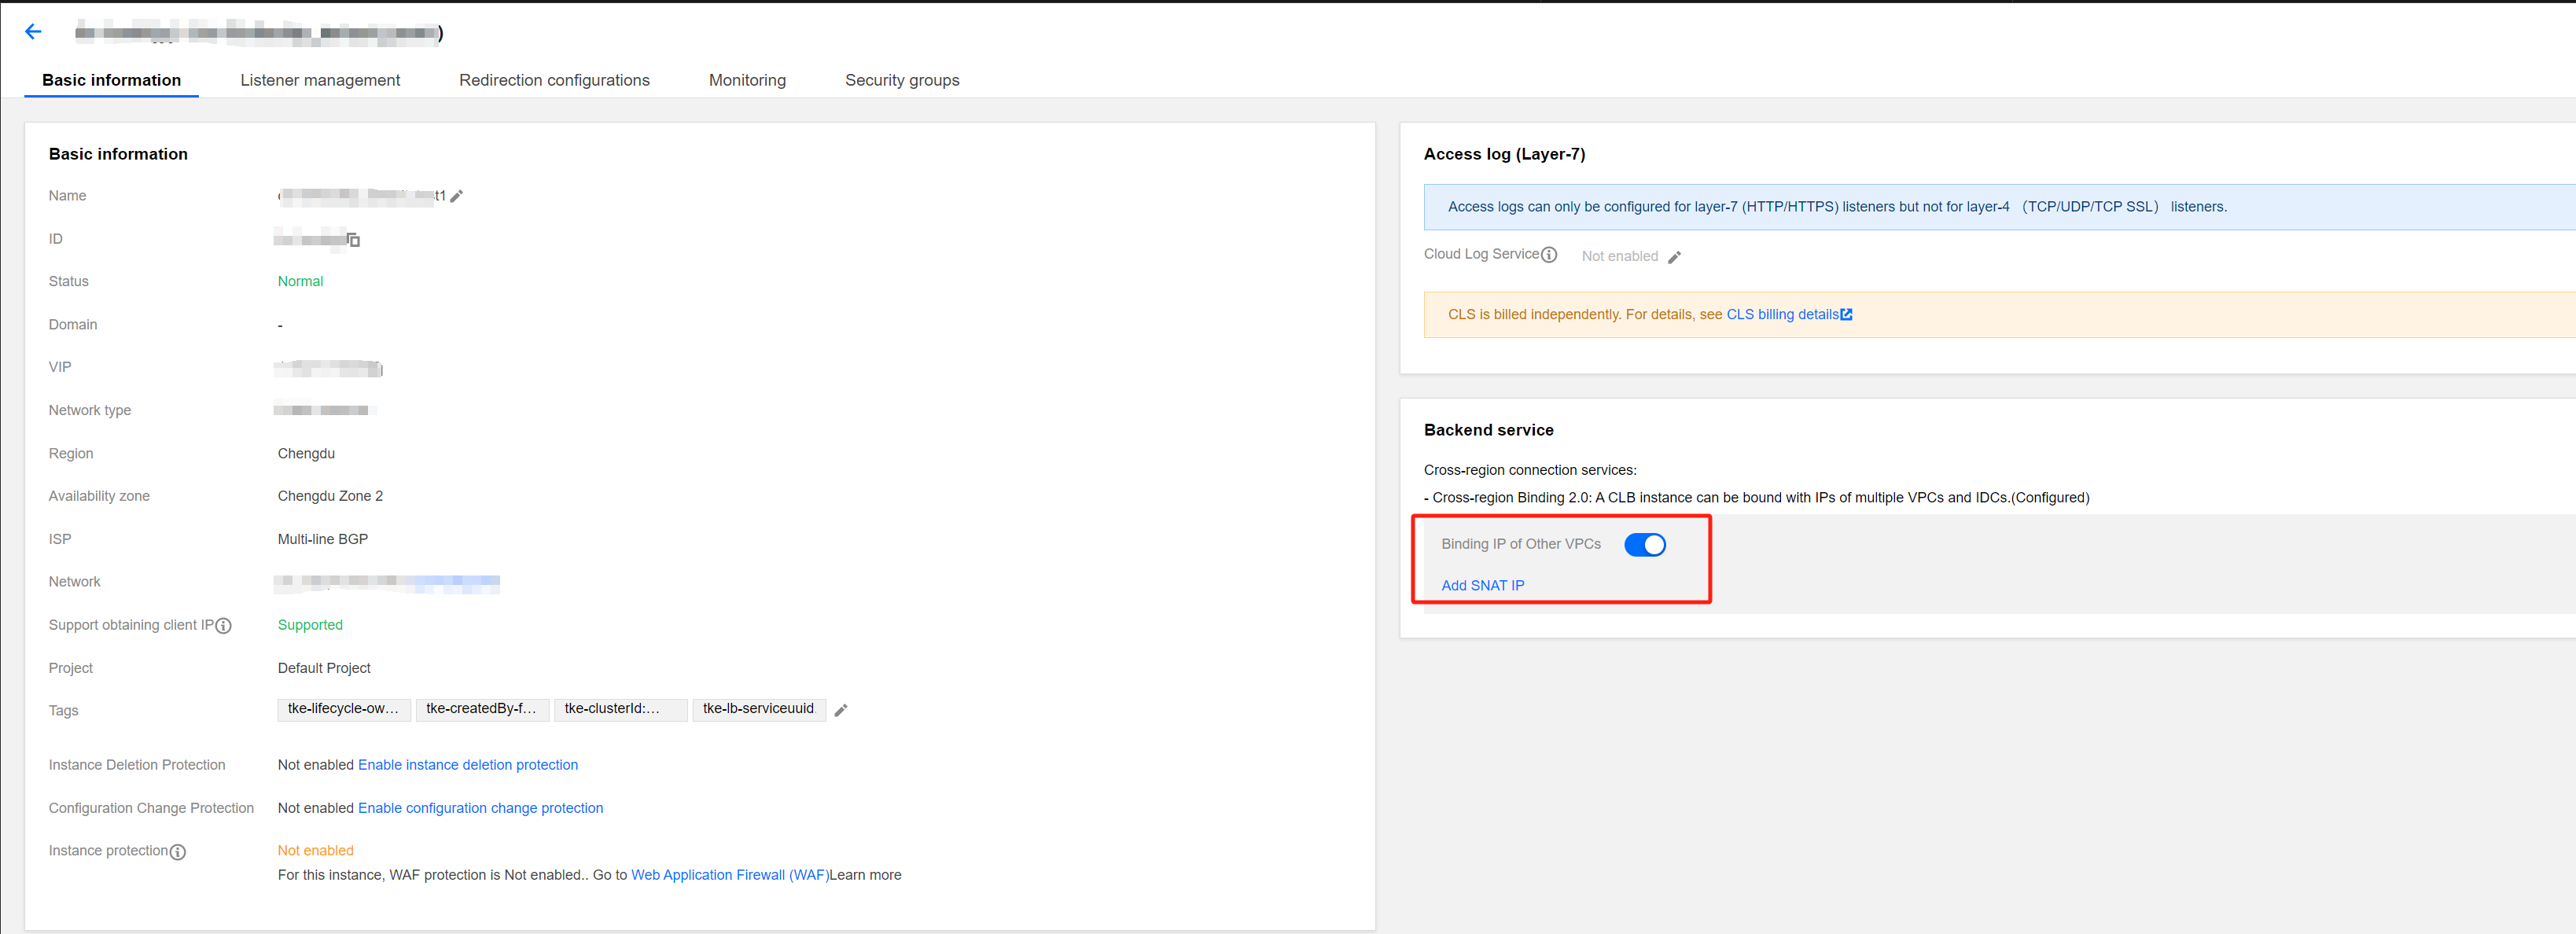
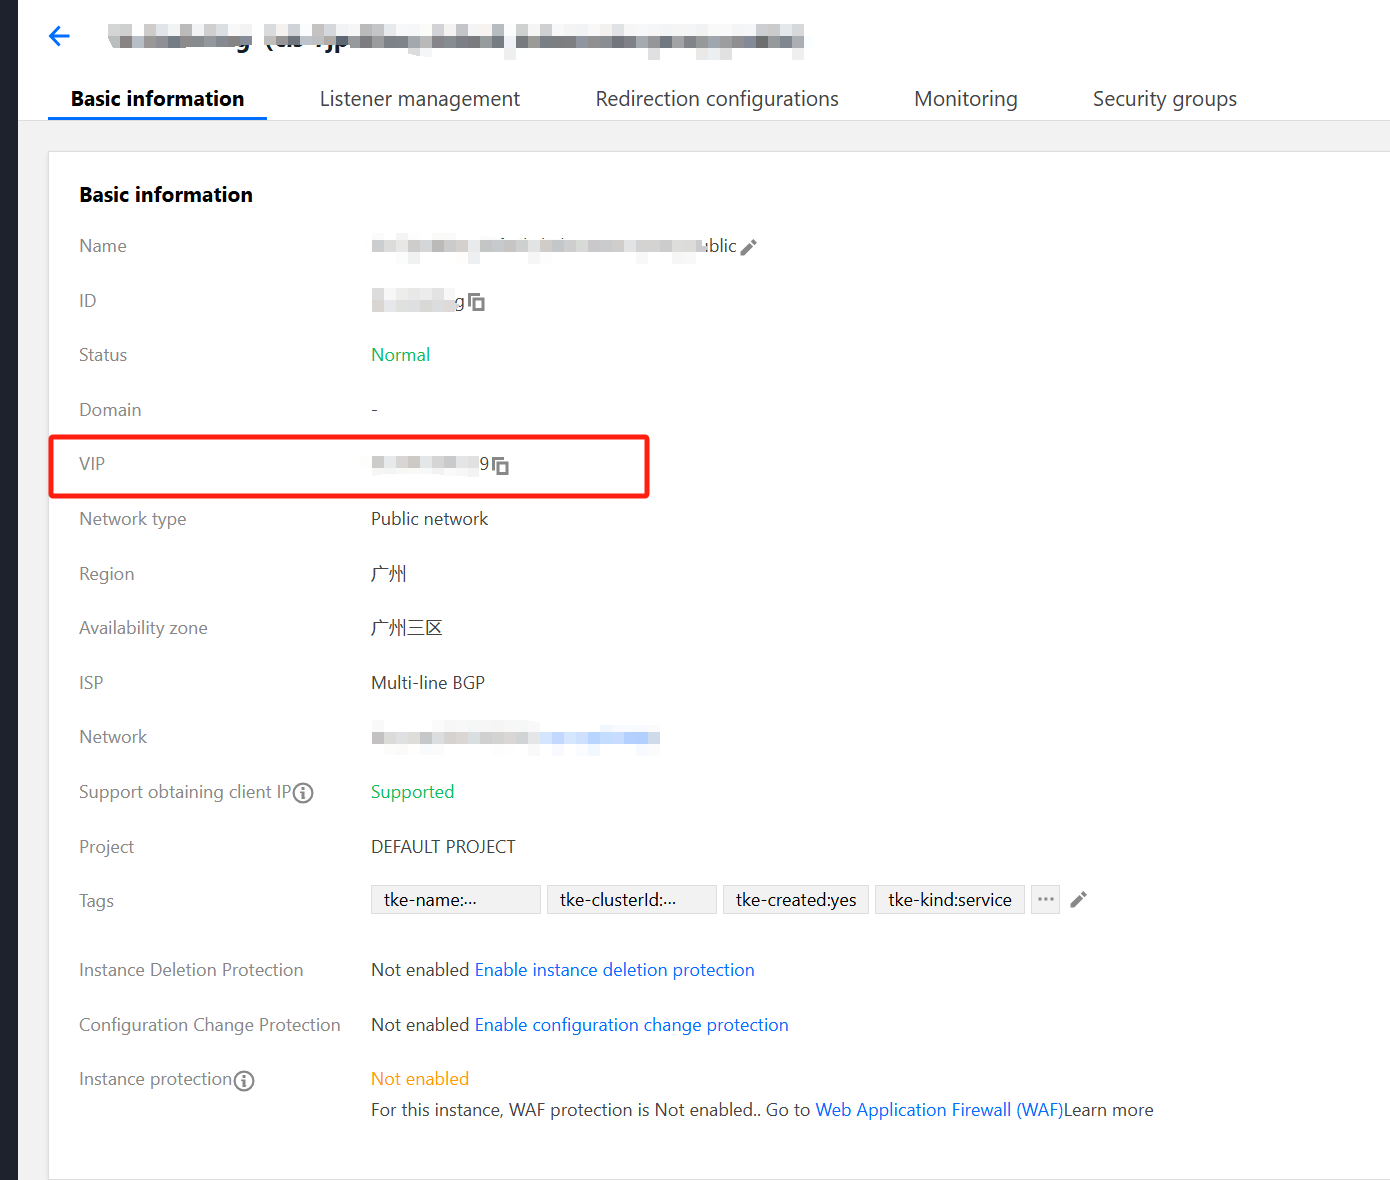
3. After creation, enter the basic information page of the instance and enable the cross-VPC access feature.


Step 3: Binding the Backend Service

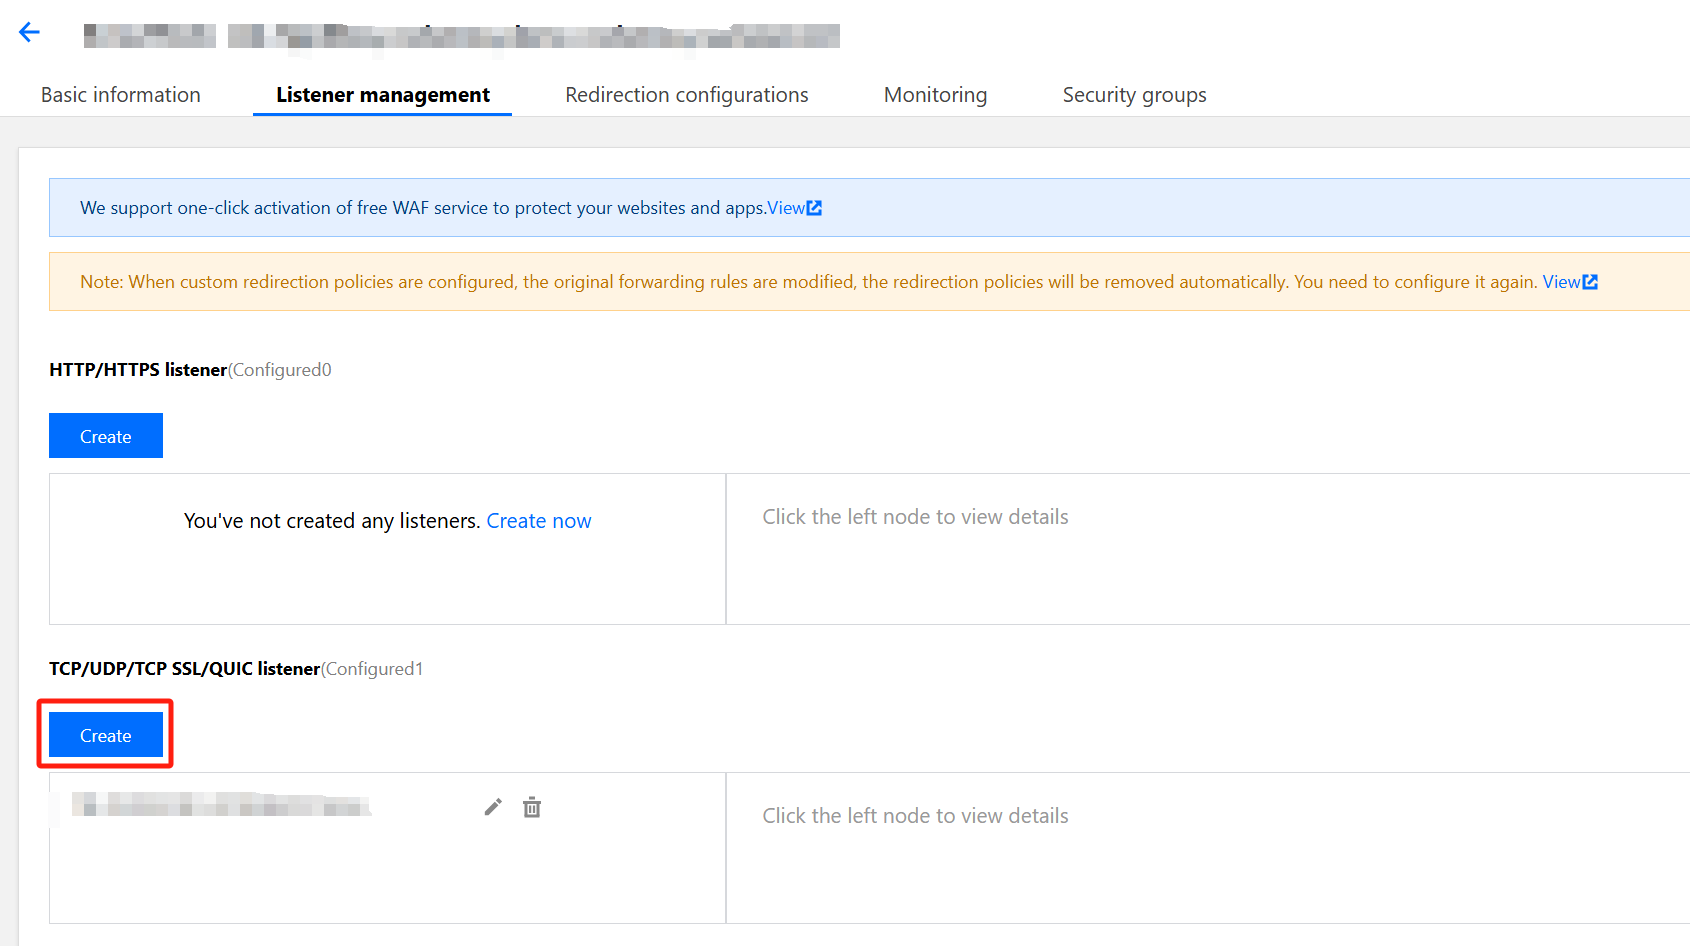
1. Enter the Listener management page.
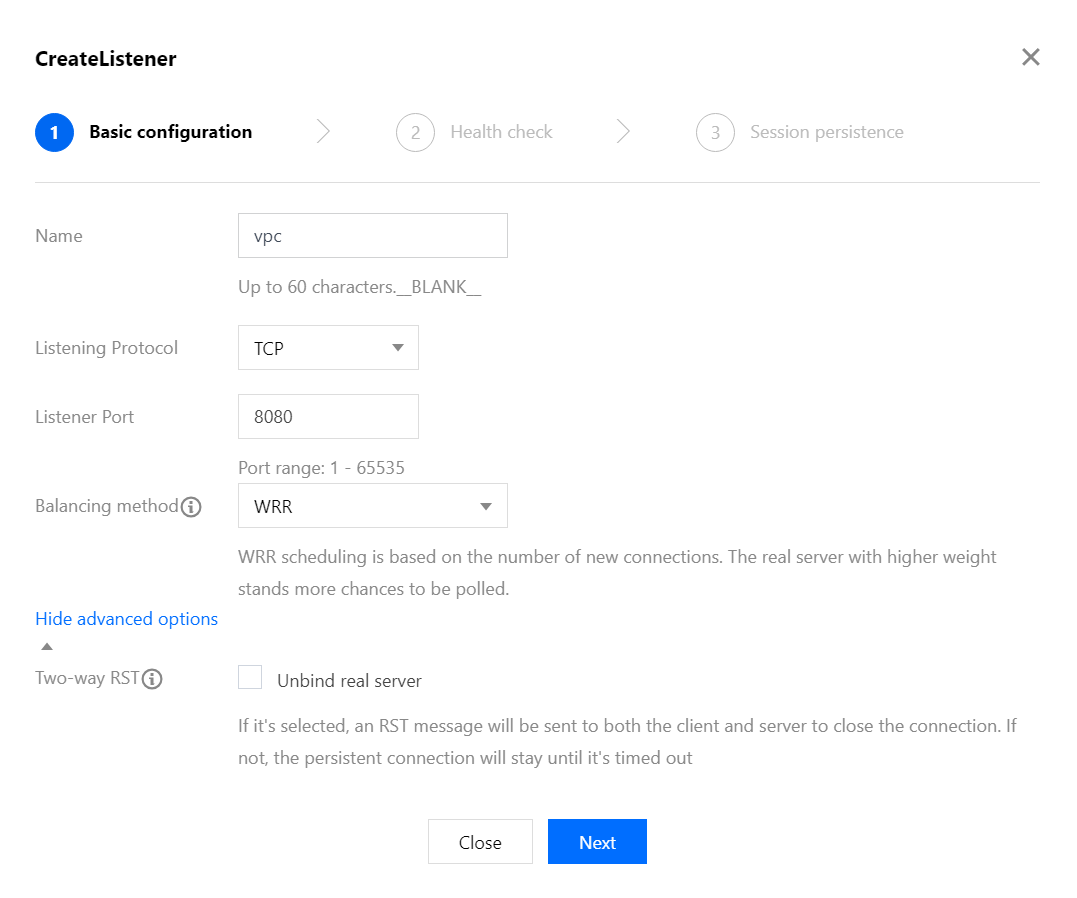
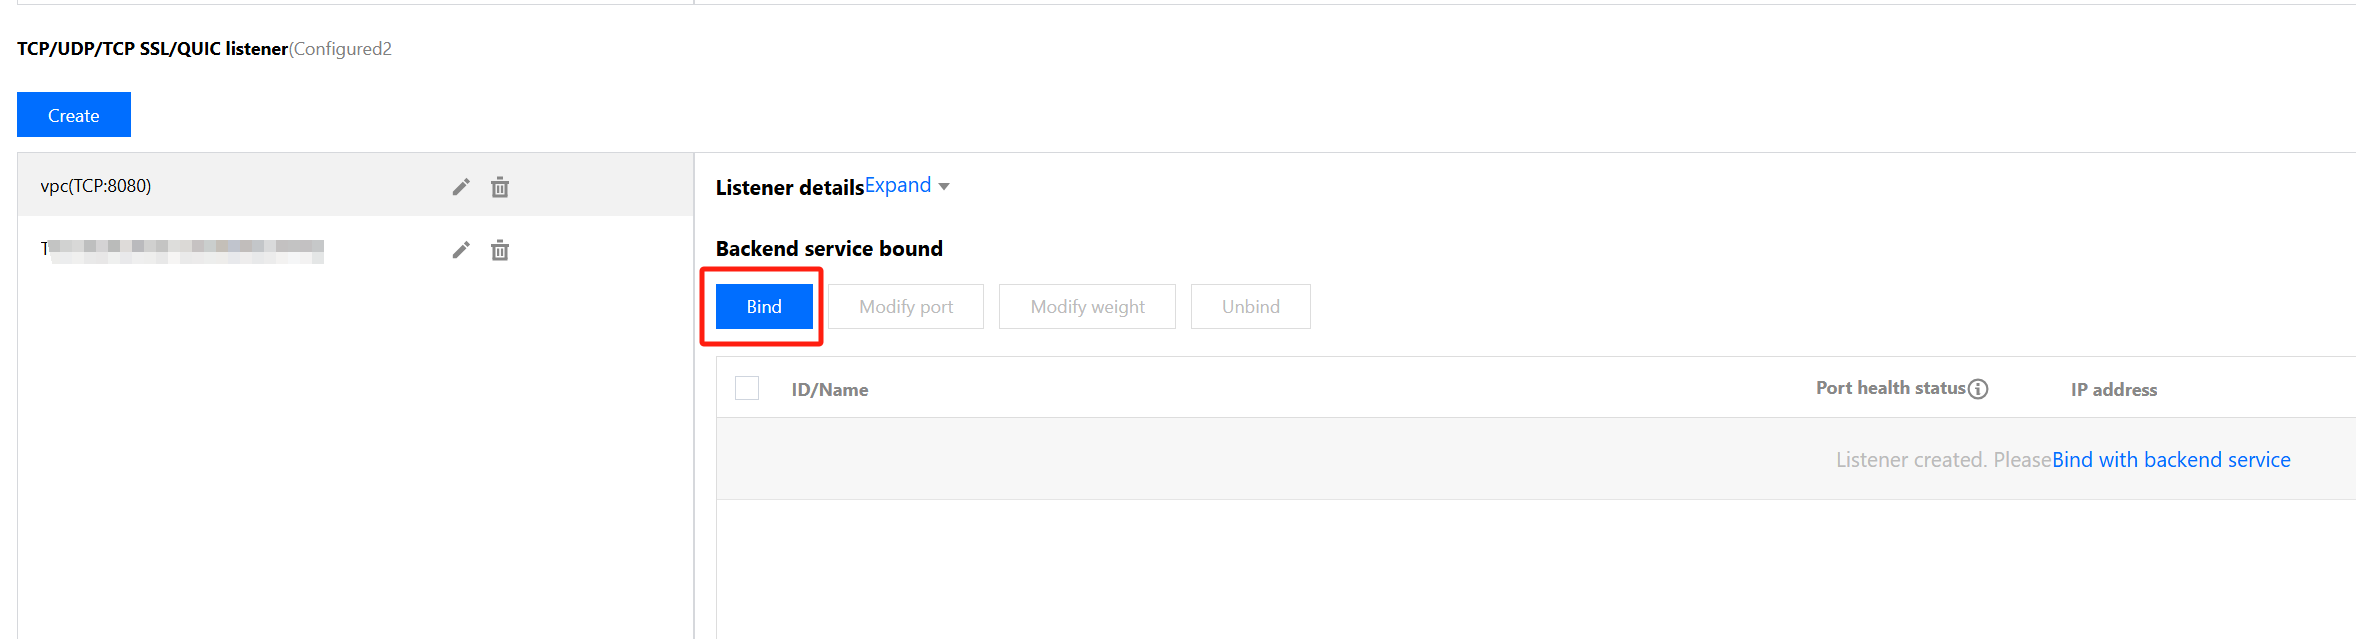
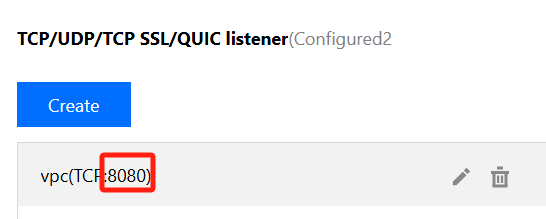
2. Click Create under the TCP/UDP/TCP SSL/QUIC listener.


For the operation guide, see CLB Listener.


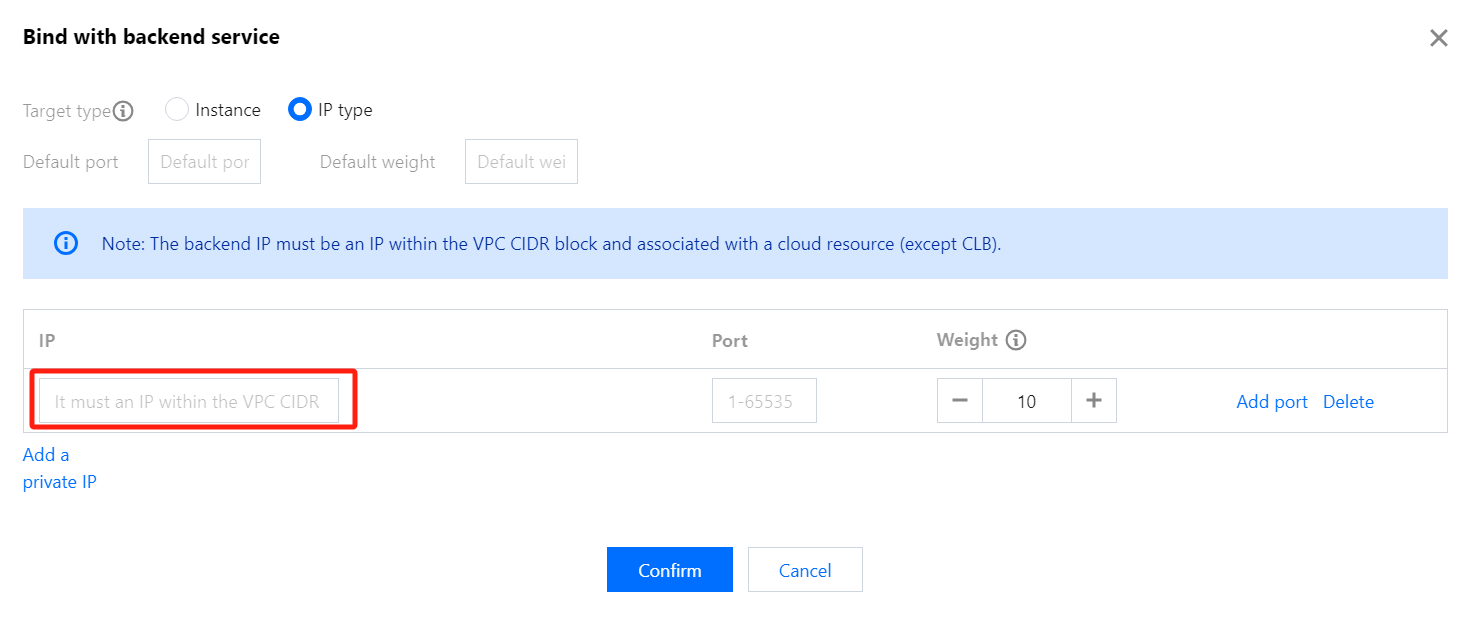
3. After creating the listener, click the listener name. In the sub-window, click Bind to bind the backend service.


Target Type: Select IP Type.
Default Port: Enter 9090.
IP Address: Enter the IPv4 address of the Prometheus instance obtained in step 1.


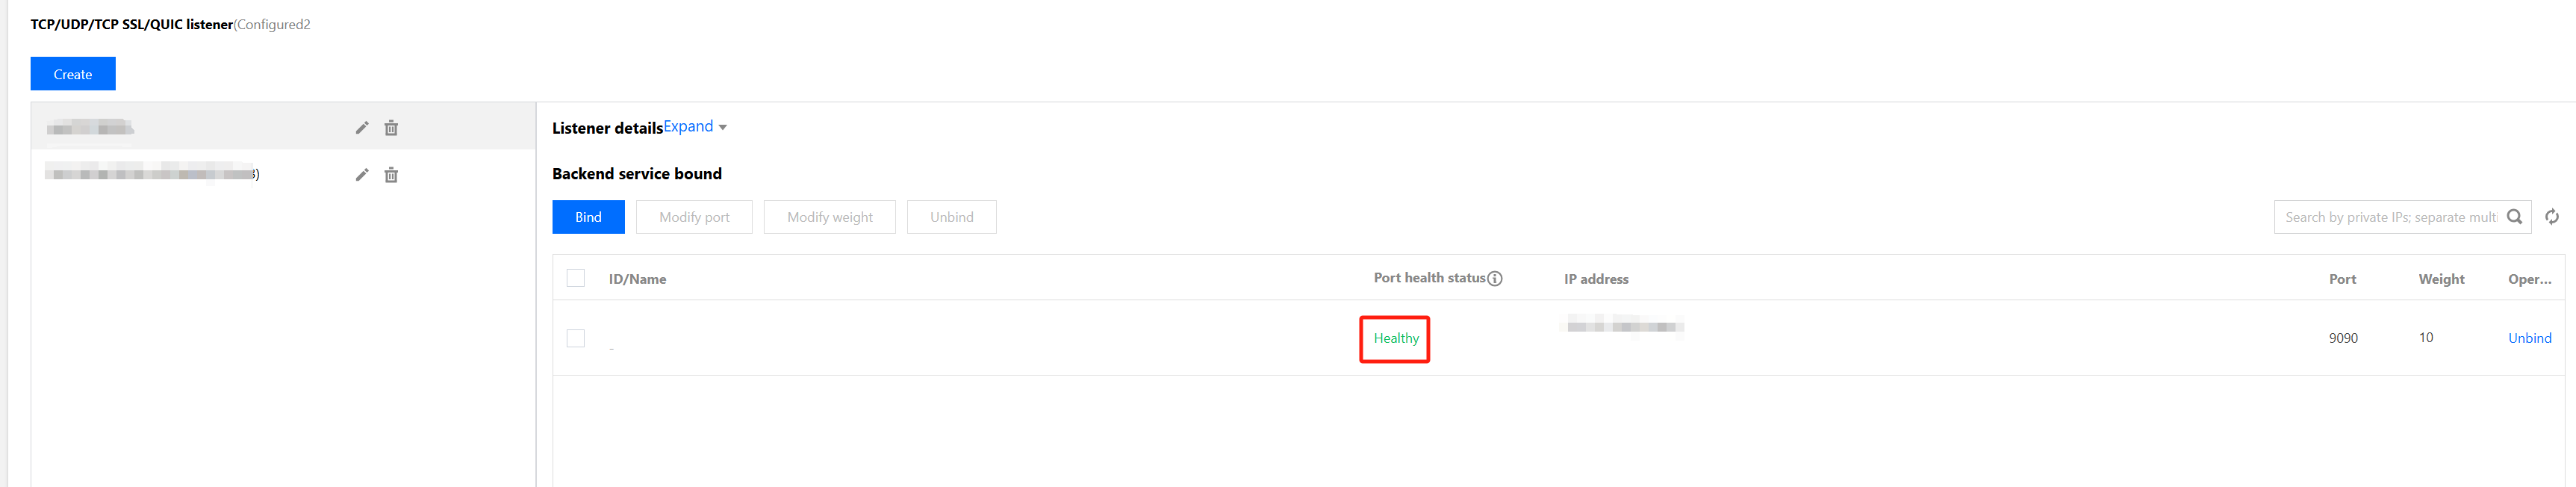
4. Click Listener Name to check whether the listening is normal.


Step 4: Testing Whether the Configuration is Successful

1. Check the public network address of CLB. Assume that the address is 192.168.1.1.


2. Check the port configured for the listener, for example, port 8080.


Based on the above information, it is determined that the public network address for Prometheus forwarding is IP:PORT in the following new address, that is, 192.168.1.1:8080.
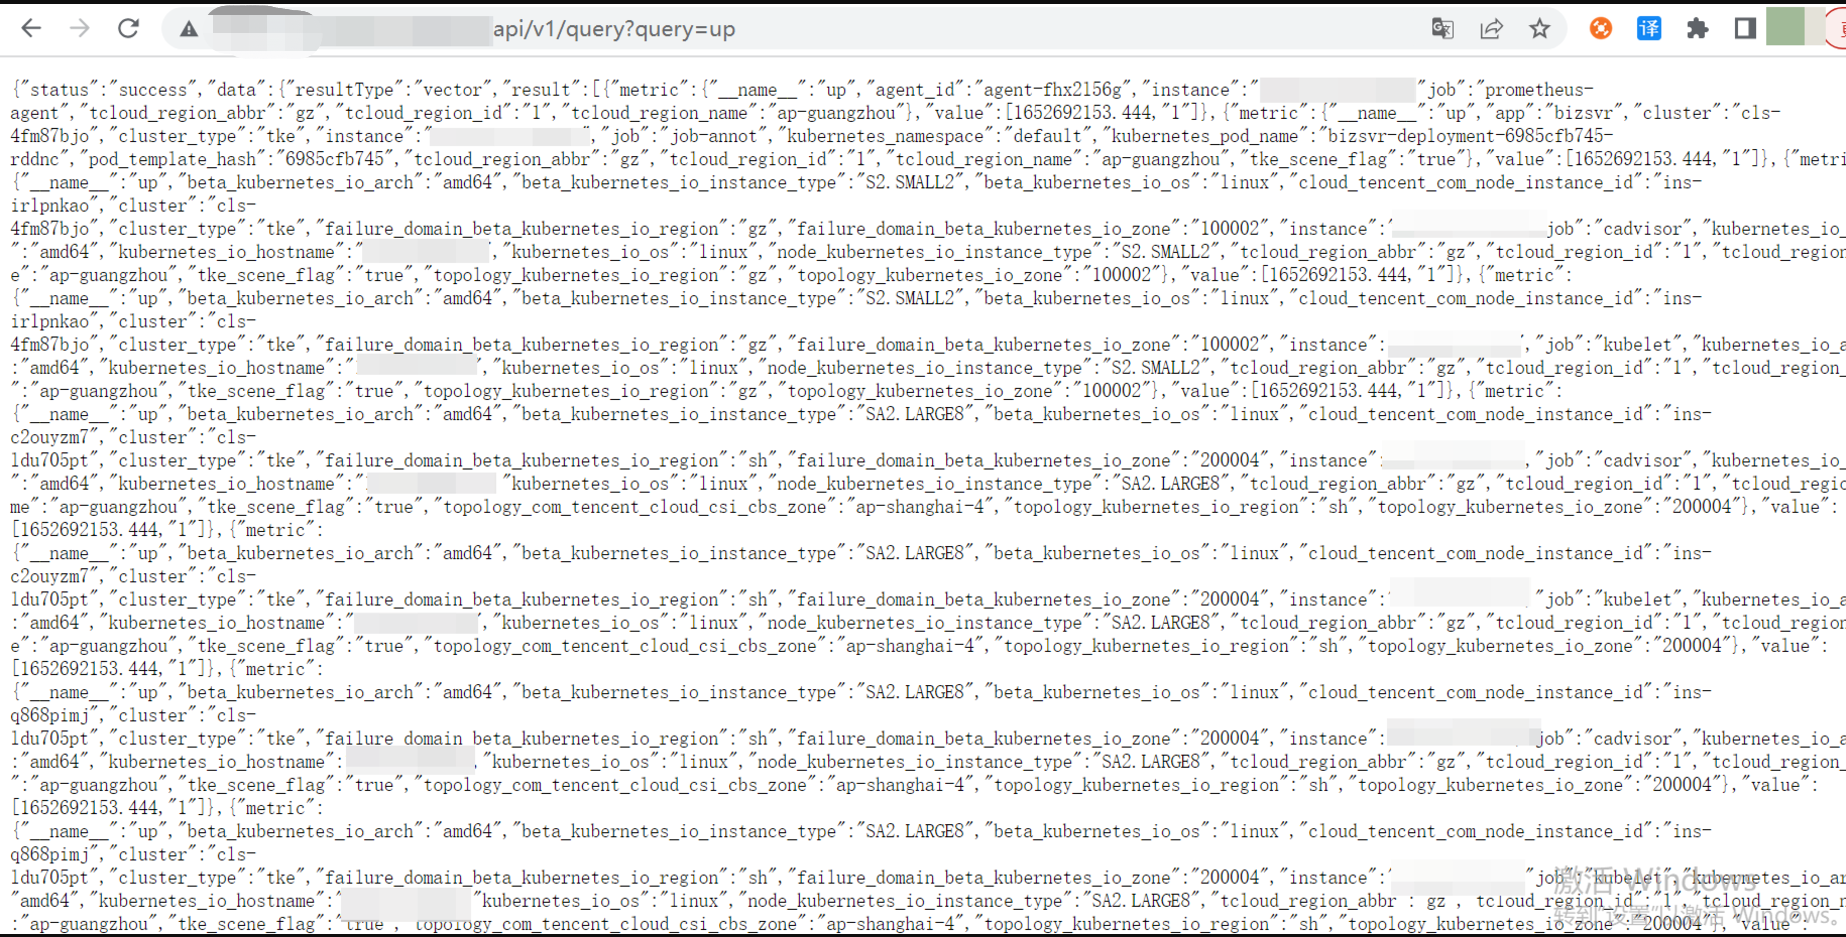
3. Check in the browser or on the machine to see whether UP data can be obtained by using this IP address.
4. HTTP API address:
http://IP:PORT/api/v1/query?query=up
Replace IP:PORT with Public IP and Port of CLB as follows:
http://81.71.21.123:8080/api/v1/query?query=up
5. Access http://81.71.21.123:8080/api/v1/query?query=up.
username: Enter your root account ID (app ID).
password: Obtain the token from the basic information page of the instance.


As shown below, the public network address is successfully configured for the Prometheus instance.


도움말 및 지원

문제 해결에 도움이 되었나요?

피드백