tencent cloud

Tencent Cloud Observability Platform

Release Notes and Announcements
Release Notes
Product Introduction
Overview
Strengths
Basic Features
Basic Concepts
Use Cases
Use Limits
Purchase Guide
Tencent Cloud Product Monitoring
Application Performance Management
Mobile App Performance Monitoring
Real User Monitoring
Cloud Automated Testing
Prometheus Monitoring
Grafana
EventBridge
PTS
Quick Start
Monitoring Overview
Instance Group
Tencent Cloud Product Monitoring
Application Performance Management
Real User Monitoring
Cloud Automated Testing
Performance Testing Service
Prometheus Getting Started
Grafana
Dashboard Creation
EventBridge
Alarm Service
Cloud Product Monitoring
Tencent Cloud Service Metrics
Operation Guide
CVM Agents
Cloud Product Monitoring Integration with Grafana
Troubleshooting
Practical Tutorial
Application Performance Management
Product Introduction
Access Guide
Operation Guide
Practical Tutorial
Parameter Information
FAQs
Mobile App Performance Monitoring
Overview
Operation Guide
Access Guide
Practical Tutorial
Tencent Cloud Real User Monitoring
Product Introduction
Operation Guide
Connection Guide
FAQs
Cloud Automated Testing
Product Introduction
Operation Guide
FAQs
Performance Testing Service
Overview
Operation Guide
Practice Tutorial
JavaScript API List
FAQs
Prometheus Monitoring
Product Introduction
Access Guide
Operation Guide
Practical Tutorial
Terraform
FAQs
Grafana
Product Introduction
Operation Guide
Guide on Grafana Common Features
FAQs
Dashboard
Overview
Operation Guide
Alarm Management
Console Operation Guide
Troubleshooting
FAQs
EventBridge
Product Introduction
Operation Guide
Practical Tutorial
FAQs
Report Management
FAQs
General
Alarm Service
Concepts
Monitoring Charts
CVM Agents
Dynamic Alarm Threshold
CM Connection to Grafana
Documentation Guide
Related Agreements
Application Performance Management Service Level Agreement
APM Privacy Policy
APM Data Processing And Security Agreement
RUM Service Level Agreement
Mobile Performance Monitoring Service Level Agreement
Cloud Automated Testing Service Level Agreement
Prometheus Service Level Agreement
TCMG Service Level Agreements
PTS Service Level Agreement
PTS Use Limits
Cloud Monitor Service Level Agreement
API Documentation
History
Introduction
API Category
Making API Requests
Monitoring Data Query APIs
Alarm APIs
Legacy Alert APIs
Notification Template APIs
TMP APIs
Grafana Service APIs
Event Center APIs
TencentCloud Managed Service for Prometheus APIs
Monitoring APIs
Data Types
Error Codes
Glossary

Setting Checkpoints

PDF
포커스 모드
폰트 크기
마지막 업데이트 시간: 2025-03-10 22:14:20

Overview

You can use custom checkpoints to check whether the response results of requests meet business expectations. The check results will be summarized into checkpoint metrics for you to view details in the performance testing report.
Additionally, you can enable recording of associated logs for checkpoints and requests to view checkpoint information related to the requests on the request sampling side.

Usage

1. Defining Checkpoints

The PTS JavaScript API provides the check method to create checkpoints.
The input parameters of the check method are as follows:
name: name of the checkpoint.
callback: function used for checking, which should return a value of the Boolean type.
response (optional): response to the request being checked, which is used to enable checkpoint log recording.
The return value of the check method is of the Boolean type, indicating whether this check is successful.
A basic example is as follows:
import http from 'pts/http';
import { check } from 'pts';
export default function () {
const resp = http.get('http://mockhttpbin.pts.svc.cluster.local/get');
check('statusCode is 200', () => resp.statusCode === 200); // Set a checkpoint to collect statistics on checkpoint metrics.
check('statusCode is 200', () => resp.statusCode === 200, resp); // Set a checkpoint to collect statistics on checkpoint metrics and record checkpoint logs.
};
A common check logic example is as follows:
import { check } from 'pts';

export default function () {
check("is empty", () => "" === "") // true
//@ts-ignore
check("is not empty", () => "str" !== "") // true
check("equals", () => 1.00 == 1) // true
check("not equal", () => 1.00 === 1) // true
check("less than", () => 1 < 2) // true
check("less or equal", () => 1 <= 1) // true
check("greater than", () => 2 > 1) // true
check("greater or equal", () => 2 >= 2) // true
check("has key", () => ({key:"value"}).hasOwnProperty("key")) // true
check("string has value", () => "str".includes("s")) // true
check("array has value", () => ["a", "b", "c"].includes("a")) // true
};
Note:
For more detailed API documentation, see pts.check.

1. Viewing Check Results

Metric Details

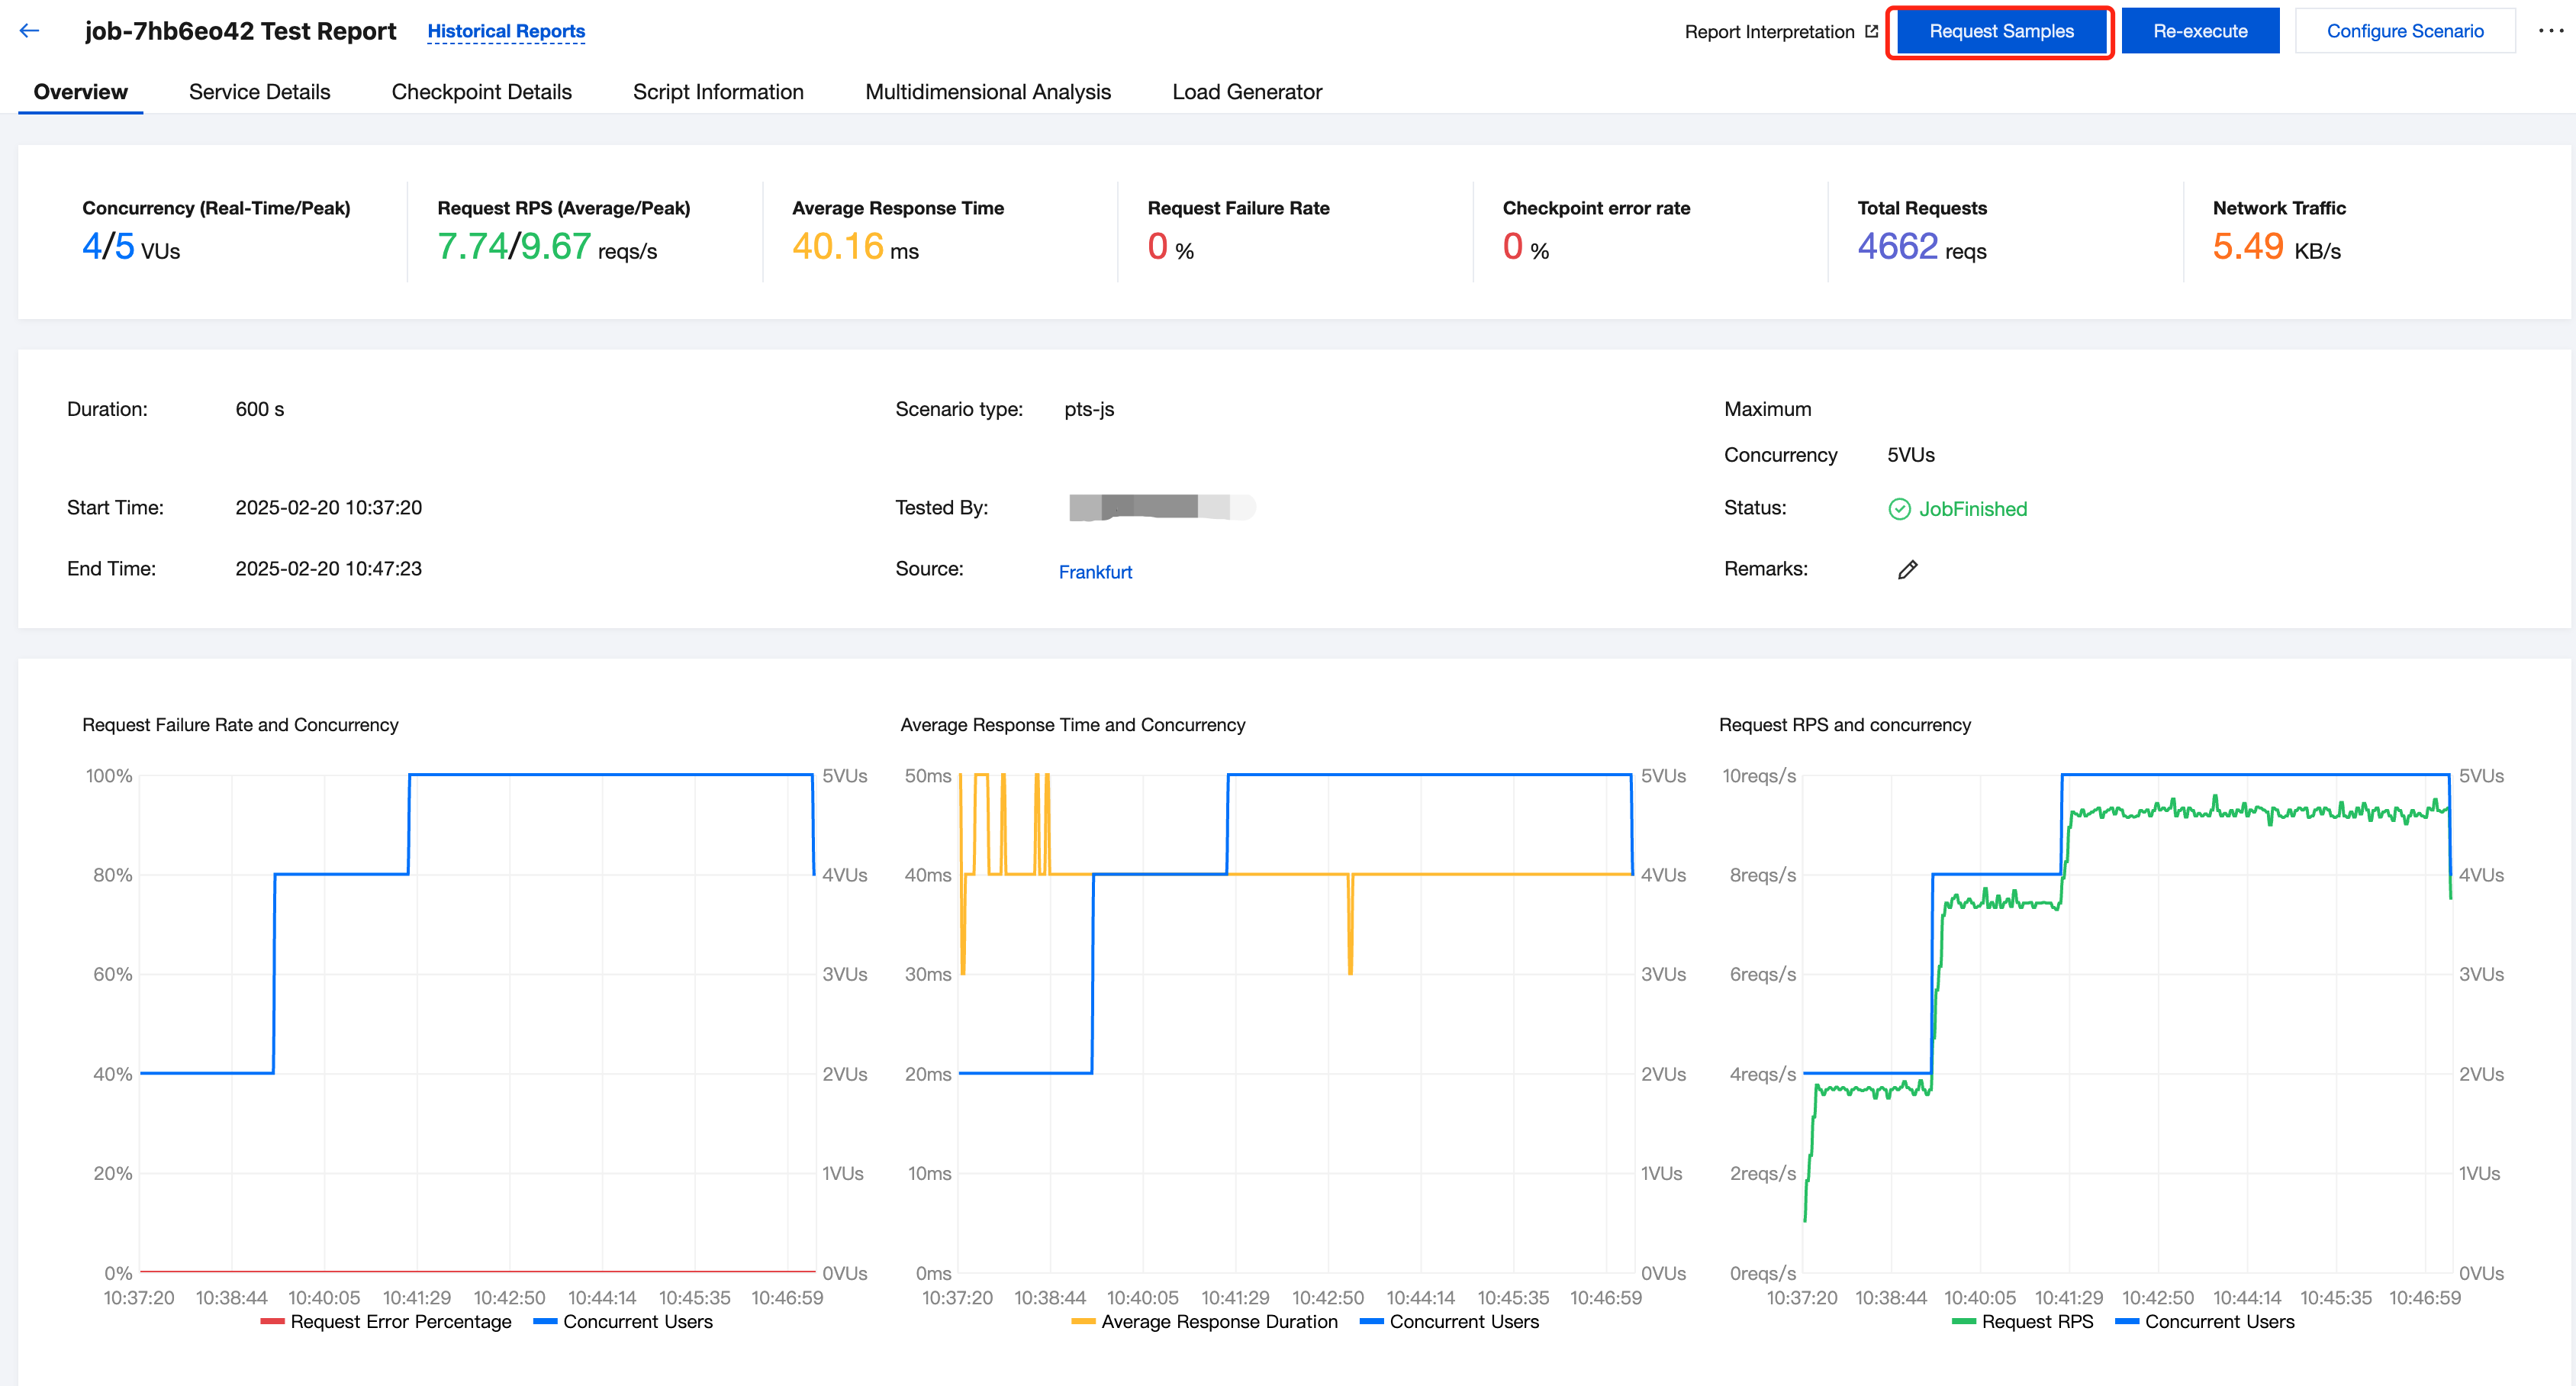
Log in to the TCOP console and select PTS > Test Scenarios in the left sidebar. On the performance testing report page, click Checkpoint Details and view the multidimensional metrics summarized from all check results.


Associated Requests

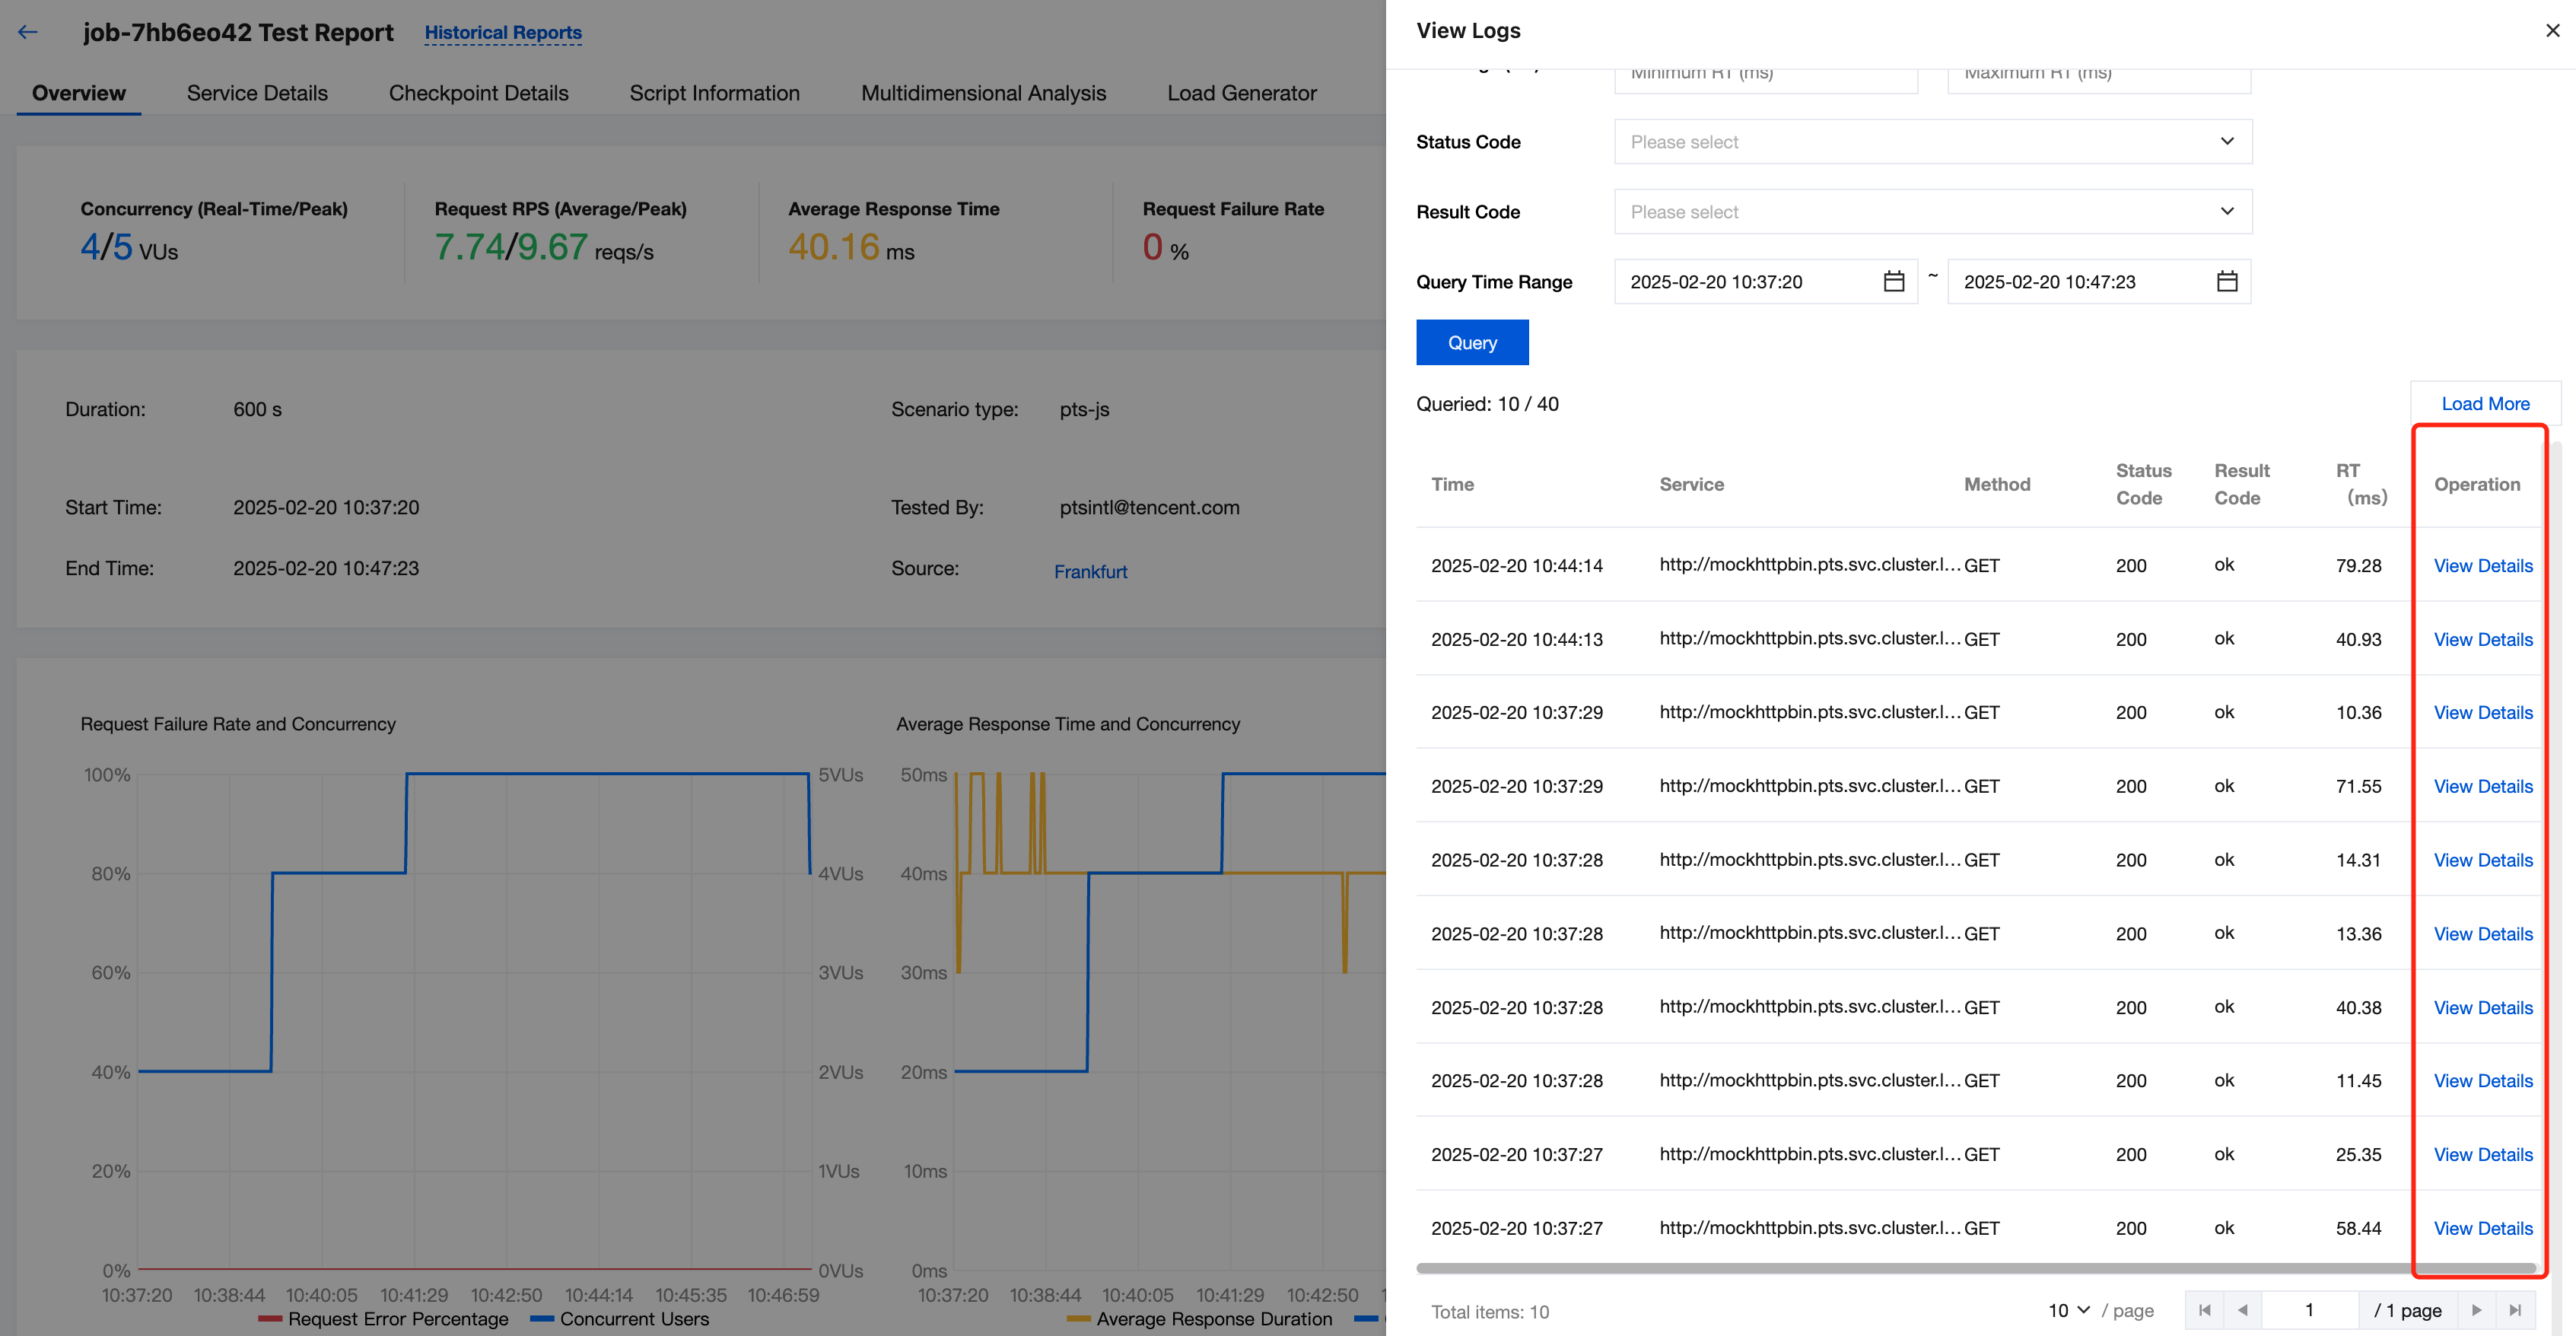
When calling the check method, if you pass in optional response parameters, the check results will be recorded in the request sampling logs in addition to being reflected in the above checkpoint metrics. You can view them on the request sampling page.


Click to select the sampling item you want to view.


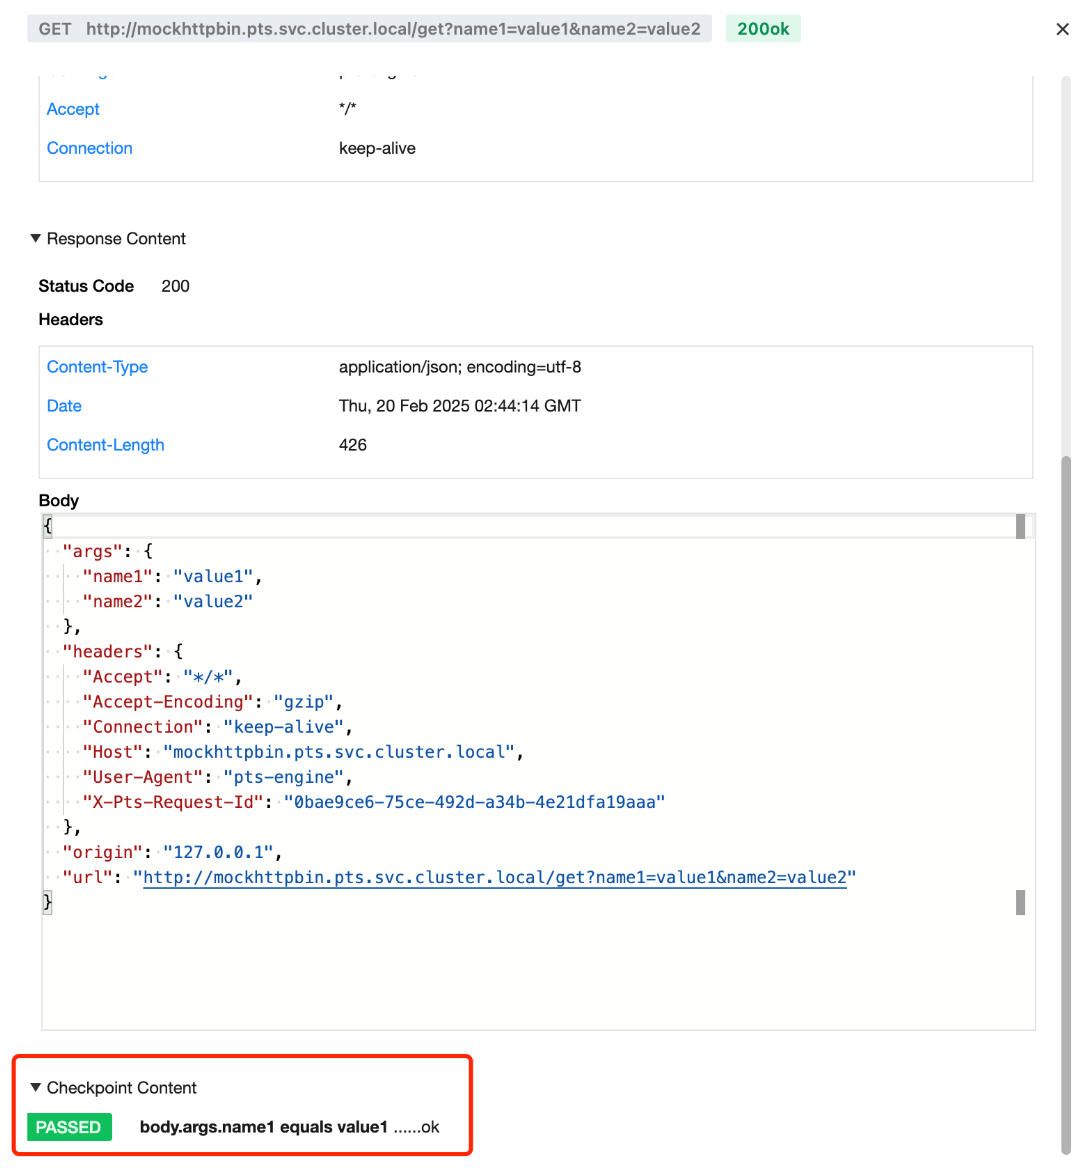
Click a sampling request to enter the details page, where you can view the checkpoint content associated with the sampling request.


Log Printing of Checkpoints and Corresponding Requests

Checkpoints are logically separated from requests. A request can correspond to multiple checkpoints, and a checkpoint can check non-request content. At the same time, a request is responded normally (status code: 200), but the checkpoint may still fail, depending on the check conditions configured by users.
import http from 'pts/http';
import { check, sleep } from 'pts';
export default function () {
const resp = http.get('http://mockhttpbin.pts.svc.cluster.local/get', {
headers: {
Connection: 'keep-alive',
'User-Agent': 'pts-engine',
},
query: {
name1: 'value1',
name2: 'value2',
},
});
// A request can correspond to multiple checkpoints.
check('status is 200', () => resp.statusCode === 200, resp);
check('body.args.name1 equals value1', () => resp.json().args.name1 === 'value1', resp);
// The status code 200 is returned for a request, but the checkpoint may still fail (depending on the check conditions configured by users).
check('body.args.name1 equals value2', () => resp.json().args.name1 === 'value2', resp);
// A checkpoint can check non-request content.
let v = 1;
check("v==1", () => v==1);
check("v==2", () => v==2);
}
However, in actual use, checkpoints and requests are often used together to check whether the request response meets expectations. Therefore, it is crucial to obtain the association between checkpoints and requests.
In the Associated Requests section, by setting the response parameters in the check method, you can record the checkpoint results in the request sampling logs, which meets the association requirements for both in some cases. However, in certain situations, there may be more customized requirements for details. In this case, you can print the required content in logs within the check conditions of a checkpoint to view more details.
import http from 'pts/http';
import { check } from 'pts';
export default function () {
const resp = http.get('http://mockhttpbin.pts.svc.cluster.local/get', {
query: {
name1: 'value1',
},
});
// Print user logs within the check conditions of a checkpoint.
check('body.args.name1 equals value2', () => {
if (resp.json().args.name1 === 'value2') {
return true
};
console.log(resp.body);
console.log(`check not pass, name1 need value2 but ${resp.json().args.name1}`);
return false;
});
}


도움말 및 지원

문제 해결에 도움이 되었나요?

피드백