When using JMeter for performance testing, we can use the JMeter CSV Data Set Config component to implement parameterization and send different test data at each request to simulate more realistic user scenarios.
Users can construct performance testing data in advance through CSV files. During the loop, the JMeter thread group reads one row from the CSV file as testing data at a time so that a different test case is used for each request.
Using JMeter to Configure a Parameter File
Assume that we need to simulate a scenario of sending emails to different users. We need to prepare a CSV file in advance, with the first row as the header indicating parameter names, and other rows as testing data.
In this file, we define 2 parameters: name and email. We can reference these parameters in JMeter requests by using ${name} and ${email}.
name, email
lyli,lyli@test.com
lucky,lucky@test.com
lucas,lucas@test.com
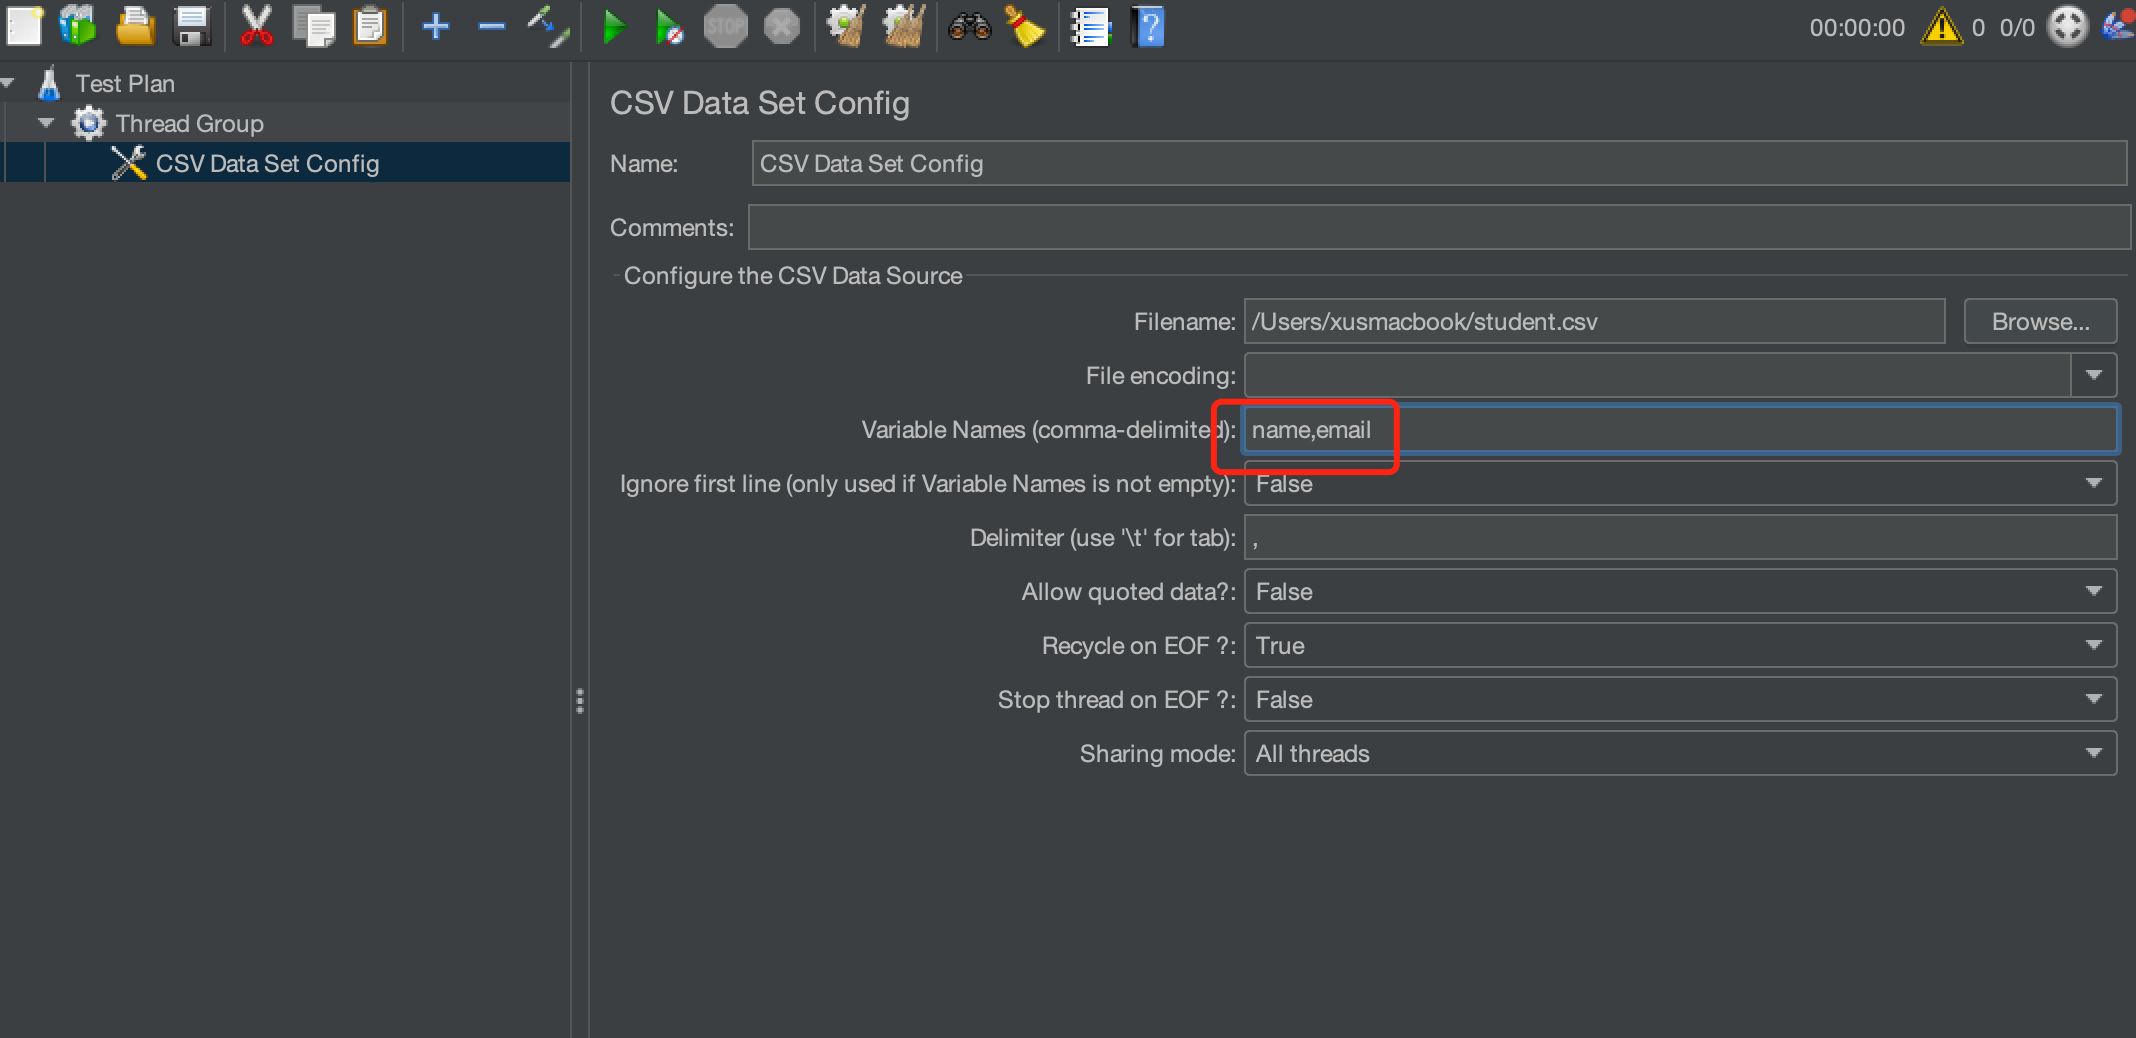
If the first row in the CSV file does not contain parameter names, you need to set the parameter names additionally in CSV Data Set Config.
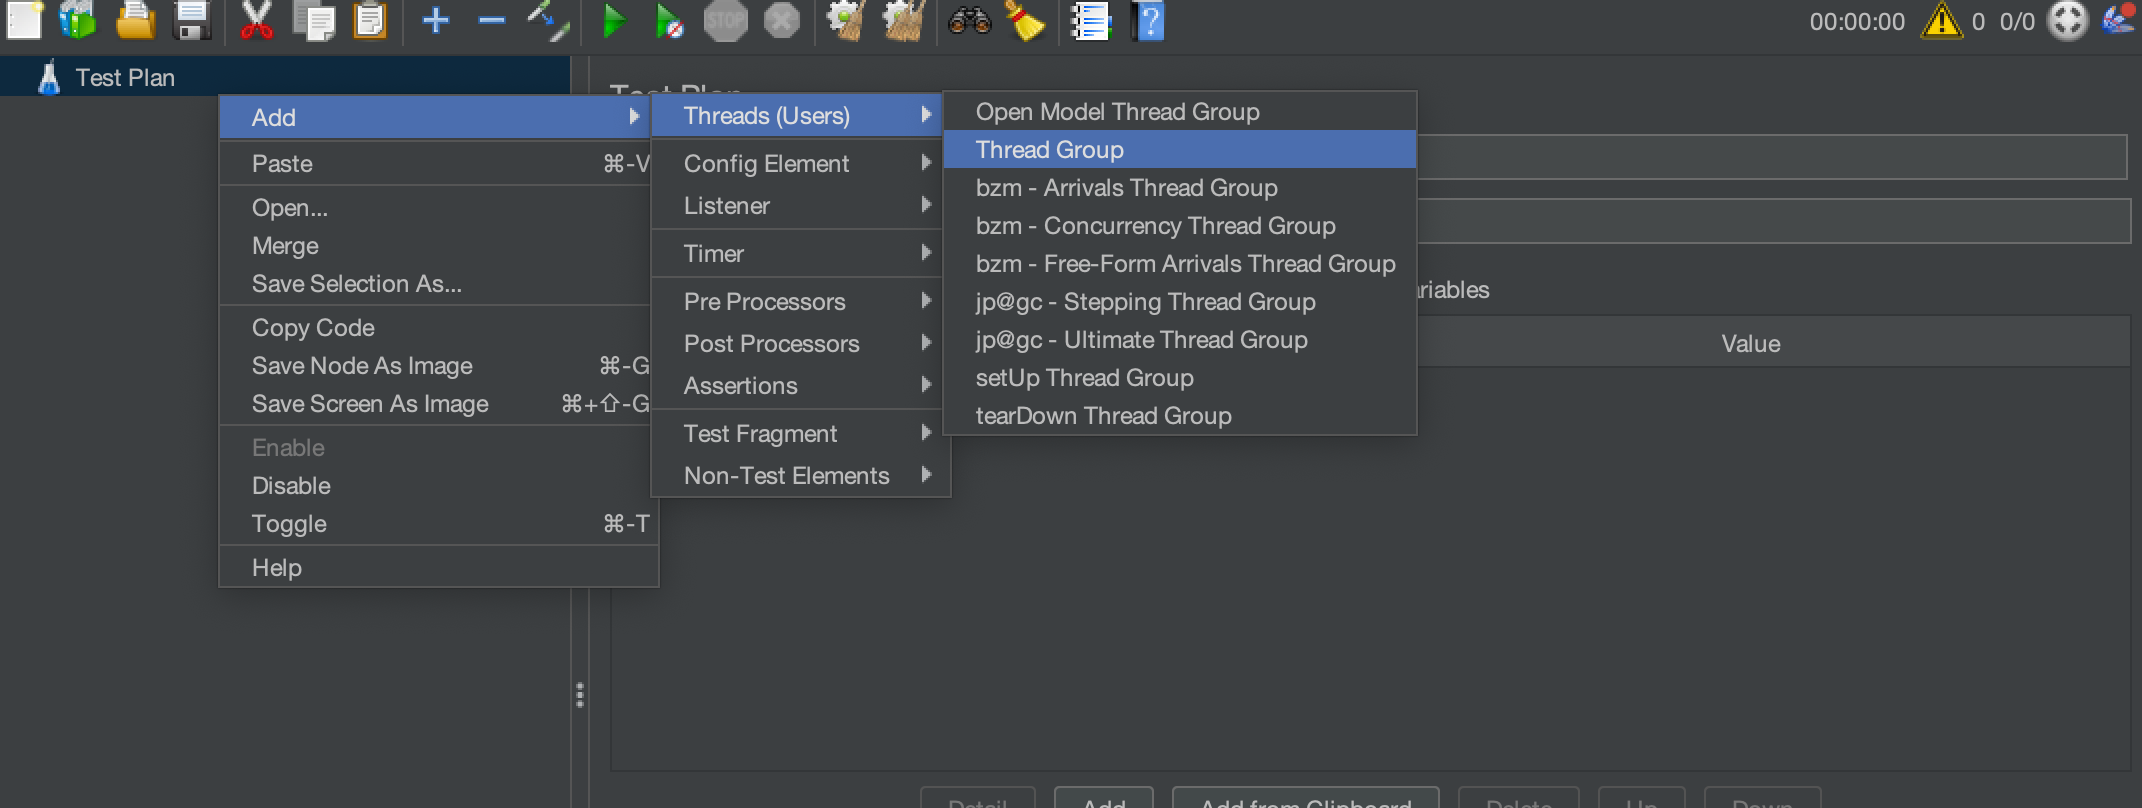
1. Right-click Test Plan and choose Add >Threads(Users) > Thread Group.
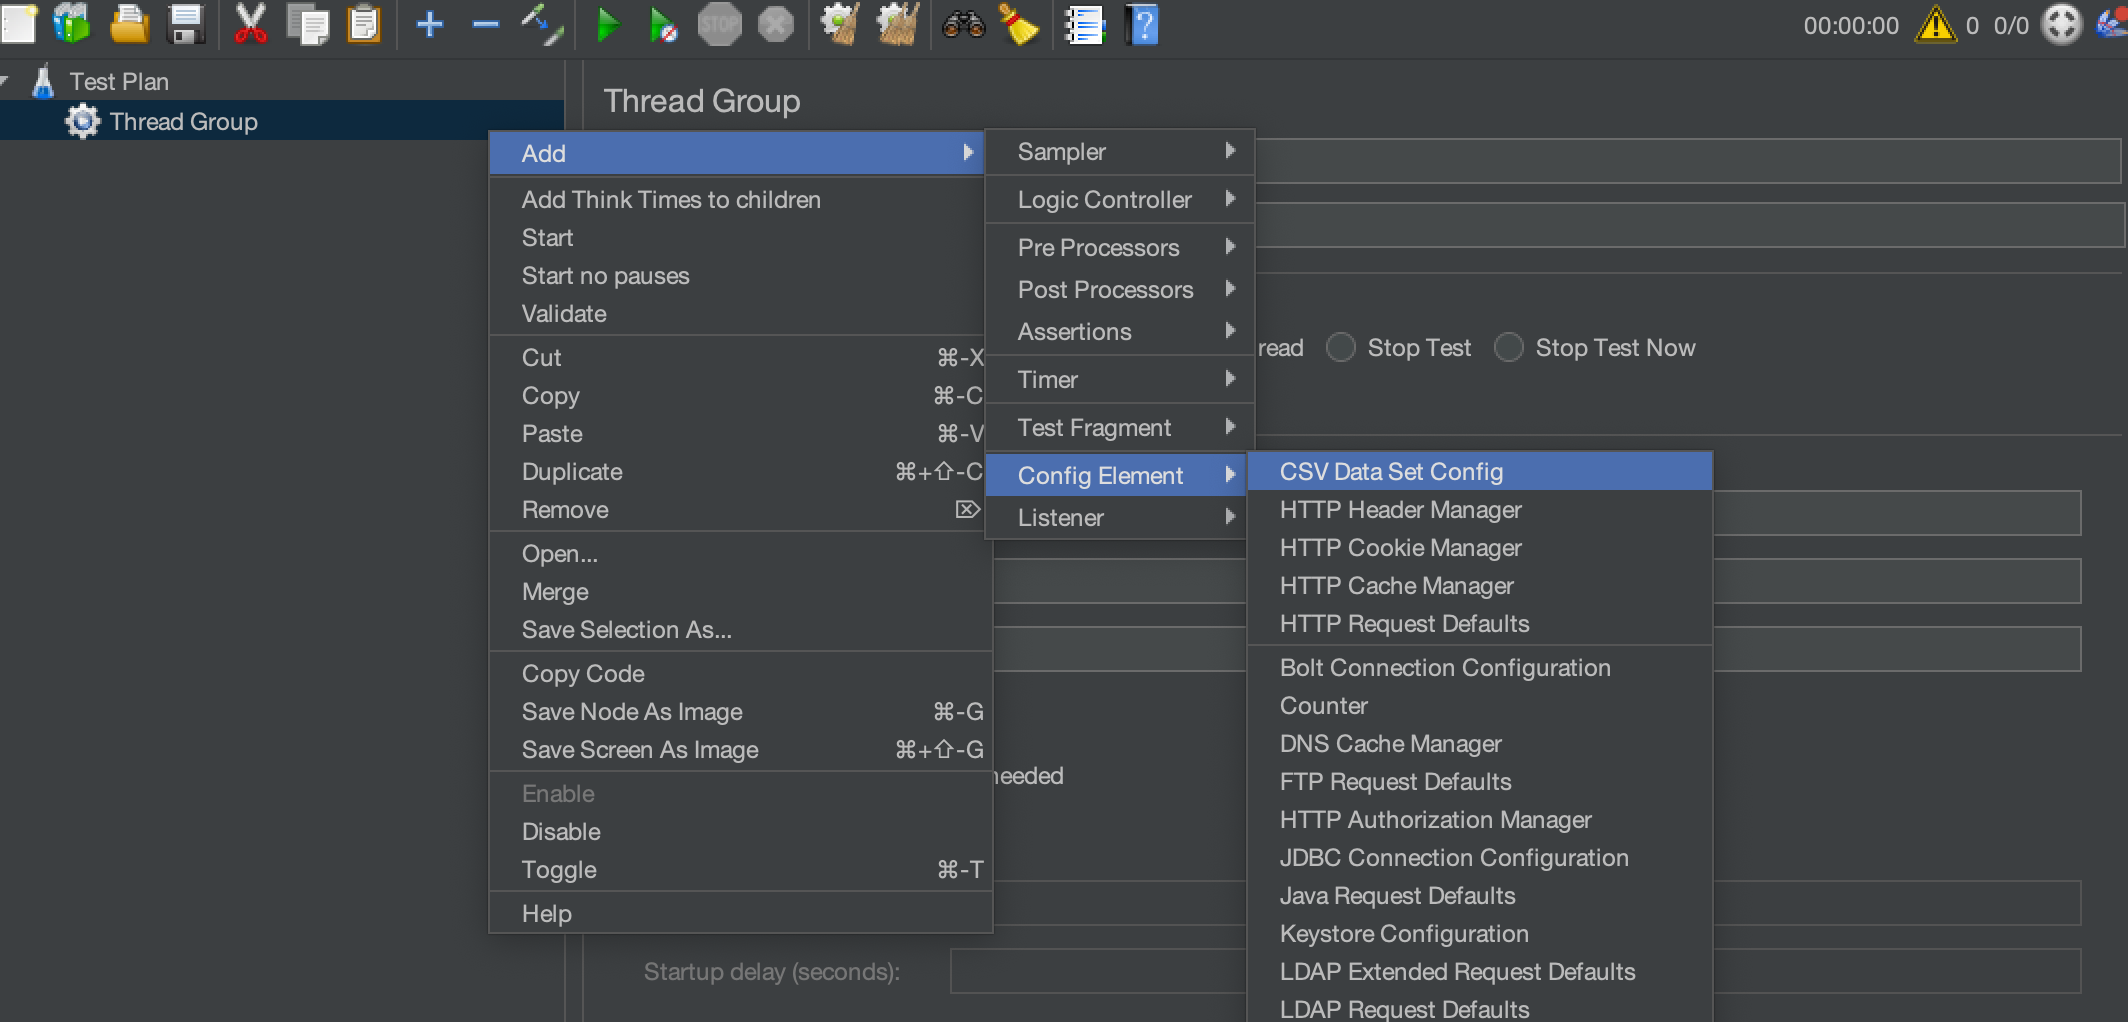
2. Right-click Thread Group and choose Add > Config Element > CSV Data Set Config.
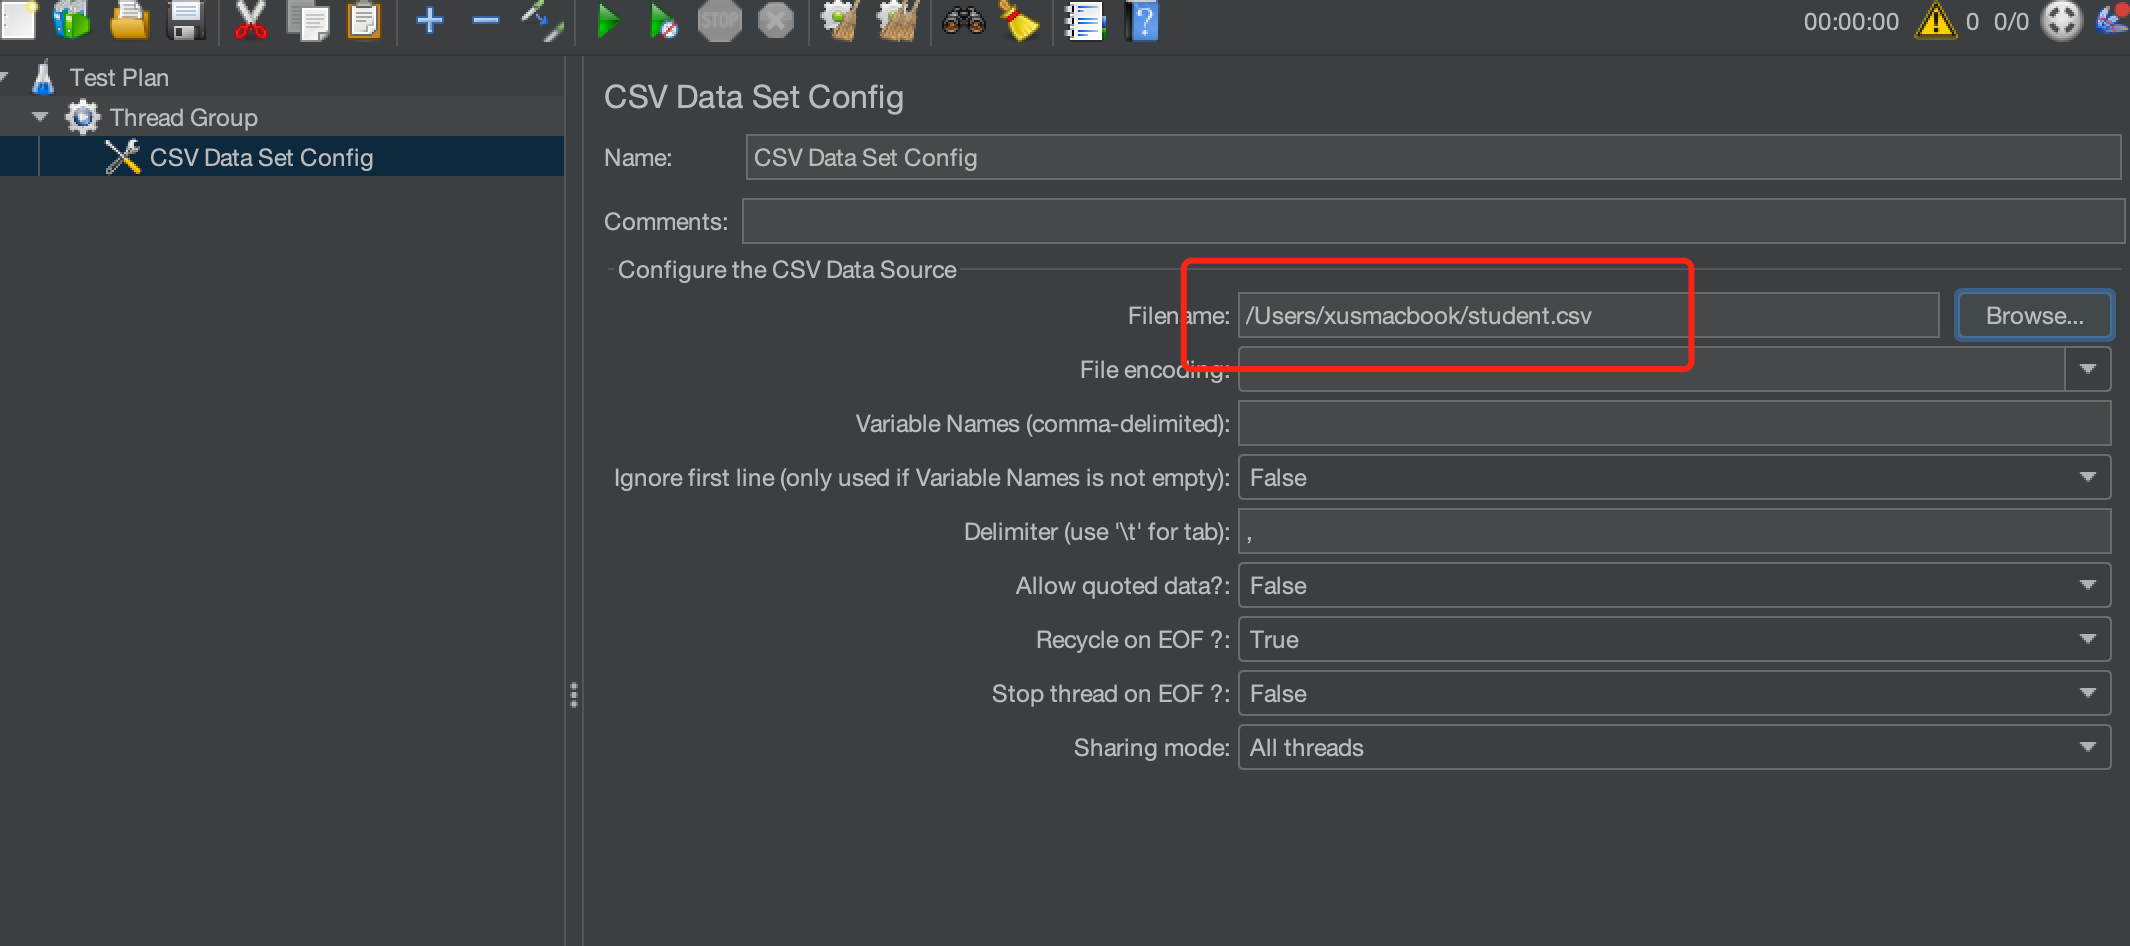
3. Configure CSV Data Set Config. In this case, import the CSV file and keep the other settings as default. At this time, the first row (name and email) will be used as parameter names by default, and we can reference the name and email variables in the request.
Note:
If the first row of your CSV file does not contain parameter names, you need to set the parameter names as follows:
Referencing Parameters Set in CSV Data Set Config in Requests
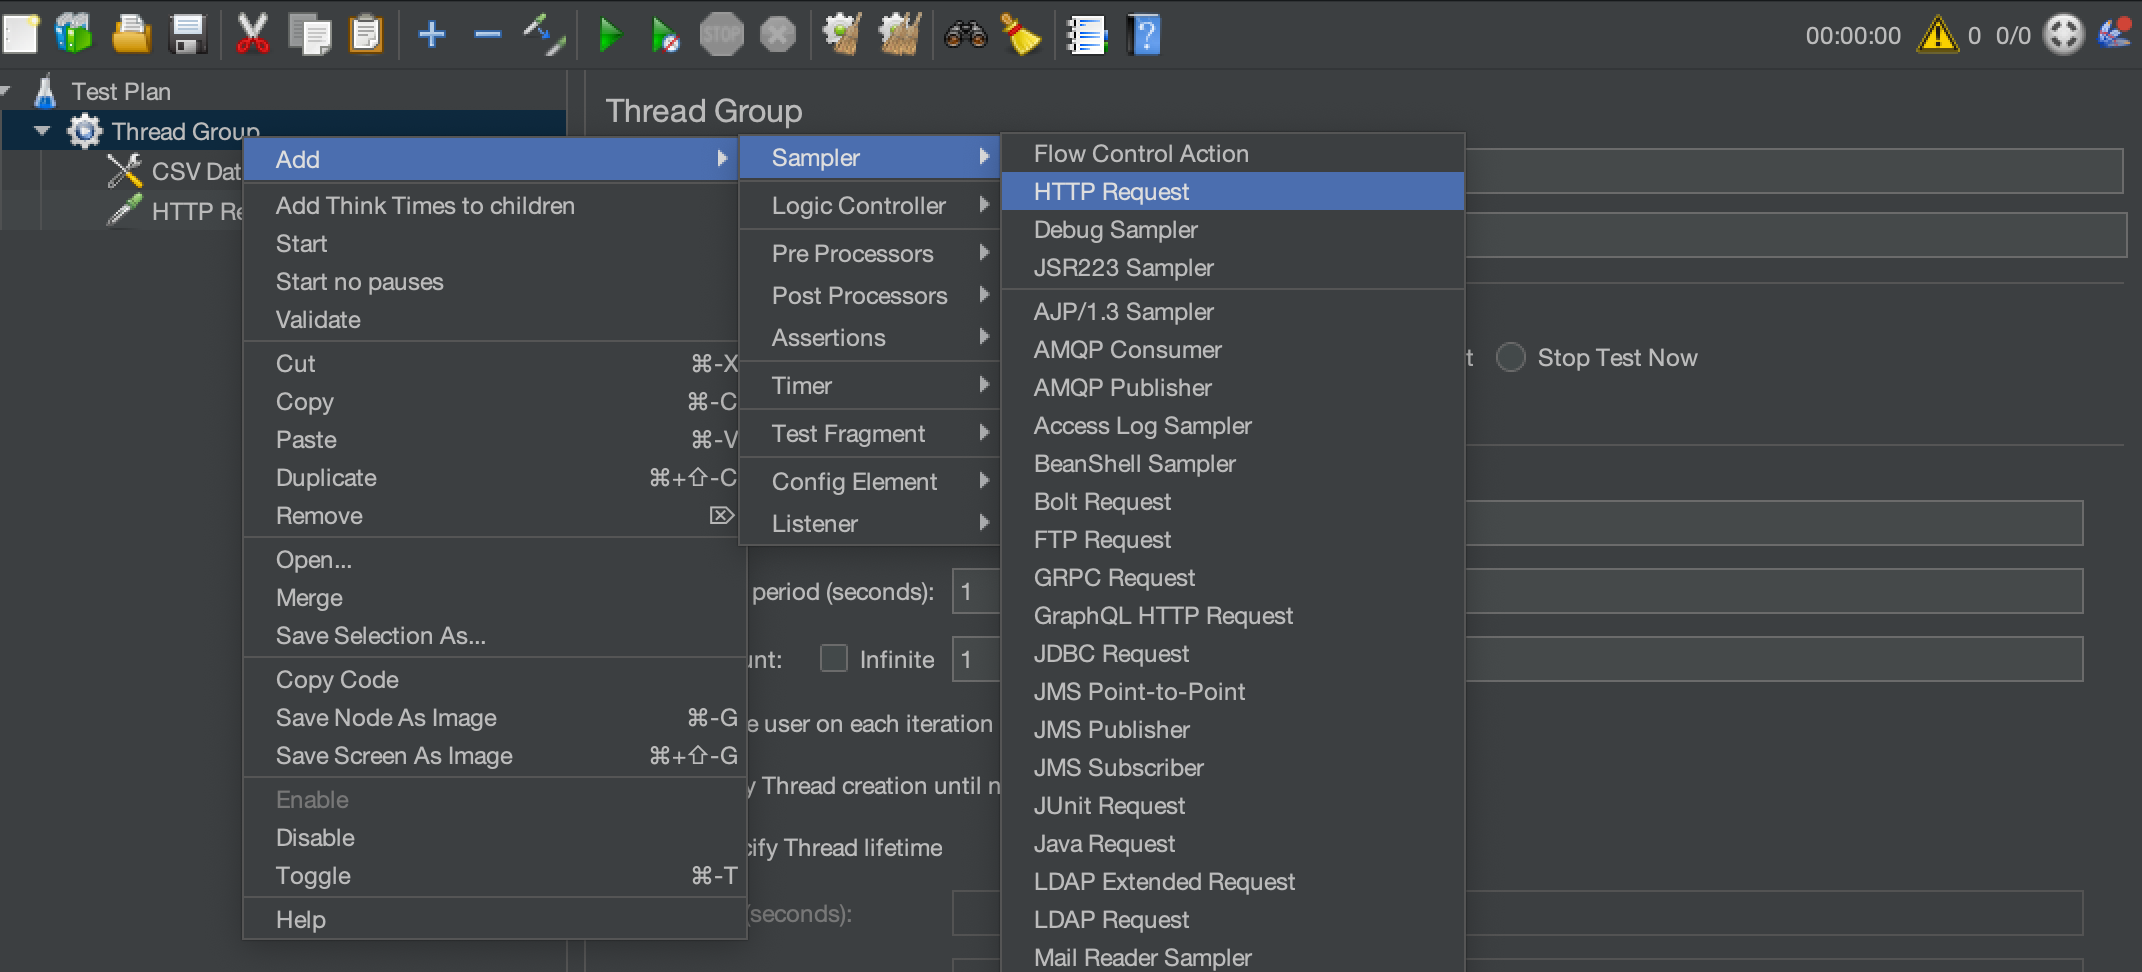
1. Right-click Thread Group and choose Add > Sampler > HTTP Request.
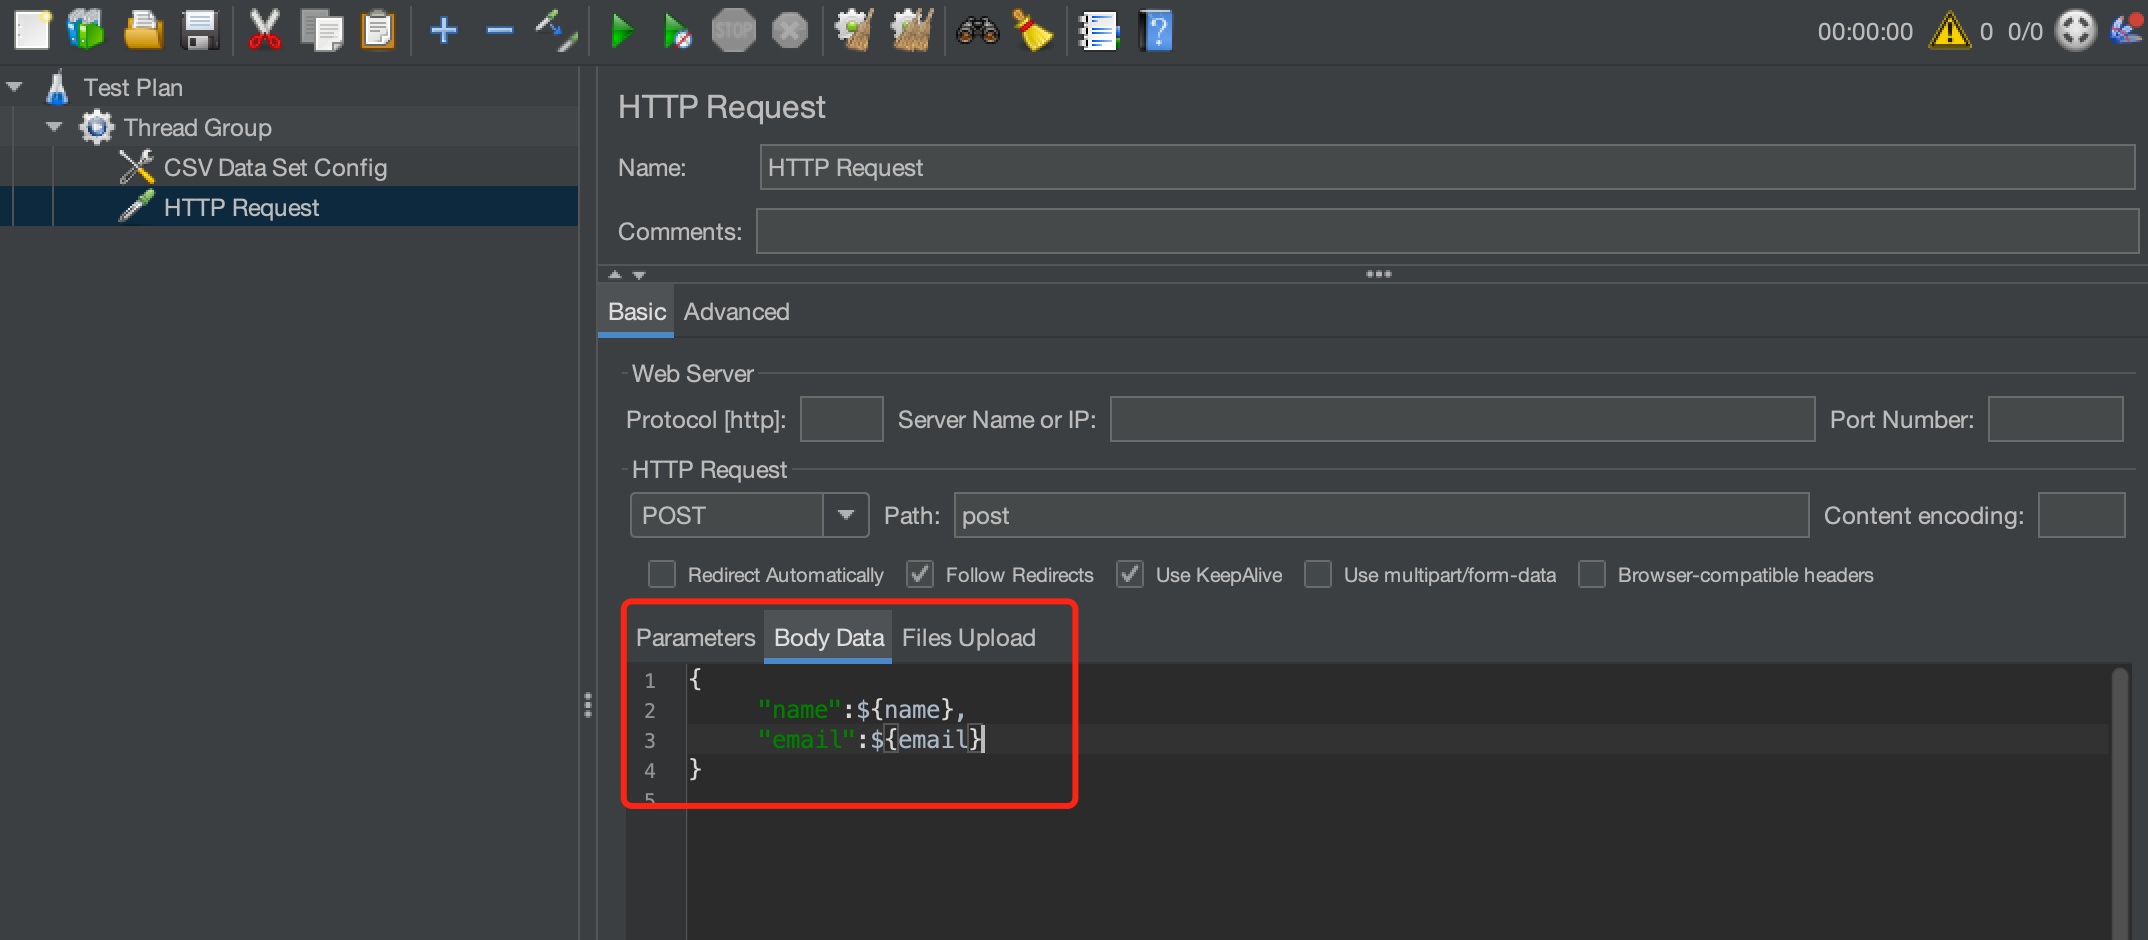
2. Configure HTTP Sampler to send the POST request. Use ${name} and ${email} in the body to reference parameters configured in the CSV file.
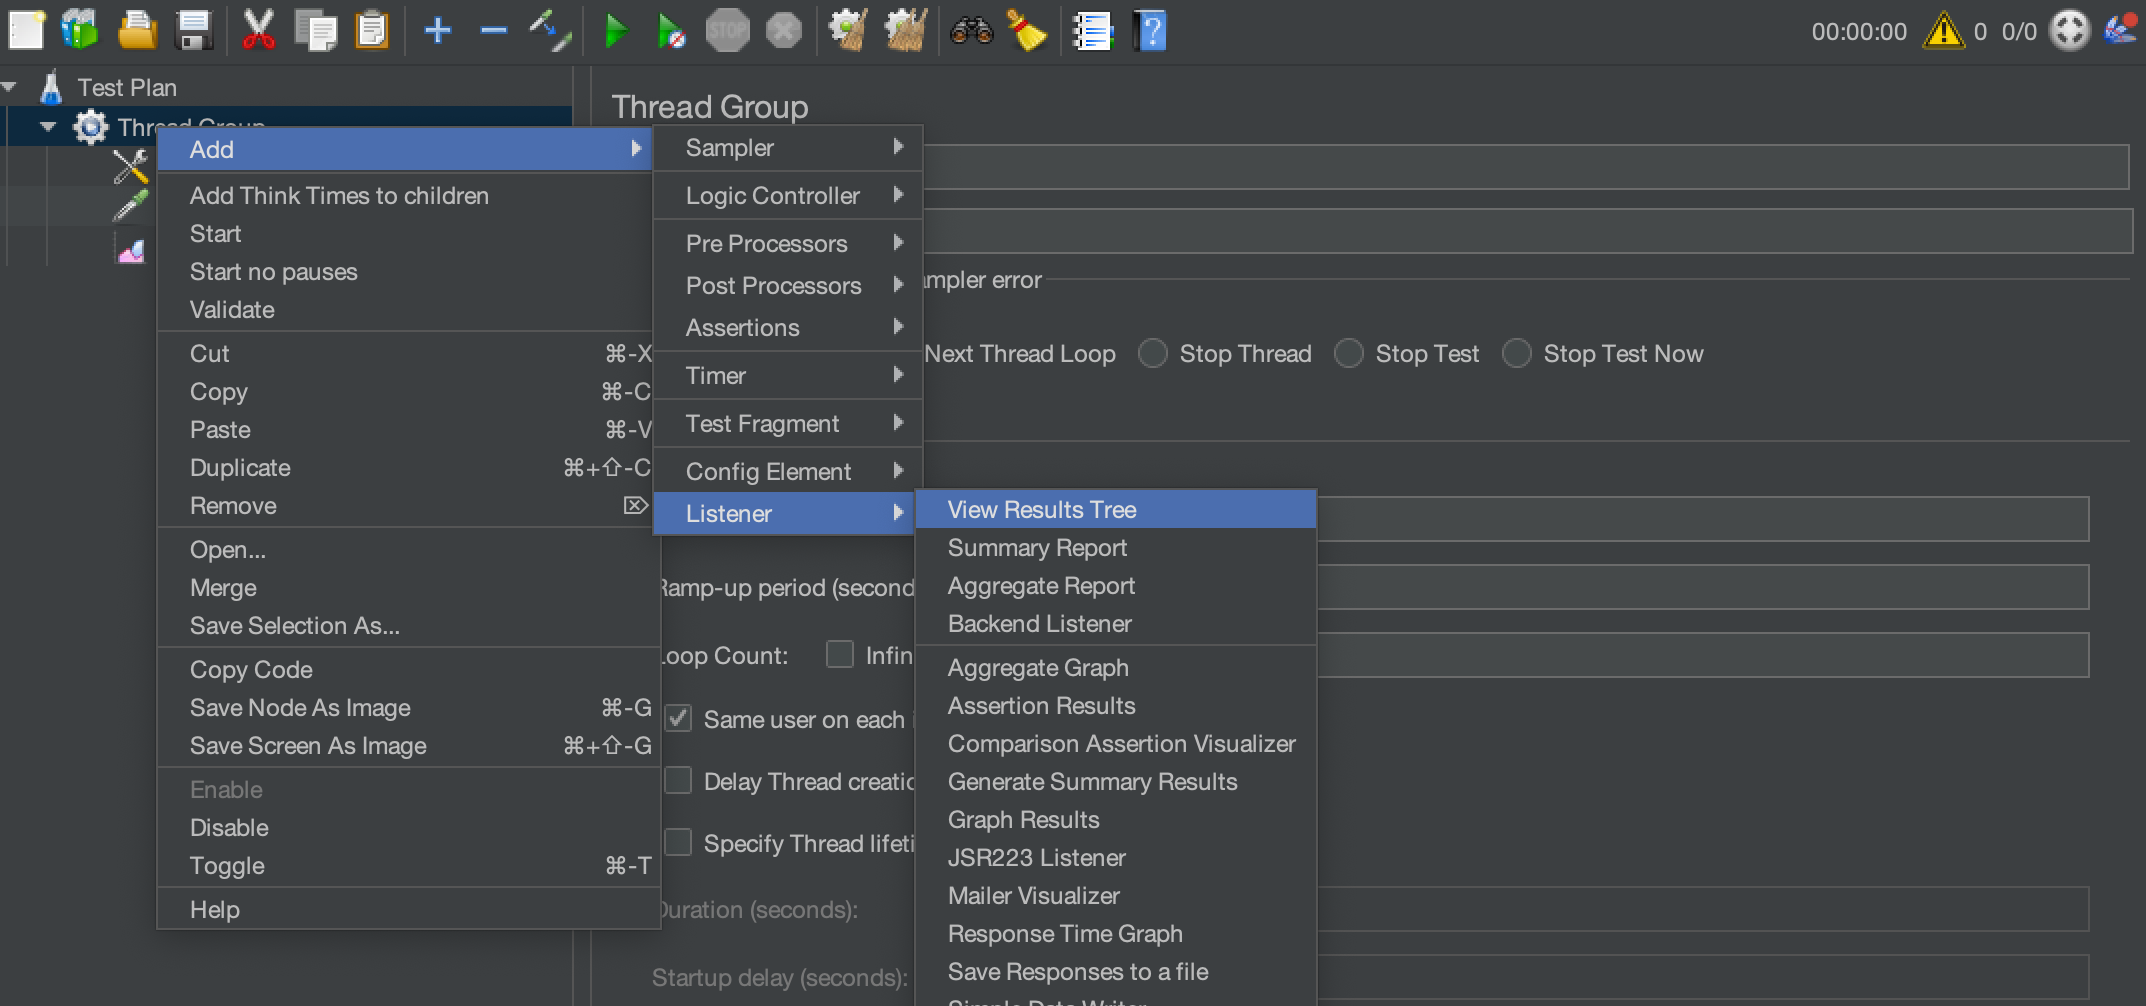
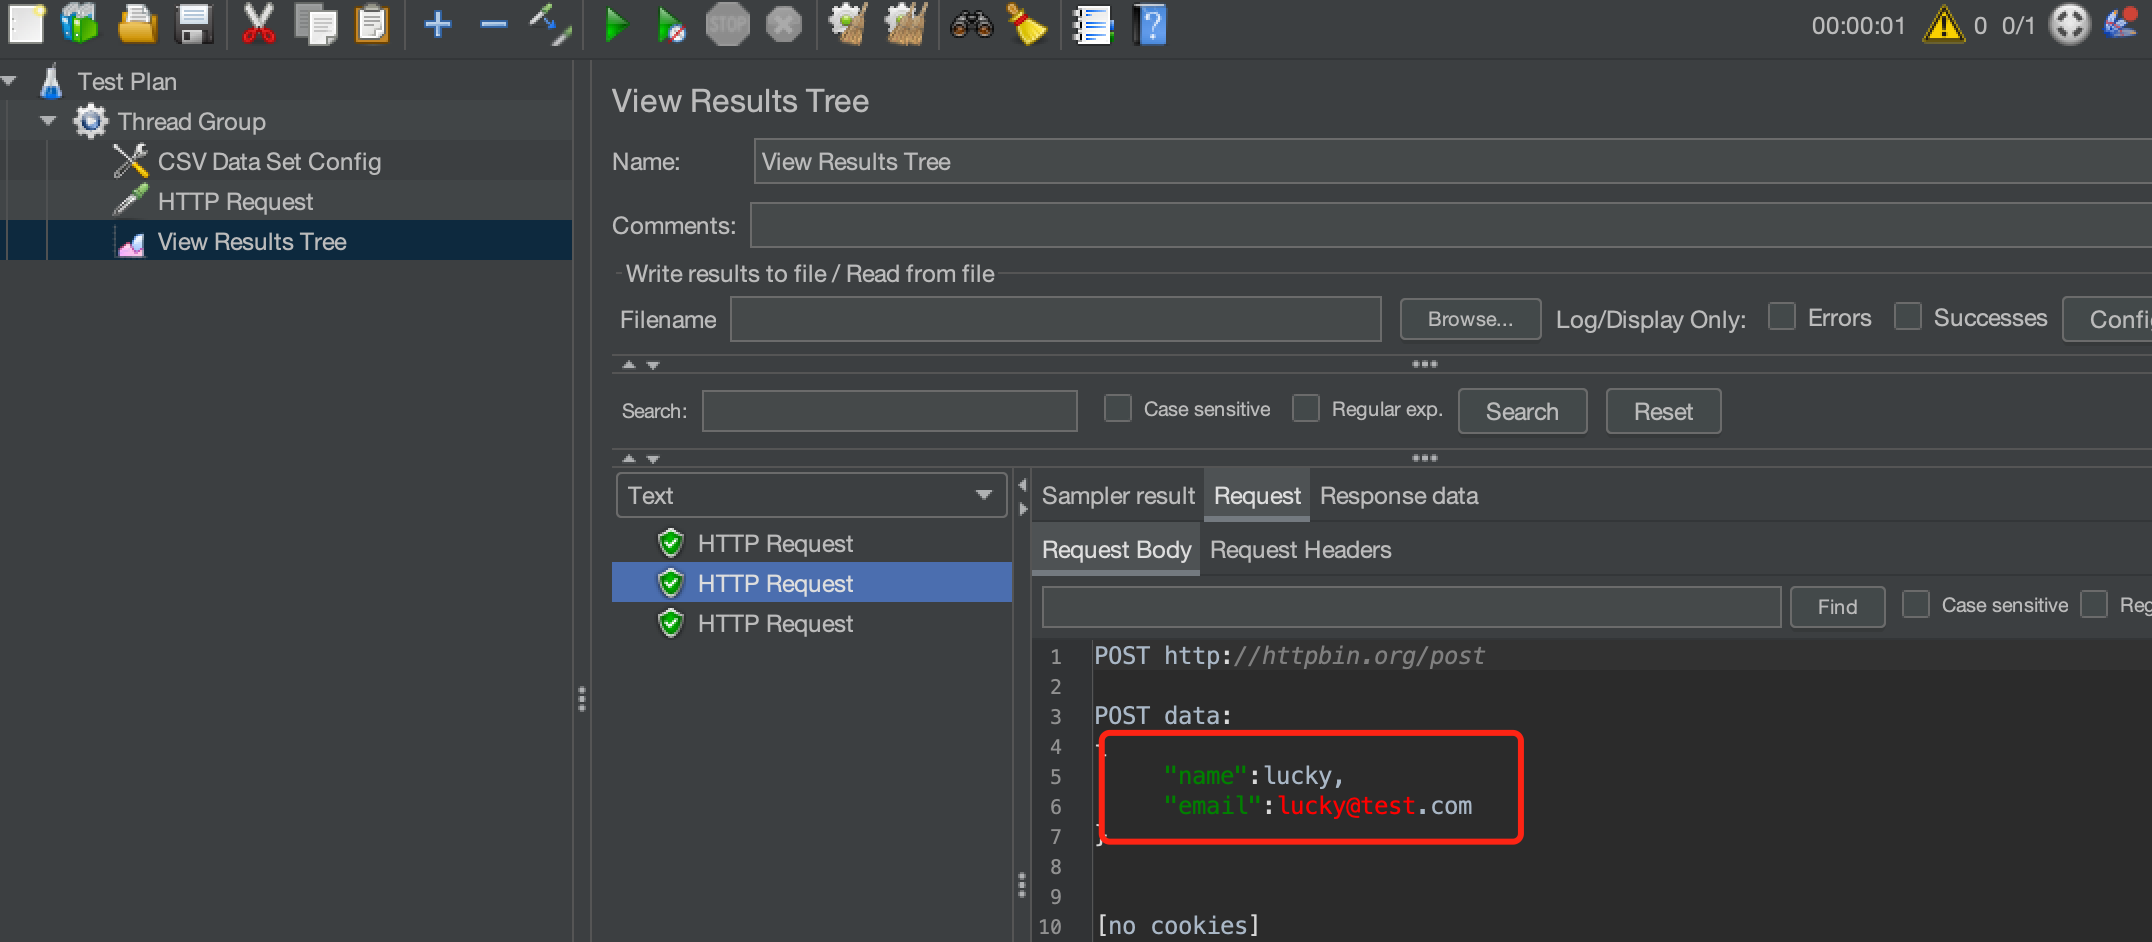
3. Right-click Thread Group and choose Add > Listener > View Result Tree. On the View Result Tree page, we can view the data sent and returned for each request to confirm whether CSV Data Set Config configured above takes effect.
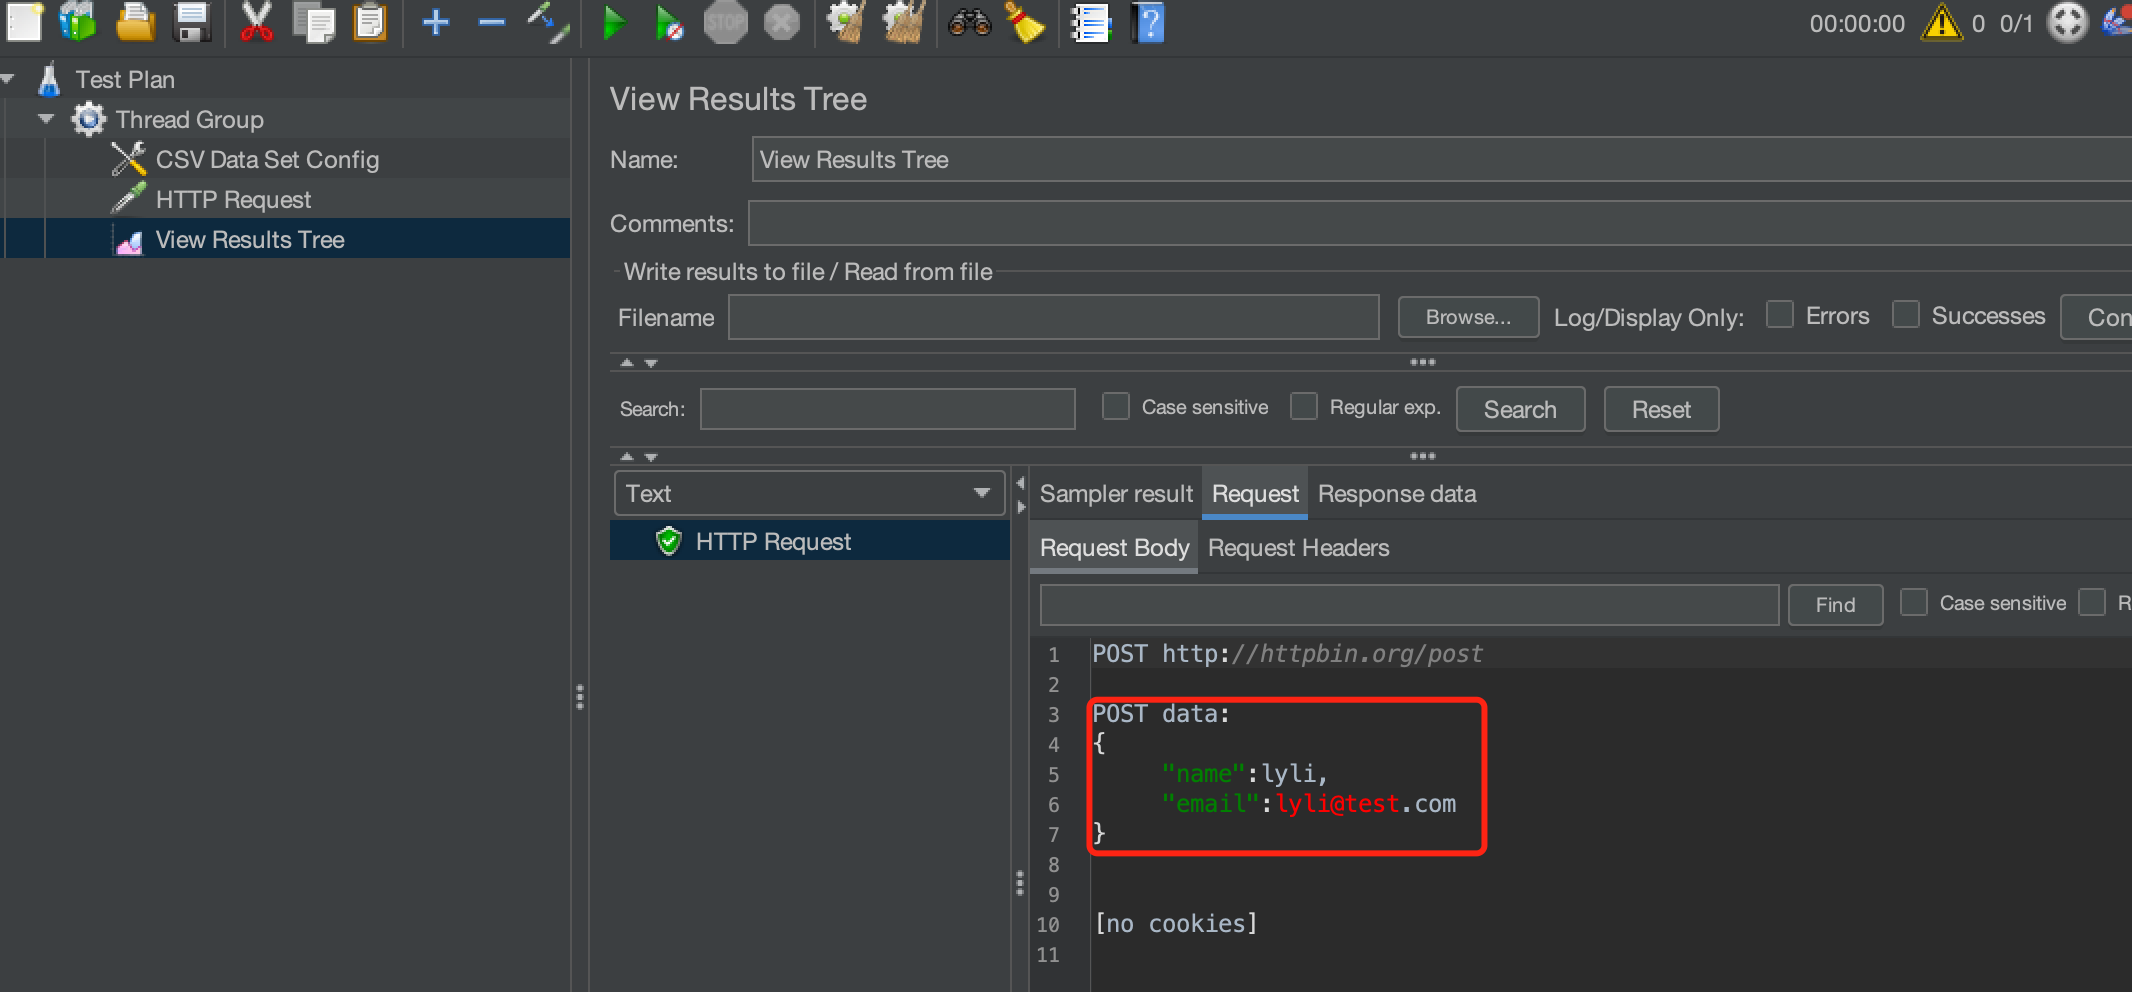
4. Run the thread group and view the data requested on the View Result Tree page. We can view that a total of two requests are sent, each with a different request body.
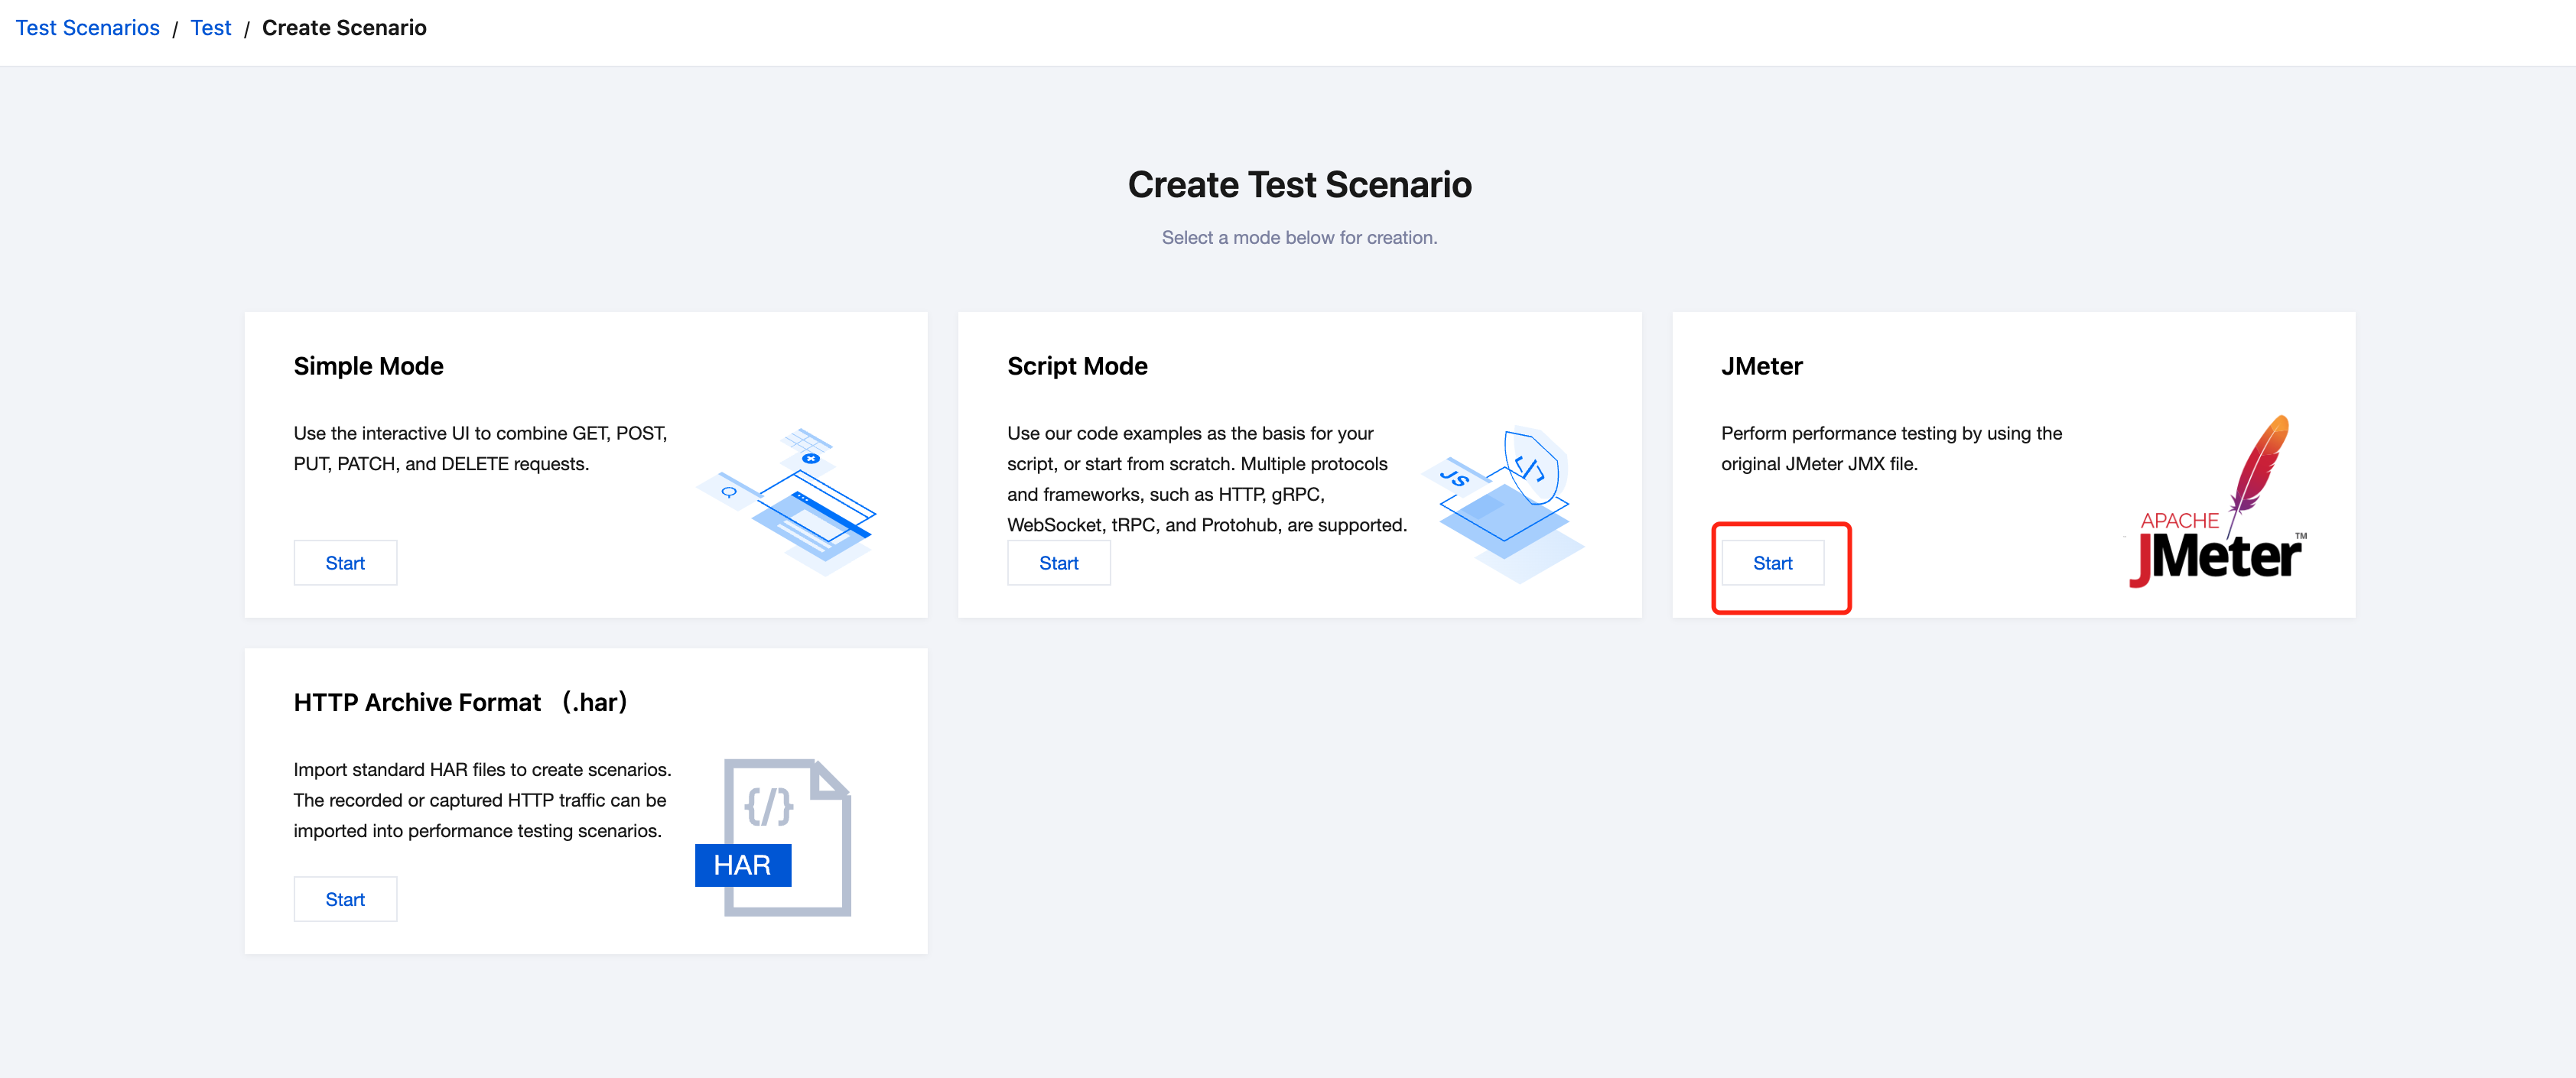
2. In the left sidebar, choose PTS > Test Scenarios and click Create Scenario.
3. On the page for creating a test scenario, select JMeter as the performance testing type and click Start to create a performance testing scenario.
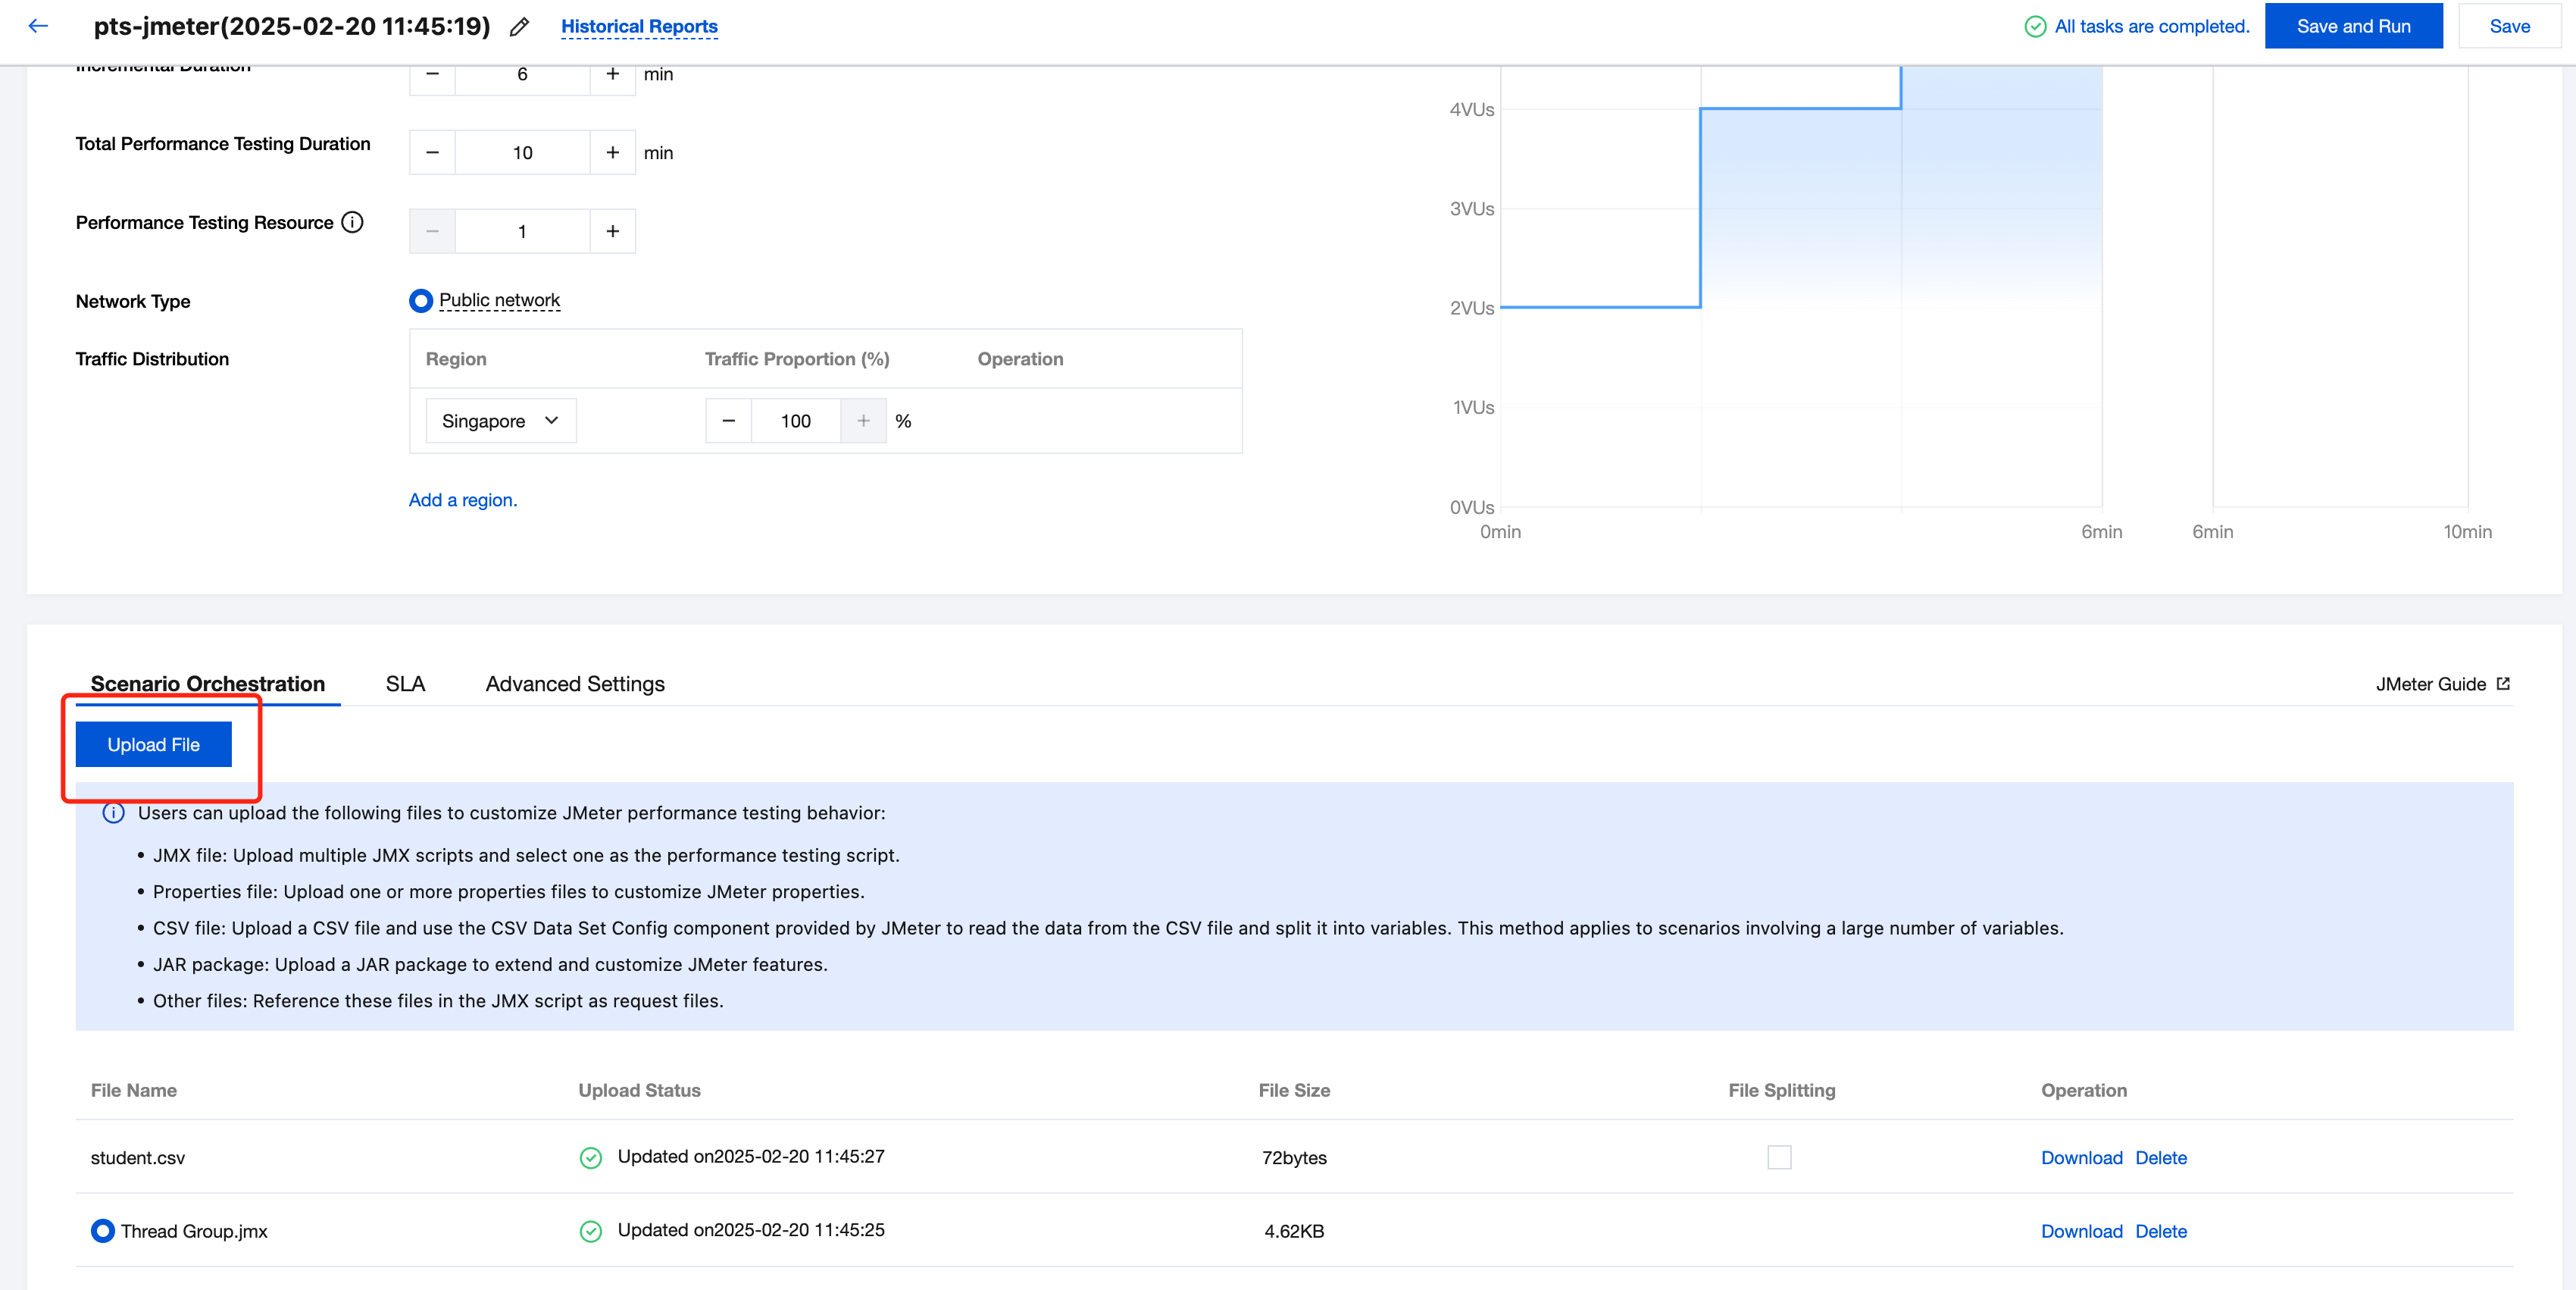
4. Upload the configured JMX and CSV files.
Note:
During the performance testing, PTS will automatically identify the CSV file path configured in the JMX file and replace it with that of a file with the same name uploaded by the user.
For example, if the CSV file path configured in the JMX file is /Users/ke/Desktop/student.csv, you only need to upload the student.csv file in PTS. PTS will automatically identify the file with the same name during the running, without requiring you to change the file path referenced in the JMX file.
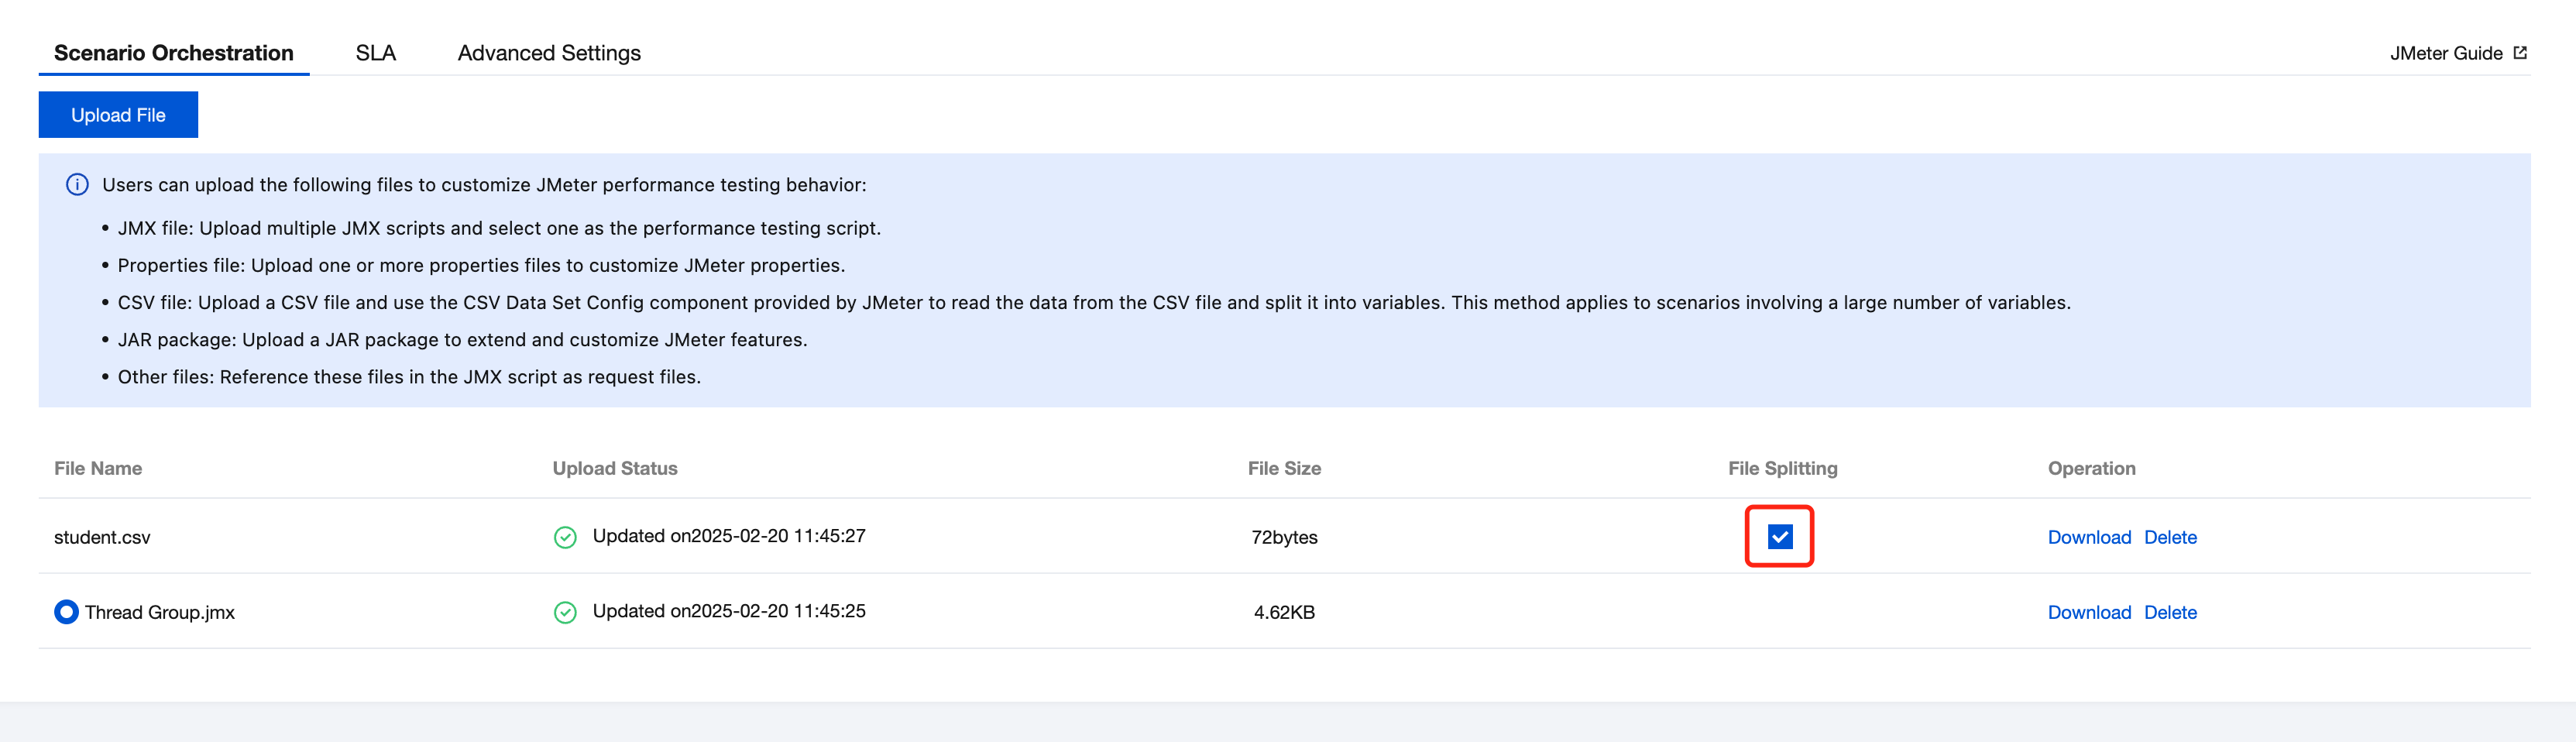
5. Split the CSV file. PTS will automatically start multiple performance testing engines based on the user-configured concurrency and run the JMeter-based performance testing script in clustered mode. If you want each engine to execute a separate test case, you need to use the CSV file splitting feature.
5.1 Assume that the CSV file uploaded by the user is as follows:
name,email
lyli,lyli@test.com
lucky,lucky@test.com
lucas,lucas@test.com
5.2 Select the file splitting option.
If the concurrency configured by the user is large and 2 engines need to be scheduled to execute the performance testing task, the CSV testing data will be evenly distributed between the 2 engines.
The CSV file obtained by engine 1 is as follows:
name,email
lyli,lyli@test.com
lucky,lucky@test.com
The CSV file obtained by engine 2 is as follows:
name,email
lucas,lucas@test.com
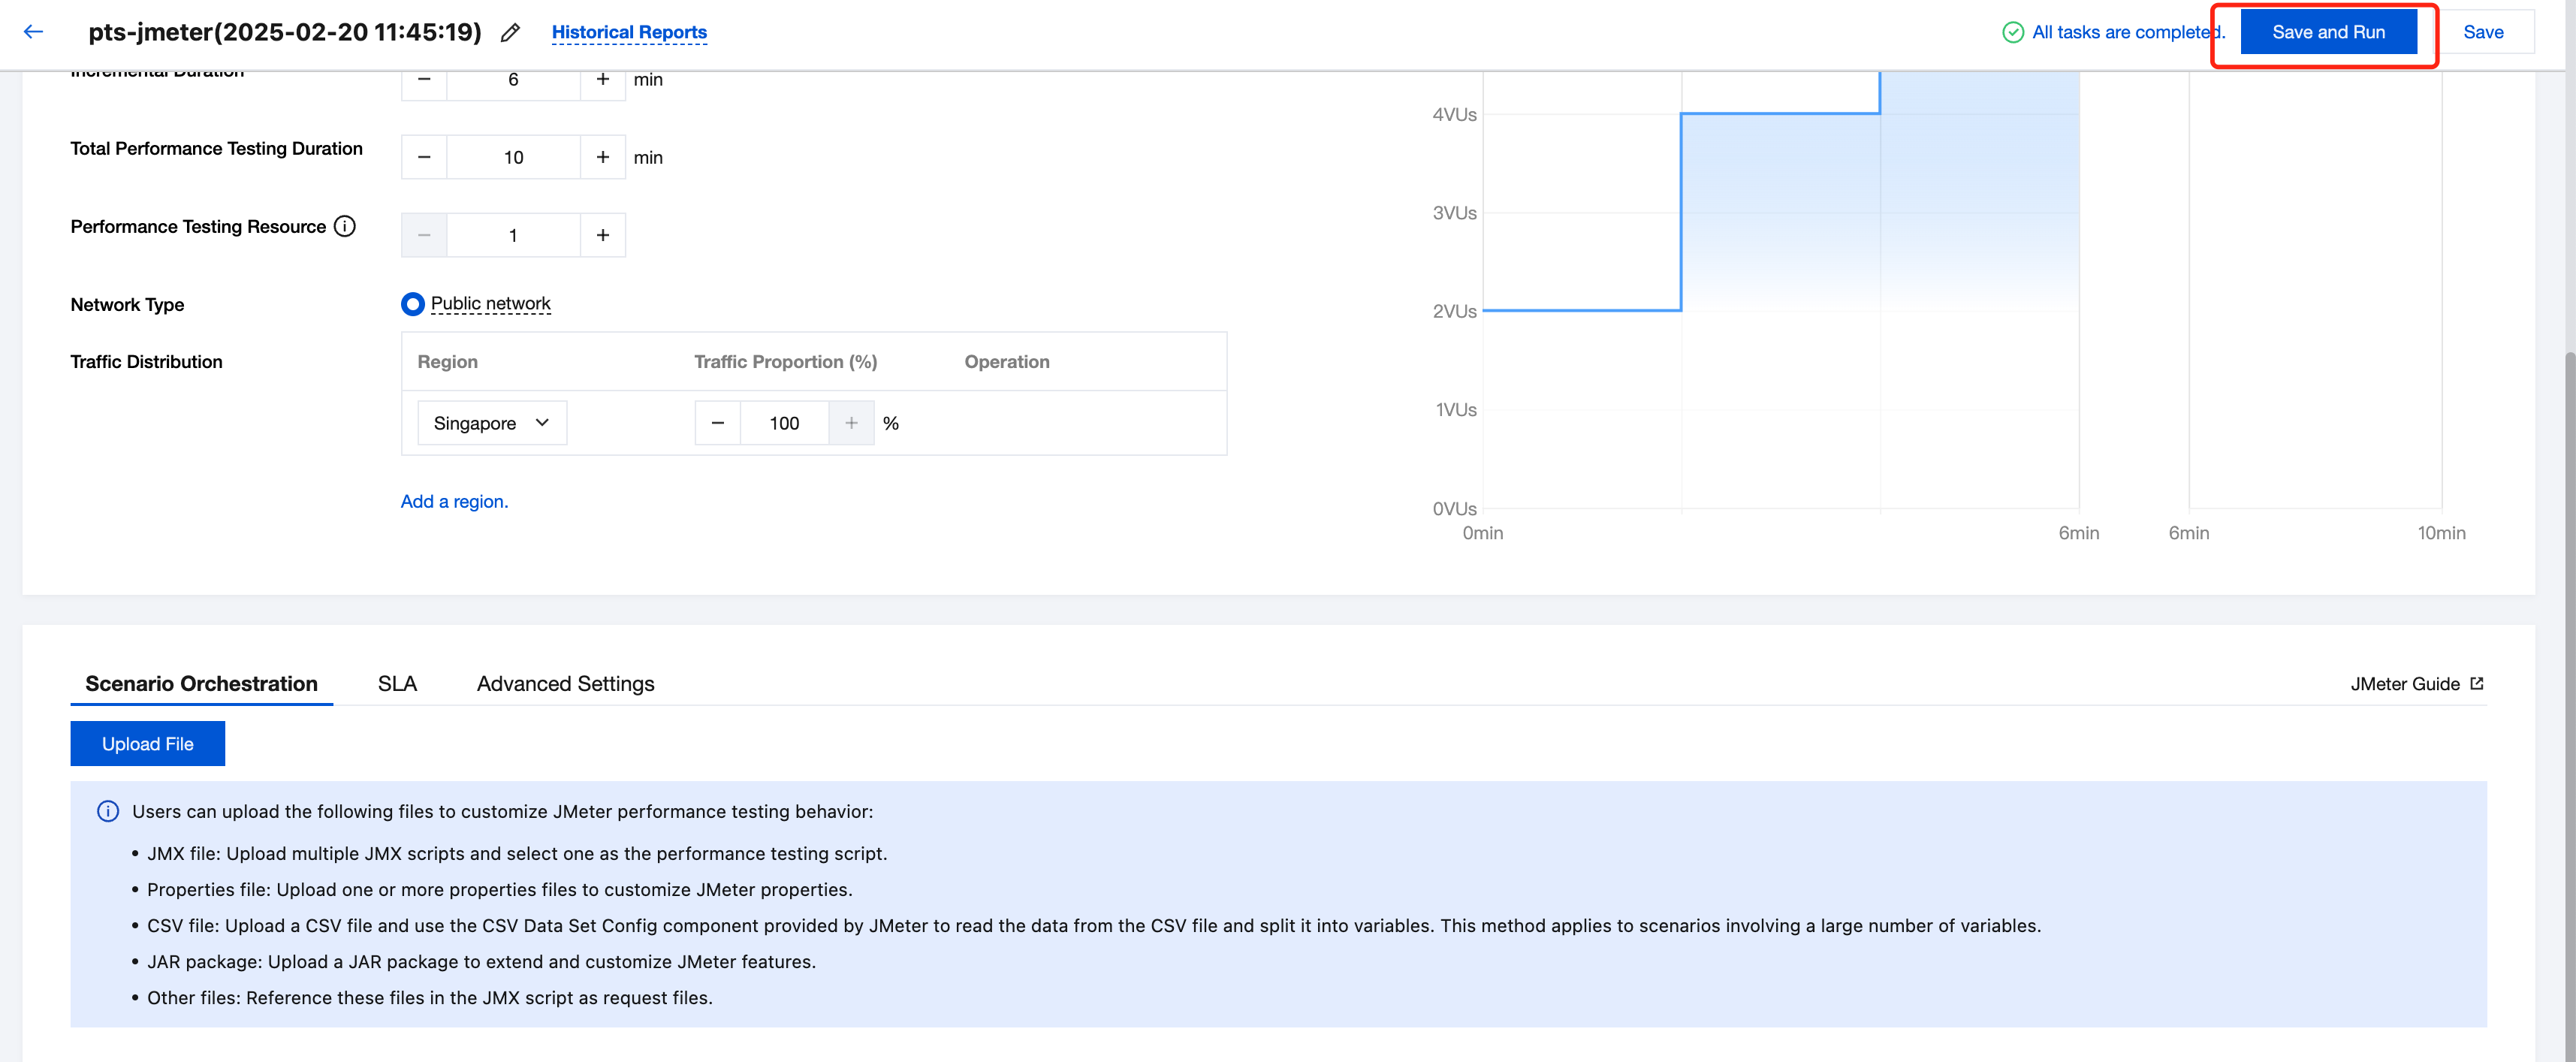
6. Click Save and Run to start the performance testing.