Release Notes
Stress Configuration
Stress configuration is used to control the traffic during performance testing, simulating the traffic variations and distributions found in real business scenarios.
In the Stress Configuration section of a scenario, you can configure parameters related to the performance testing mode, duration of the performance testing, sources of stress, and more, to manage the stress testing traffic.
Stress Mode
Concurrent Mode
Concurrency refers to the number of virtual concurrent users. From a business perspective, this can also be understood as the number of users online at the same time. It can be used to gauge the maximum real-time concurrency that a business system can support.
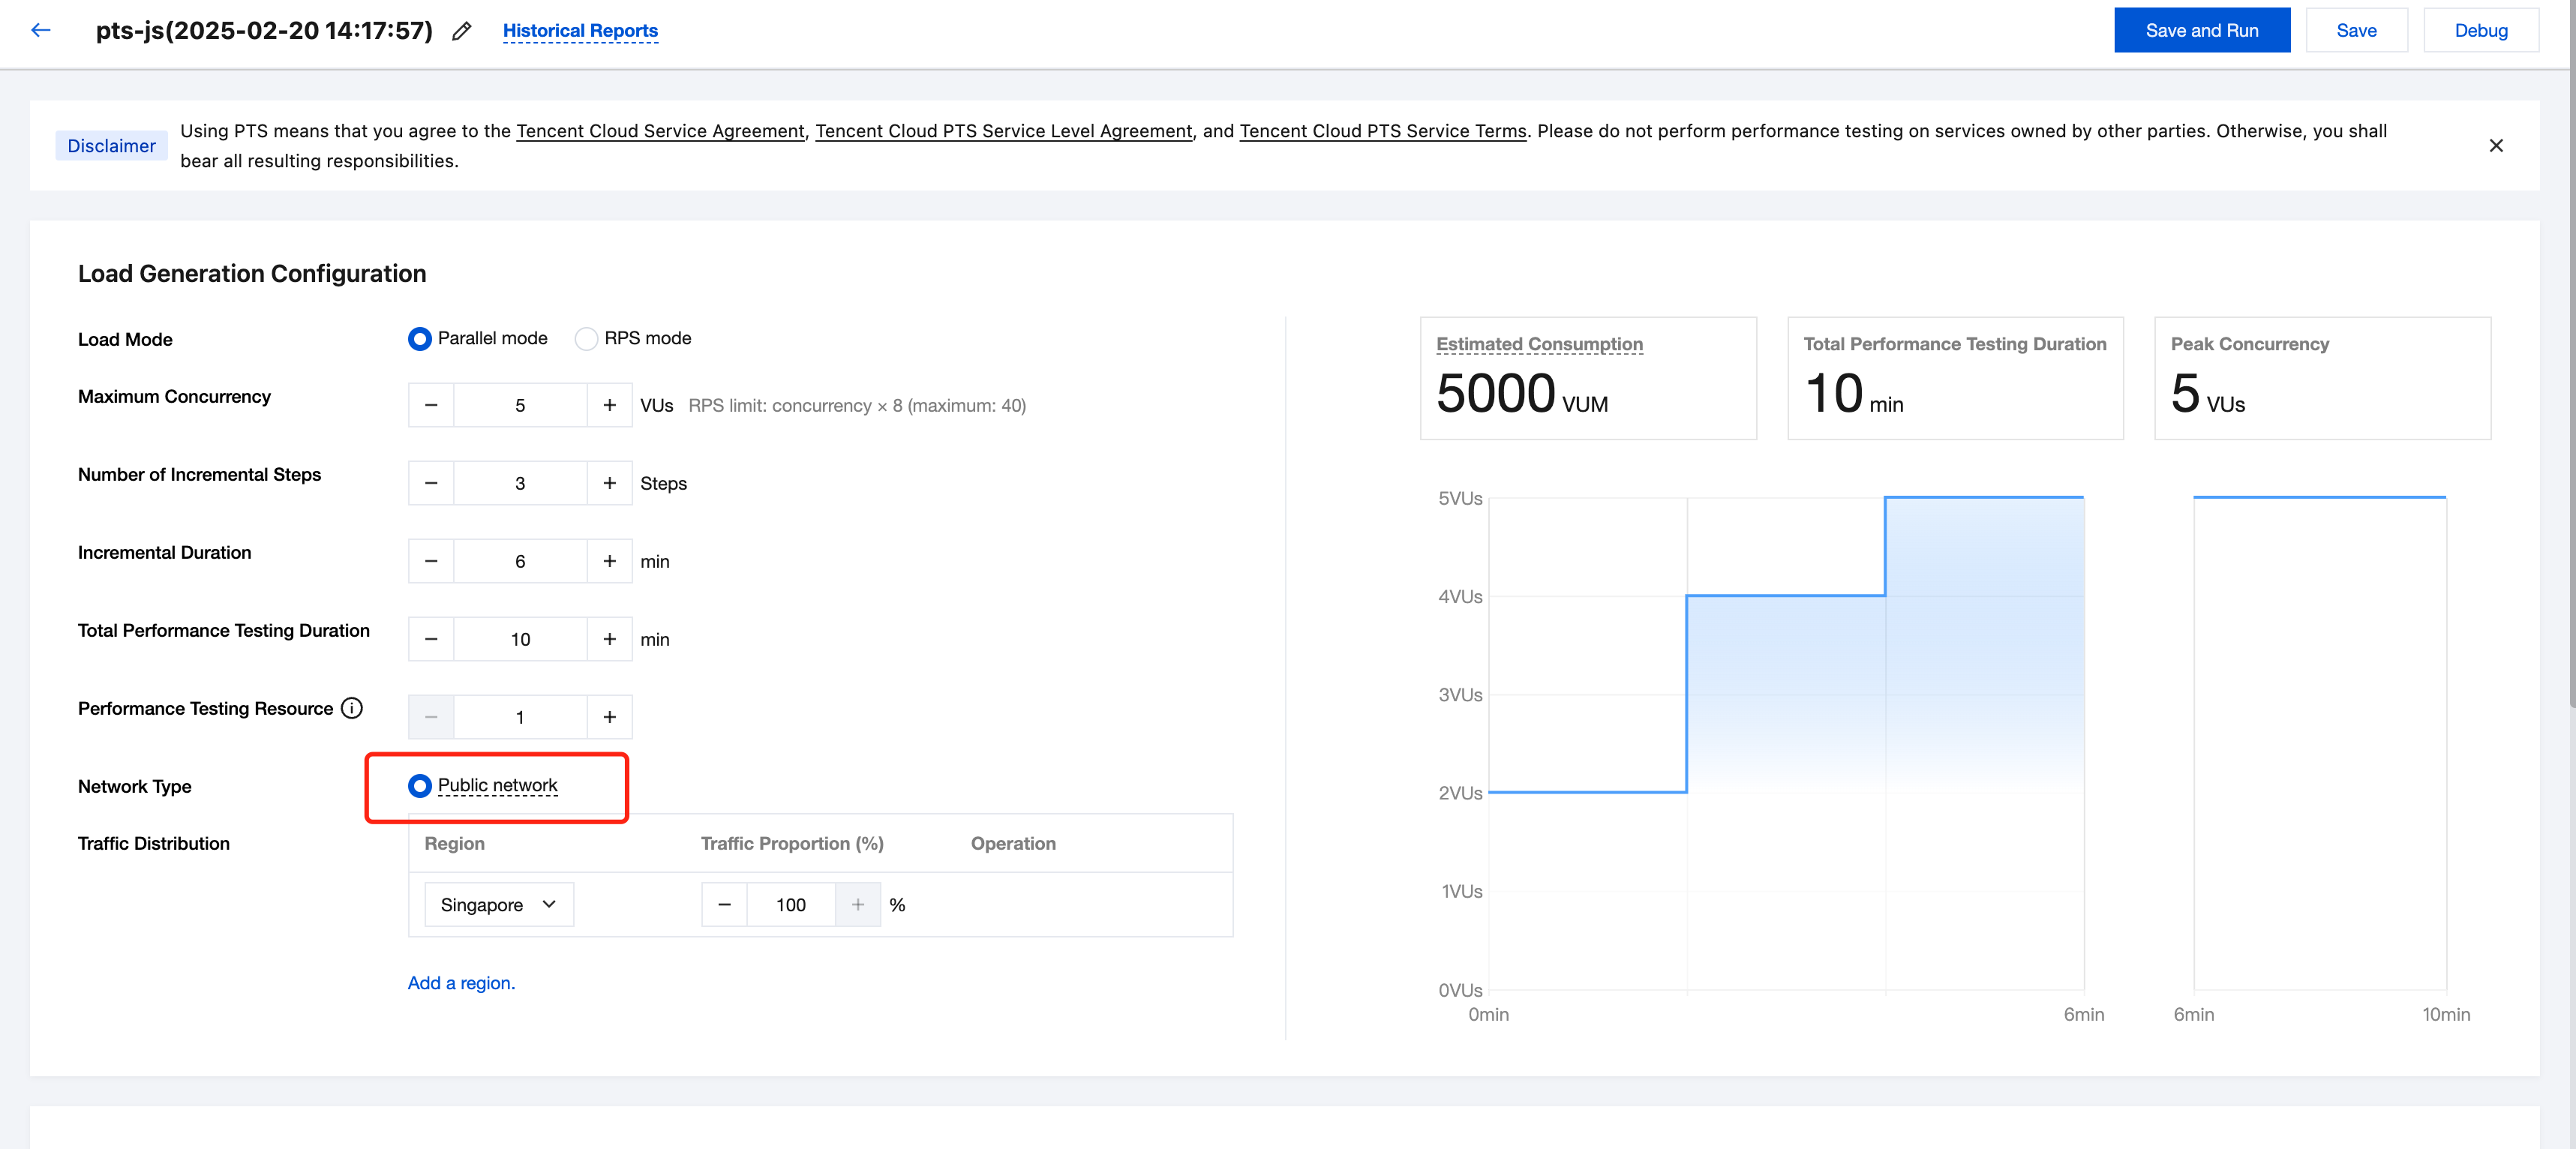
Maximum concurrency (Max VUs): The maximum number of virtual users (VUs). A load generator typically implements one VU per thread, with each VU repeatedly executing the performance testing script.
Incremental steps: During the process of incrementing VUs, the incremental duration should be evenly divided into several stages to reach the maximum concurrency. (It is recommended to have 3-5 steps, too many steps with frequent changes may affect thread warm-up and startup)
Total ramp-up time: The duration over which VUs are incremented.
Total performance testing duration: The total duration of a round of stress testing, including the running time during the VU increment and the steady-status running time after reaching the maximum number of VUs.
RPS Mode
RPS stands for requests per second, which is used to measure the server-side throughput. The RPS mode eliminates the cumbersome conversion from concurrency to RPS, allowing for a better assessment of business performance bottlenecks.
Maximum RPS: The upper limit of RPS for stress testing, which is used to gauge the target throughput of the business system. PTS will allocate appropriate performance testing resources based on the maximum RPS.
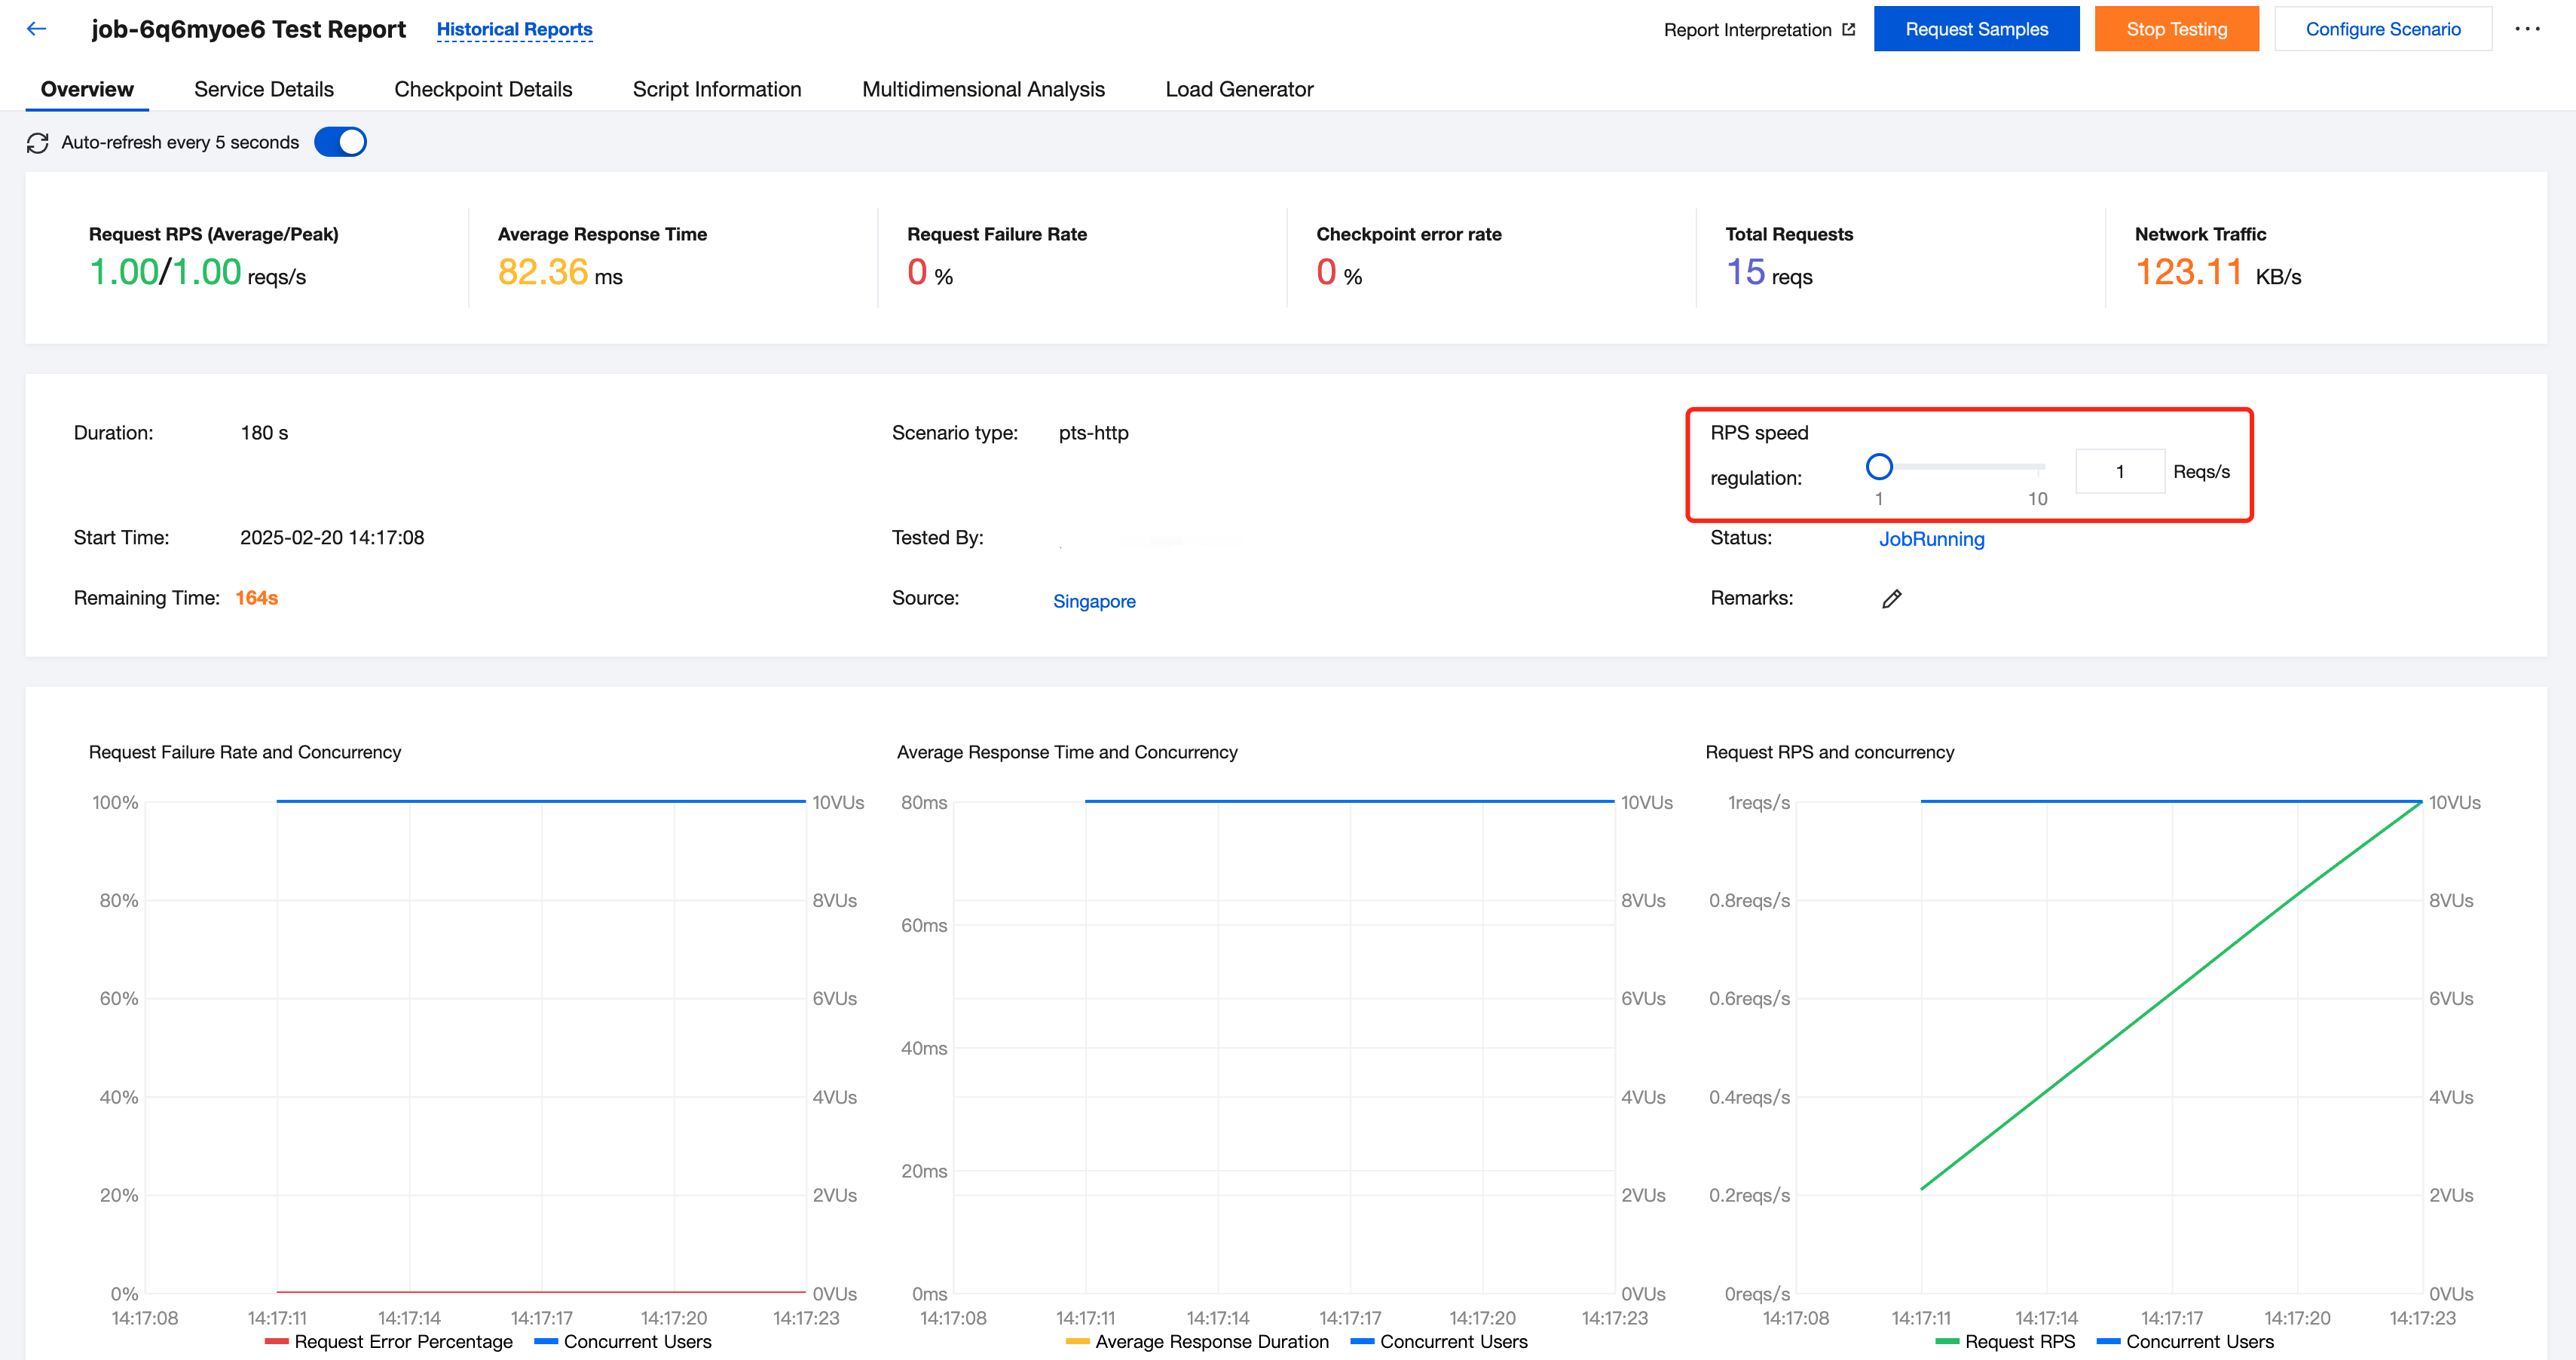
Starting RPS: The initial RPS for stress testing, where users can manually adjust the RPS during the testing and observe changes in report metrics.
Total performance testing duration: The total duration of a round of stress testing.
Performance testing resources: PTS will reasonably allocate the performance testing resource pool based on the maximum RPS set by the user. If your request responses are slow, you can ensure that the target throughput is reached by appropriately expanding the performance testing resource pool.
Traffic distribution: Distribute the total performance testing traffic across multiple regions by a certain percentage to simulate the traffic brought by users from different regions in real scenarios.
In the RPS performance testing mode, users can adjust the RPS on the Performance Testing Report page and observe changes in overall system metrics in real time.
Note:
Scenarios for simple mode and script mode: Configure RPS performance testing from the PTS console.
Scenarios for JMeter mode: When a JMeter performance testing script is written, use JMeter's native RPS mode, and then upload the script to PTS.
Network Traffic Configuration
Based on the different sources of performance testing traffic, PTS supports the public network type.
If you choose Public Network, the performance testing traffic will be sent from the public network resources allocated to you by PTS.
Public Network
If you choose Public Network, you can perform performance testing on service addresses that are accessible from the public network.
Traffic distribution: Distribute the total performance testing traffic across multiple regions by a certain percentage to simulate the traffic brought by users from different regions in real scenarios.
Performance Testing Resources
In PTS, a performance testing resource is the fundamental unit for engine scheduling.
A single performance testing resource provides 500 concurrent connections and 100 MB of network bandwidth (100 MB for both upstream and downstream). In PTS, a performance testing resource is a virtual concept representing a collection of resources. PTS ensures that after the scheduling of performance testing resources, they are isolated from each other. Using virtualization technology, multiple performance testing resources can be scheduled to the same physical server to share an IP address, or they may have exclusive IP addresses.
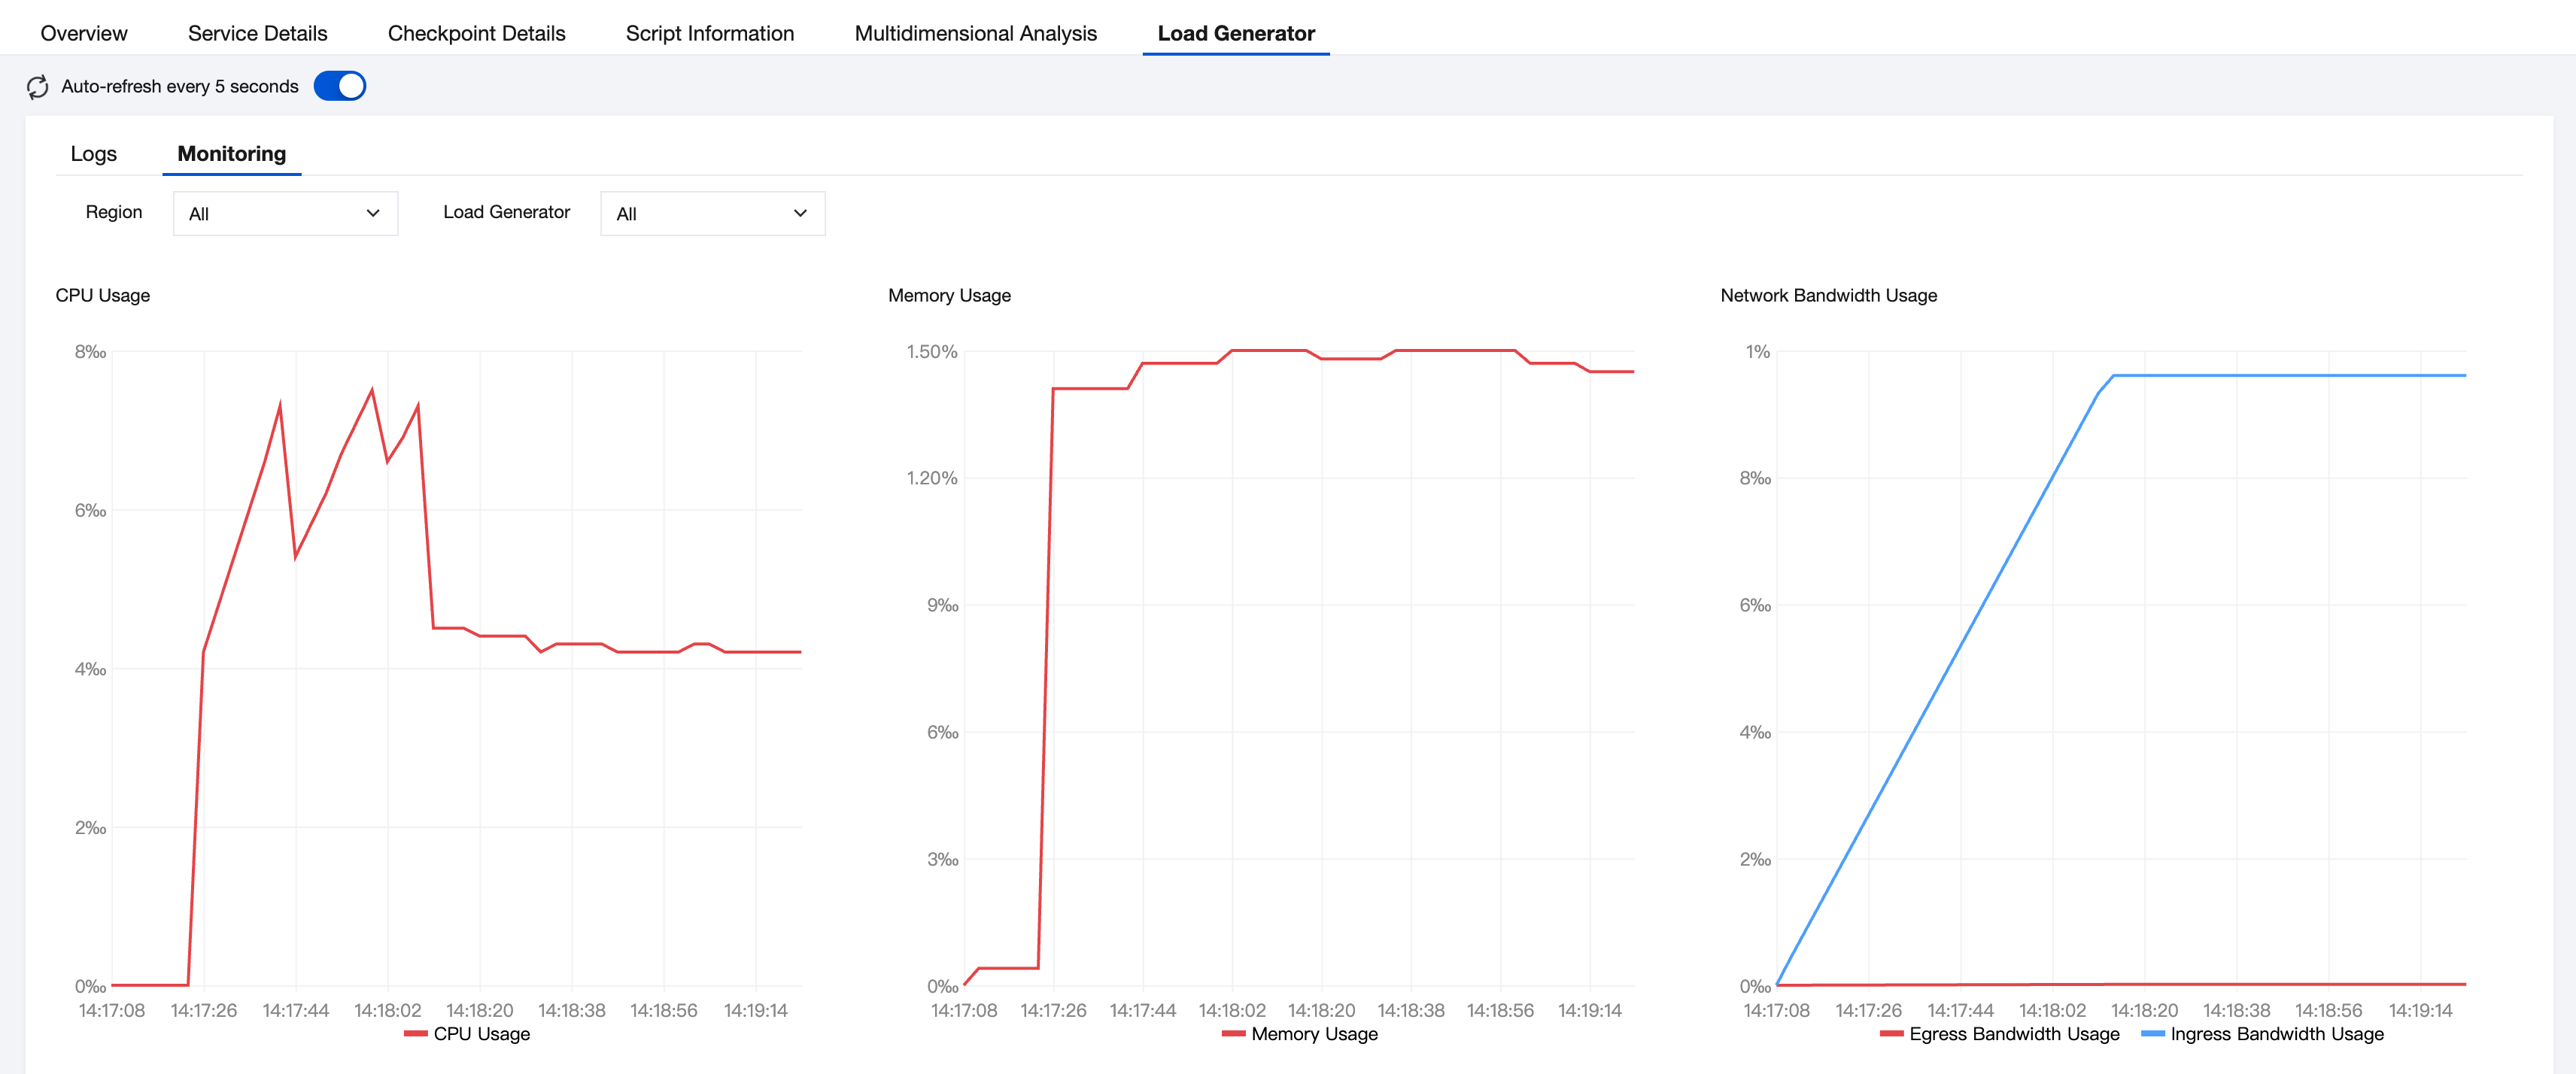
You can view the utilization rate of your performance testing resources in the stress report. You can review the utilization of your performance testing resources through the performance testing report.
피드백