tencent cloud

Tencent Cloud Observability Platform

Release Notes and Announcements
Release Notes
Product Introduction
Overview
Strengths
Basic Features
Basic Concepts
Use Cases
Use Limits
Purchase Guide
Tencent Cloud Product Monitoring
Application Performance Management
Mobile App Performance Monitoring
Real User Monitoring
Cloud Automated Testing
Prometheus Monitoring
Grafana
EventBridge
PTS
Quick Start
Monitoring Overview
Instance Group
Tencent Cloud Product Monitoring
Application Performance Management
Real User Monitoring
Cloud Automated Testing
Performance Testing Service
Prometheus Getting Started
Grafana
Dashboard Creation
EventBridge
Alarm Service
Cloud Product Monitoring
Tencent Cloud Service Metrics
Operation Guide
CVM Agents
Cloud Product Monitoring Integration with Grafana
Troubleshooting
Practical Tutorial
Application Performance Management
Product Introduction
Access Guide
Operation Guide
Practical Tutorial
Parameter Information
FAQs
Mobile App Performance Monitoring
Overview
Operation Guide
Access Guide
Practical Tutorial
Tencent Cloud Real User Monitoring
Product Introduction
Operation Guide
Connection Guide
FAQs
Cloud Automated Testing
Product Introduction
Operation Guide
FAQs
Performance Testing Service
Overview
Operation Guide
Practice Tutorial
JavaScript API List
FAQs
Prometheus Monitoring
Product Introduction
Access Guide
Operation Guide
Practical Tutorial
Terraform
FAQs
Grafana
Product Introduction
Operation Guide
Guide on Grafana Common Features
FAQs
Dashboard
Overview
Operation Guide
Alarm Management
Console Operation Guide
Troubleshooting
FAQs
EventBridge
Product Introduction
Operation Guide
Practical Tutorial
FAQs
Report Management
FAQs
General
Alarm Service
Concepts
Monitoring Charts
CVM Agents
Dynamic Alarm Threshold
CM Connection to Grafana
Documentation Guide
Related Agreements
Application Performance Management Service Level Agreement
APM Privacy Policy
APM Data Processing And Security Agreement
RUM Service Level Agreement
Mobile Performance Monitoring Service Level Agreement
Cloud Automated Testing Service Level Agreement
Prometheus Service Level Agreement
TCMG Service Level Agreements
PTS Service Level Agreement
PTS Use Limits
Cloud Monitor Service Level Agreement
API Documentation
History
Introduction
API Category
Making API Requests
Monitoring Data Query APIs
Alarm APIs
Legacy Alert APIs
Notification Template APIs
TMP APIs
Grafana Service APIs
Event Center APIs
TencentCloud Managed Service for Prometheus APIs
Monitoring APIs
Data Types
Error Codes
Glossary

Recording Browser Traffic

PDF
포커스 모드
폰트 크기
마지막 업데이트 시간: 2025-03-10 22:20:39
You can install the Tencent PTS Recorder traffic recording plugin on Chrome. The PTS Recorder will record your operations and the requests sent along with the corresponding response content from the browser, and it will automatically generate a PTS performance testing scenario.
This document introduces how to use the PTS traffic recording feature to help you quickly simulate business scenarios and initiate performance testing.

Directions

Installing Plugin

1. Download the PTS Recorder plugin to your local drive and unzip it.
2. Open the Chrome browser and type chrome://extensions/ in the address bar to enter the extensions management page. Click the button in the top-right corner of the Extensions page to switch to Developer mode.


3. Click Load unpacked in the top-left corner and select the PTS Recorder plugin that you have downloaded and unzipped.
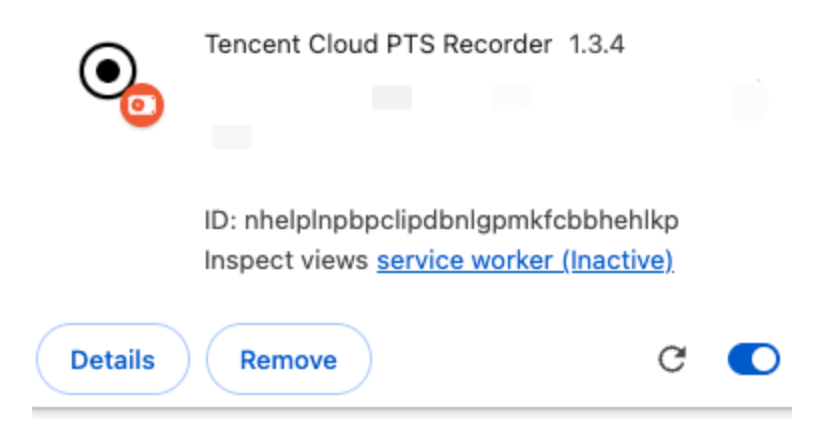
4. If Tencent Cloud PTS Recorder appears in the list of Chrome browser plugins, it indicates that the installation was successful.
5. After you successfully install the plugin, click Refresh Page, and then click Traffic Recording again.
6. After the plugin is installed, you can click

icon in the top menu bar of the Chrome browser, and then click

icon next to the PTS Recorder plugin, to pin this plugin.


Using the Plugin

1. After the plugin is installed, fill in the following information and click Start Recording.
Starting page: The page to which the recorder will navigate after it starts; this is where the recording of user operation traffic begins.
URL filtering: By using URL filtering, you can record the traffic that interests you. For example, if you are only concerned with requests sent to the domain name console.cloud.tencent.com, you may enter this domain name in the URL filtering field.
Type filtering: Select to record only the types of requests that interest you.
Note:
Recording type:
XHR: application/json, text/xml, text/plain, and application/xml.
JS: application/javascript, text/javascript, and application/x-javascript.
HTML: text/html
CSS: text/css
Image: image/*
Others: others/*, application/json, text/xml, text/plain, application/xml, -application/javascript, text/javascript, application/x-javascript, text/html, text/css, and image/*
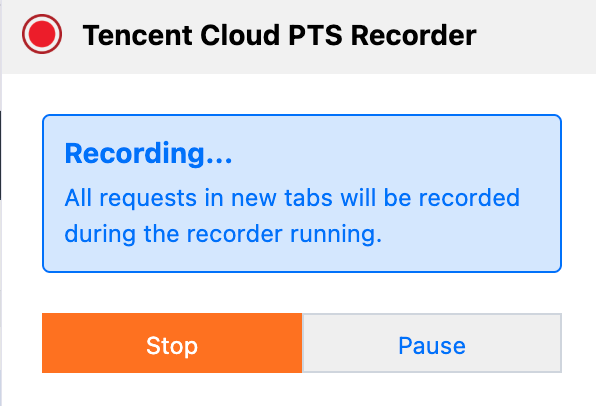
2. Perform your operations on the recording page, and PTS will automatically record your operations. You can see a prompt indicating that PTS is recording below the bottom menu bar of your browser. By clicking the PTS plugin, you can also see the prompt indicating that it is currently recording.


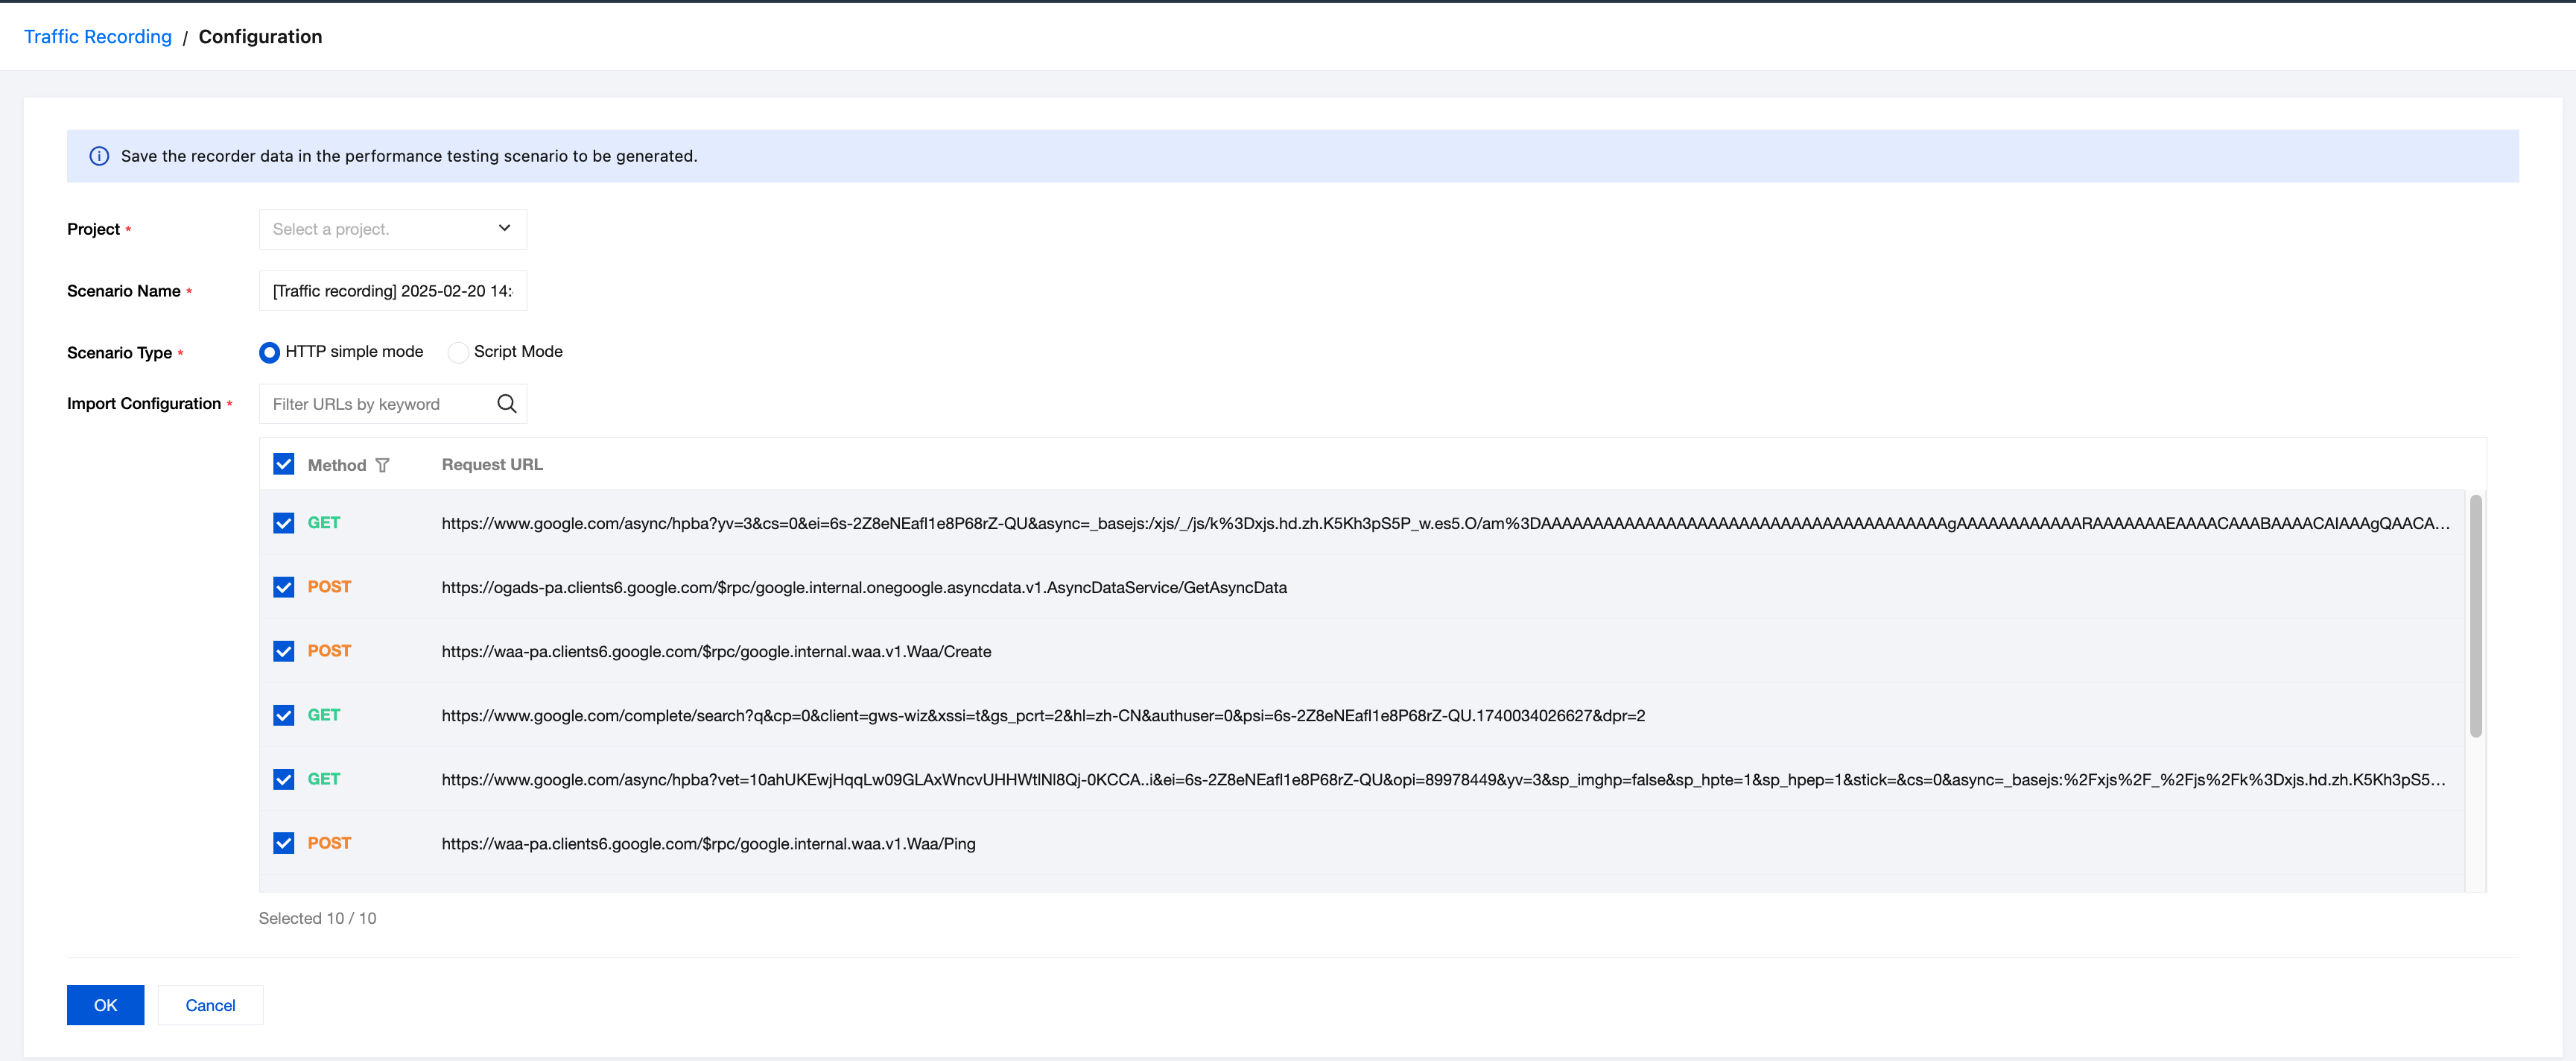
3. After performing operations, you can click Cancel in the prompt below the bottom menu bar of the browser, or click Stop Recording in the PTS plugin. On the traffic recording page, filter out the requests that interest you and generate a performance testing scenario.


도움말 및 지원

문제 해결에 도움이 되었나요?

피드백