tencent cloud

Tencent Cloud Observability Platform

Release Notes and Announcements
Release Notes
Product Introduction
Overview
Strengths
Basic Features
Basic Concepts
Use Cases
Use Limits
Purchase Guide
Tencent Cloud Product Monitoring
Application Performance Management
Mobile App Performance Monitoring
Real User Monitoring
Cloud Automated Testing
Prometheus Monitoring
Grafana
EventBridge
PTS
Quick Start
Monitoring Overview
Instance Group
Tencent Cloud Product Monitoring
Application Performance Management
Real User Monitoring
Cloud Automated Testing
Performance Testing Service
Prometheus Getting Started
Grafana
Dashboard Creation
EventBridge
Alarm Service
Cloud Product Monitoring
Tencent Cloud Service Metrics
Operation Guide
CVM Agents
Cloud Product Monitoring Integration with Grafana
Troubleshooting
Practical Tutorial
Application Performance Management
Product Introduction
Access Guide
Operation Guide
Practical Tutorial
Parameter Information
FAQs
Mobile App Performance Monitoring
Overview
Operation Guide
Access Guide
Practical Tutorial
Tencent Cloud Real User Monitoring
Product Introduction
Operation Guide
Connection Guide
FAQs
Cloud Automated Testing
Product Introduction
Operation Guide
FAQs
Performance Testing Service
Overview
Operation Guide
Practice Tutorial
JavaScript API List
FAQs
Prometheus Monitoring
Product Introduction
Access Guide
Operation Guide
Practical Tutorial
Terraform
FAQs
Grafana
Product Introduction
Operation Guide
Guide on Grafana Common Features
FAQs
Dashboard
Overview
Operation Guide
Alarm Management
Console Operation Guide
Troubleshooting
FAQs
EventBridge
Product Introduction
Operation Guide
Practical Tutorial
FAQs
Report Management
FAQs
General
Alarm Service
Concepts
Monitoring Charts
CVM Agents
Dynamic Alarm Threshold
CM Connection to Grafana
Documentation Guide
Related Agreements
Application Performance Management Service Level Agreement
APM Privacy Policy
APM Data Processing And Security Agreement
RUM Service Level Agreement
Mobile Performance Monitoring Service Level Agreement
Cloud Automated Testing Service Level Agreement
Prometheus Service Level Agreement
TCMG Service Level Agreements
PTS Service Level Agreement
PTS Use Limits
Cloud Monitor Service Level Agreement
API Documentation
History
Introduction
API Category
Making API Requests
Monitoring Data Query APIs
Alarm APIs
Legacy Alert APIs
Notification Template APIs
TMP APIs
Grafana Service APIs
Event Center APIs
TencentCloud Managed Service for Prometheus APIs
Monitoring APIs
Data Types
Error Codes
Glossary

Non-Tencent Cloud Host Monitoring

PDF
포커스 모드
폰트 크기
마지막 업데이트 시간: 2024-12-13 11:21:07

Background

This document primarily guides you on how to quickly collect monitoring data from non-Tencent cloud hosts, reducing the configuration costs.

Connection Method

Method 1: One-Click Installation (Recommended)

Operation Steps

1. Log in to the TMP console.
2. Select the corresponding Prometheus instance from the instance list.
3. Enter the instance details page, click Data Collection > Integration Center.
4. In the Integration Center, locate and click External Node Exporter to open an installation window.


Step 1. Installing and Running node_exporter

1. Execute the following scripts on the host where data needs to be reported.
wget https://rig-1258344699.cos.ap-guangzhou.myqcloud.com/prometheus-agent/node_exporter_install -O node_exporter_install && chmod +x
node_exporter_install && ./node_exporter_install
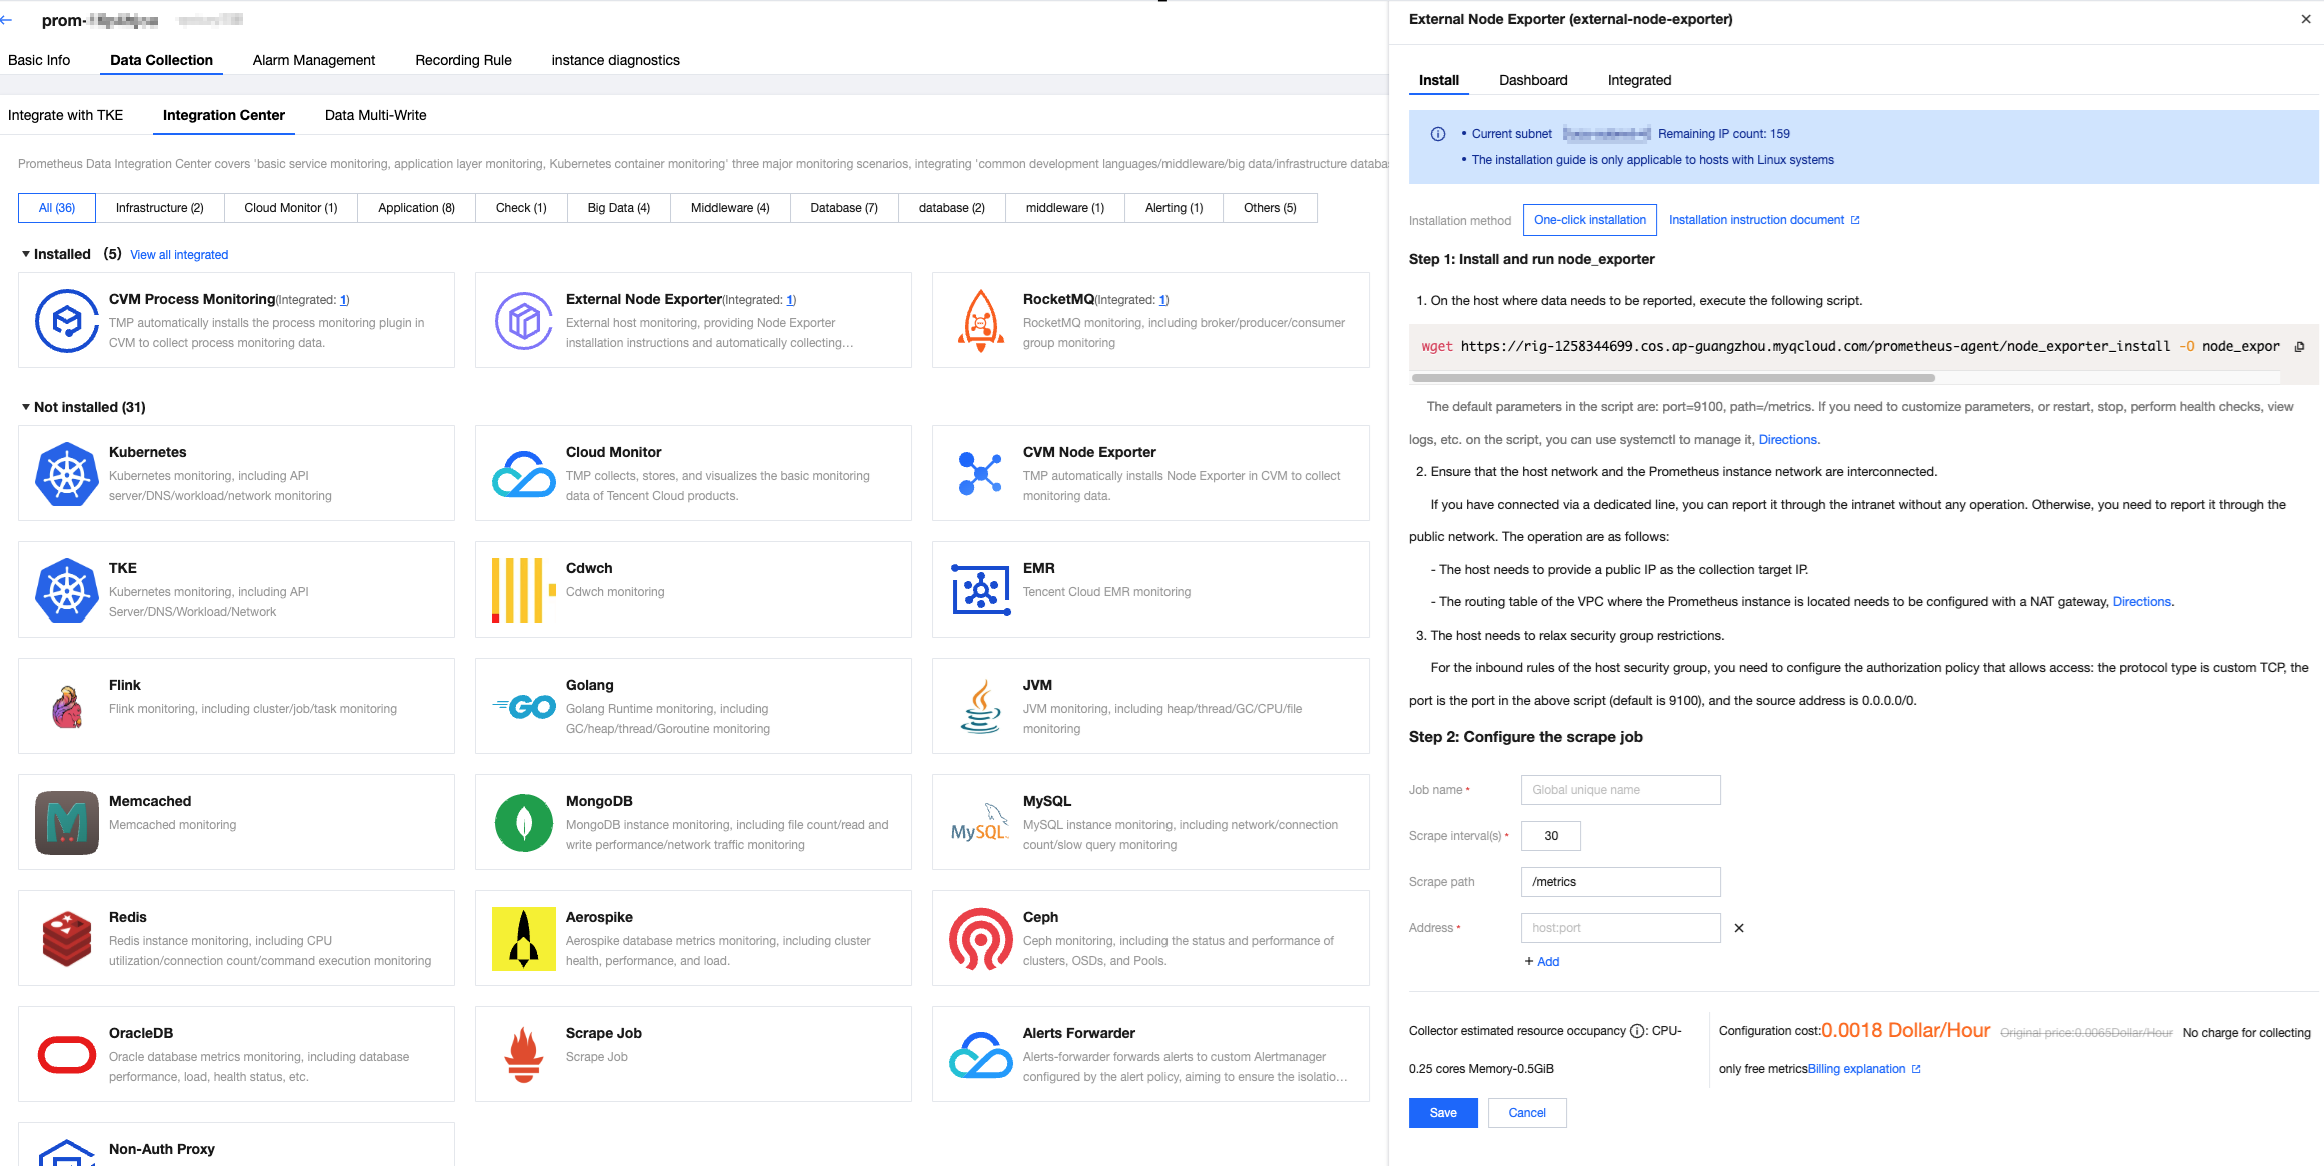
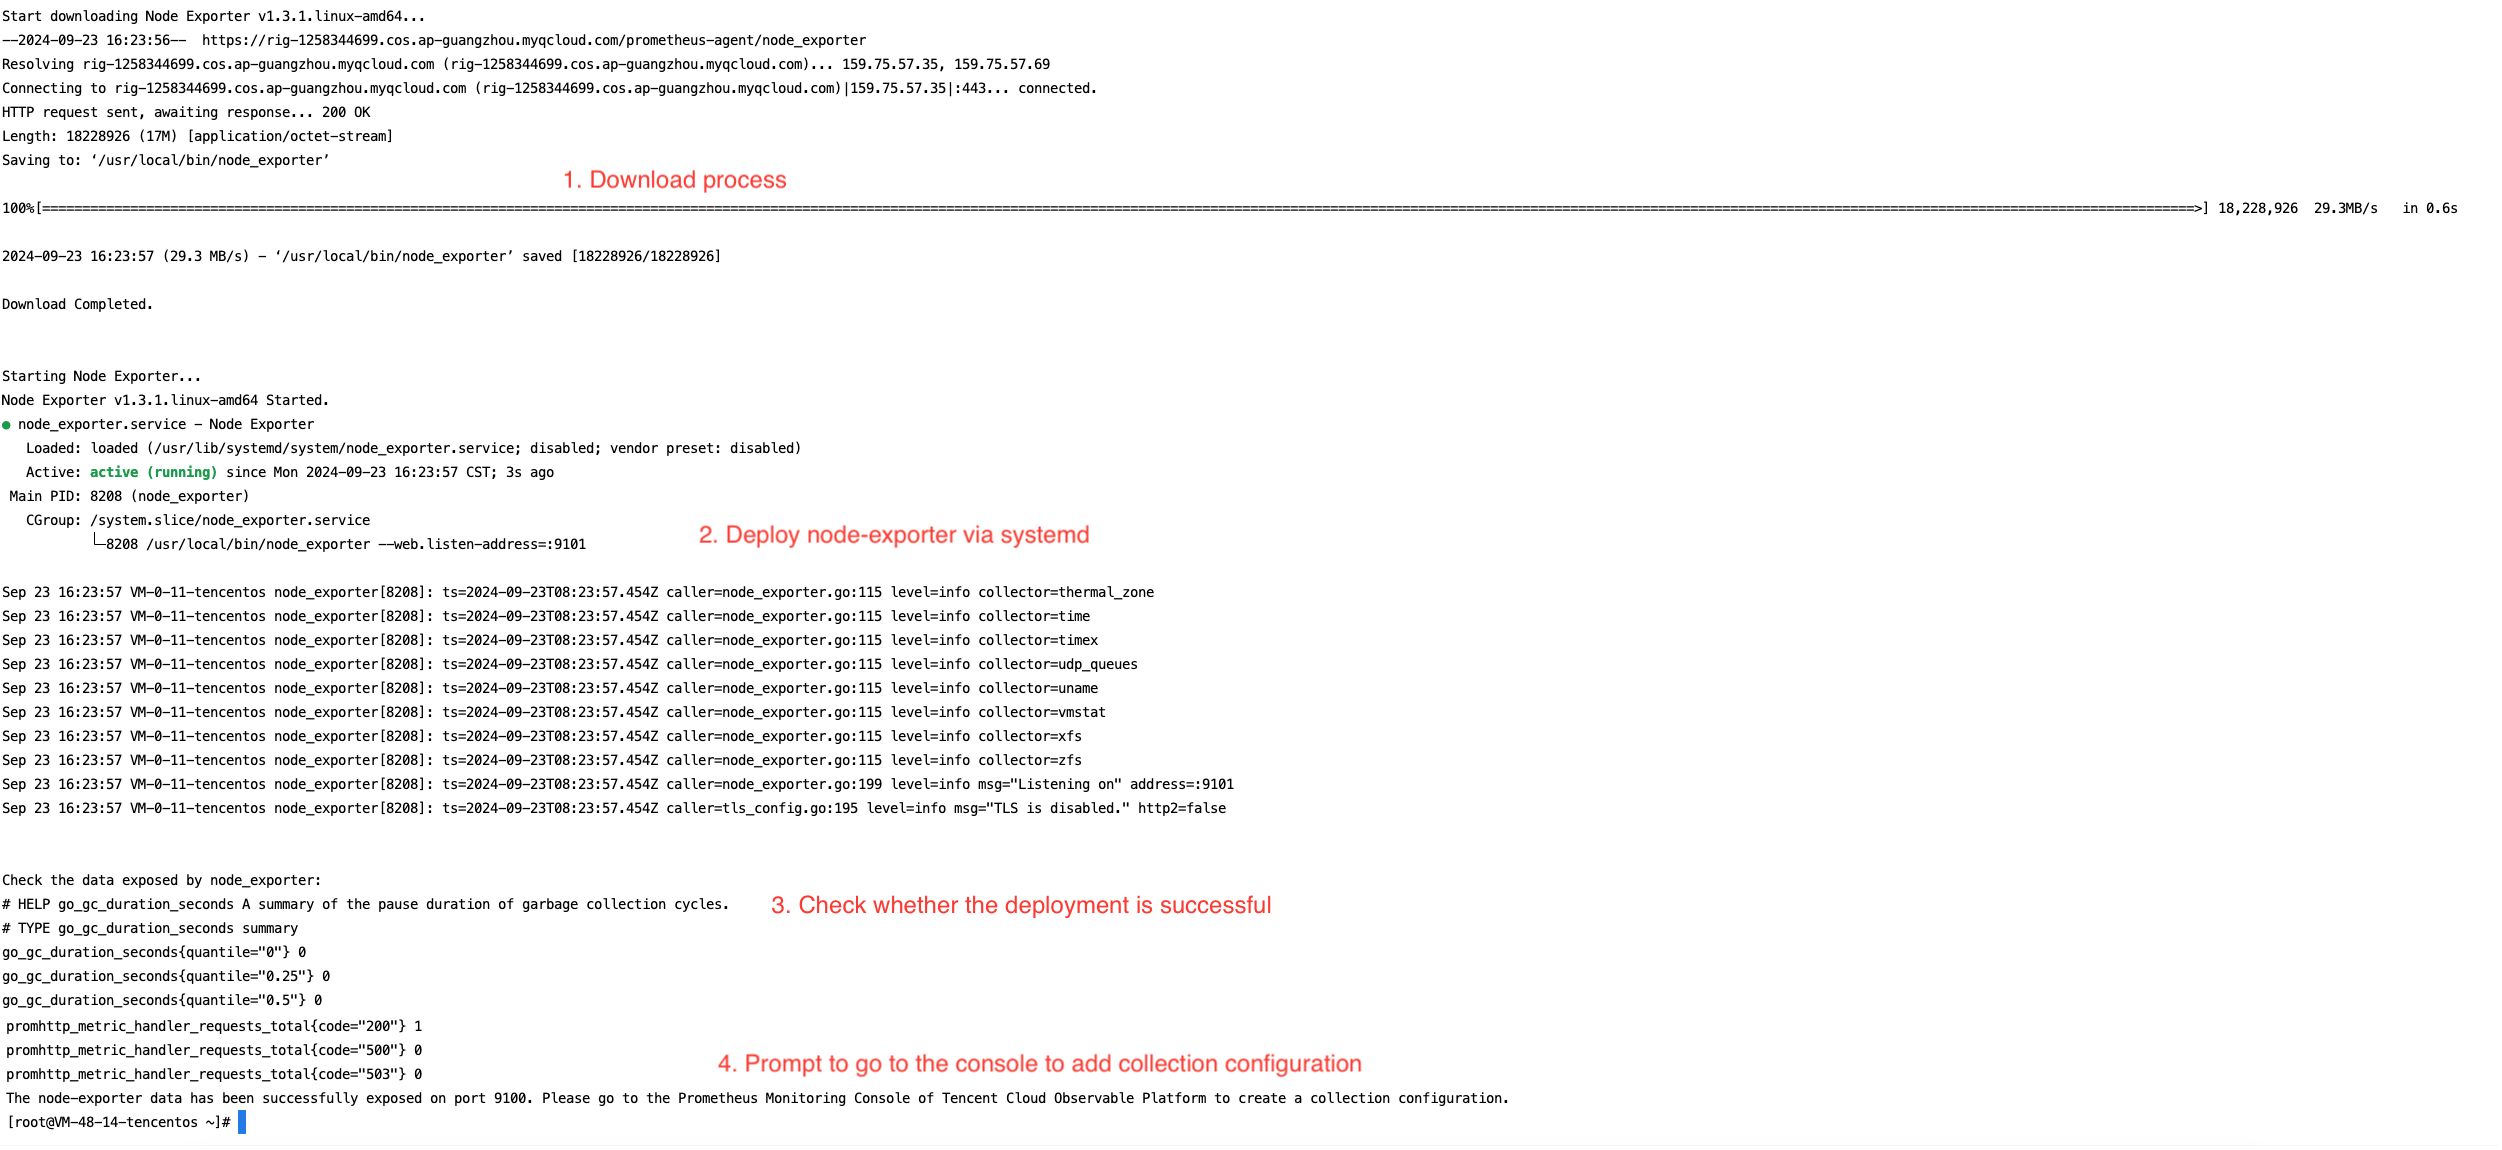
Executing the script will automatically trigger the following actions: Download node_exporter, run node_exporter, check data reporting, and complete (data will be successfully exposed on port 9100).
An example of the script execution result is shown below:


Note:
The default parameters in the script are port=9100 and path=/metrics. If you need to customize parameters or perform operations such as restarting, stopping, health checks, or viewing logs, you can manage the script using Systemctl.
Custom parameters:
To modify the port, replace the script execution statement with:
wget https://rig-1258344699.cos.ap-guangzhou.myqcloud.com/prometheus-agent/node_exporter_install -O node_exporter_install && chmod +x node_exporter_install && ./node_exporter_install --web.listen-address=":9100"
To modify the path, replace the script execution statement with:
wget https://rig-1258344699.cos.ap-guangzhou.myqcloud.com/prometheus-agent/node_exporter_install -O node_exporter_install && chmod +x node_exporter_install && ./node_exporter_install --web.telemetry-path="/metrics"
Note:
For more guidance on configuring custom parameters, see documentation.
Common script management operations:
Restart:
systemctl restart node_exporter
Stop:
systemctl stop node_exporter
Status check:
systemctl status node_exporter
Viewing logs:
journalctl -u node_exporter
2. Ensure that the host's network is connected to the Prometheus instance's private network.
If the connection has been established via Direct Connect (DC), reporting can be done over the private network without any additional operation. Otherwise, to report over the public network, follow the steps below:
The host needs to have a public IP address enabled, which will serve as the target IP for data collection.
The route table of the VPC where the Prometheus instance is located needs to be configured with a NAT gateway. For guidance, see Enabling Public Network Access for TKE Serverless Cluster.
3. Manually open security group restrictions.
The inbound rules of the host’s security group need to be configured with an authorized policy that allows access: the protocol type should be Custom TCP, the port should match the <port> specified in the script, and the source IP should be 0.0.0.0/0.

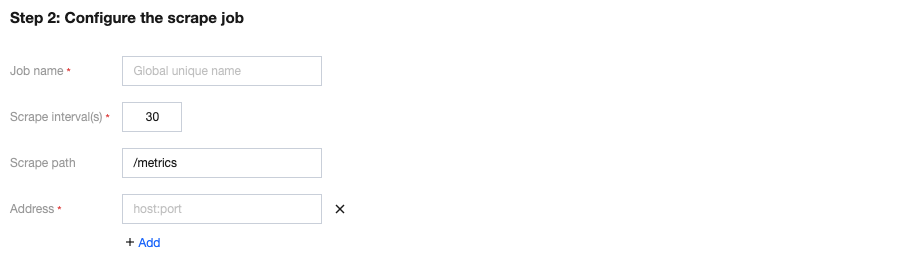
Step 2: Configuring the Scraping Job


Parameter
Description
Job name
Exporter name, which should meet the following requirements:
The name should be unique.
The name should conform to the following regular expression: '^[a-z0-9]([-a-z0-9]*[a-z0-9])?(\\.[a-z0-9]([-a-z0-9]*[a-z0-9])?)*$'.
Scrape interval(s)
Enter the metric collection interval (s).
Scrape path
Enter the collection target address in the format host:port. Multiple addresses can be added.
Address
Enter the metric collection path. The default path is /metrics.

Method 2: Custom Installation

The installation method from Step 1 can also be replaced with a custom installation, following the guide below.

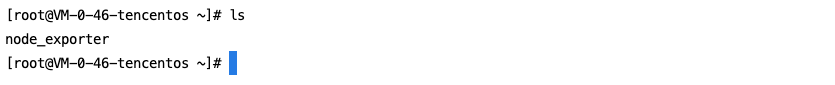
1. Downloading and installing node_exporter:

On the host where data needs to be reported, download and install node_exporter. You can click the Prometheus open-source website download link for node_exporter or directly execute the following command:
wget https://rig-1258344699.cos.ap-guangzhou.myqcloud.com/prometheus-agent/node_exporter -O node_exporter
The directory is the current folder:


2. Running node_exporter to Collect Basic Monitoring Data:

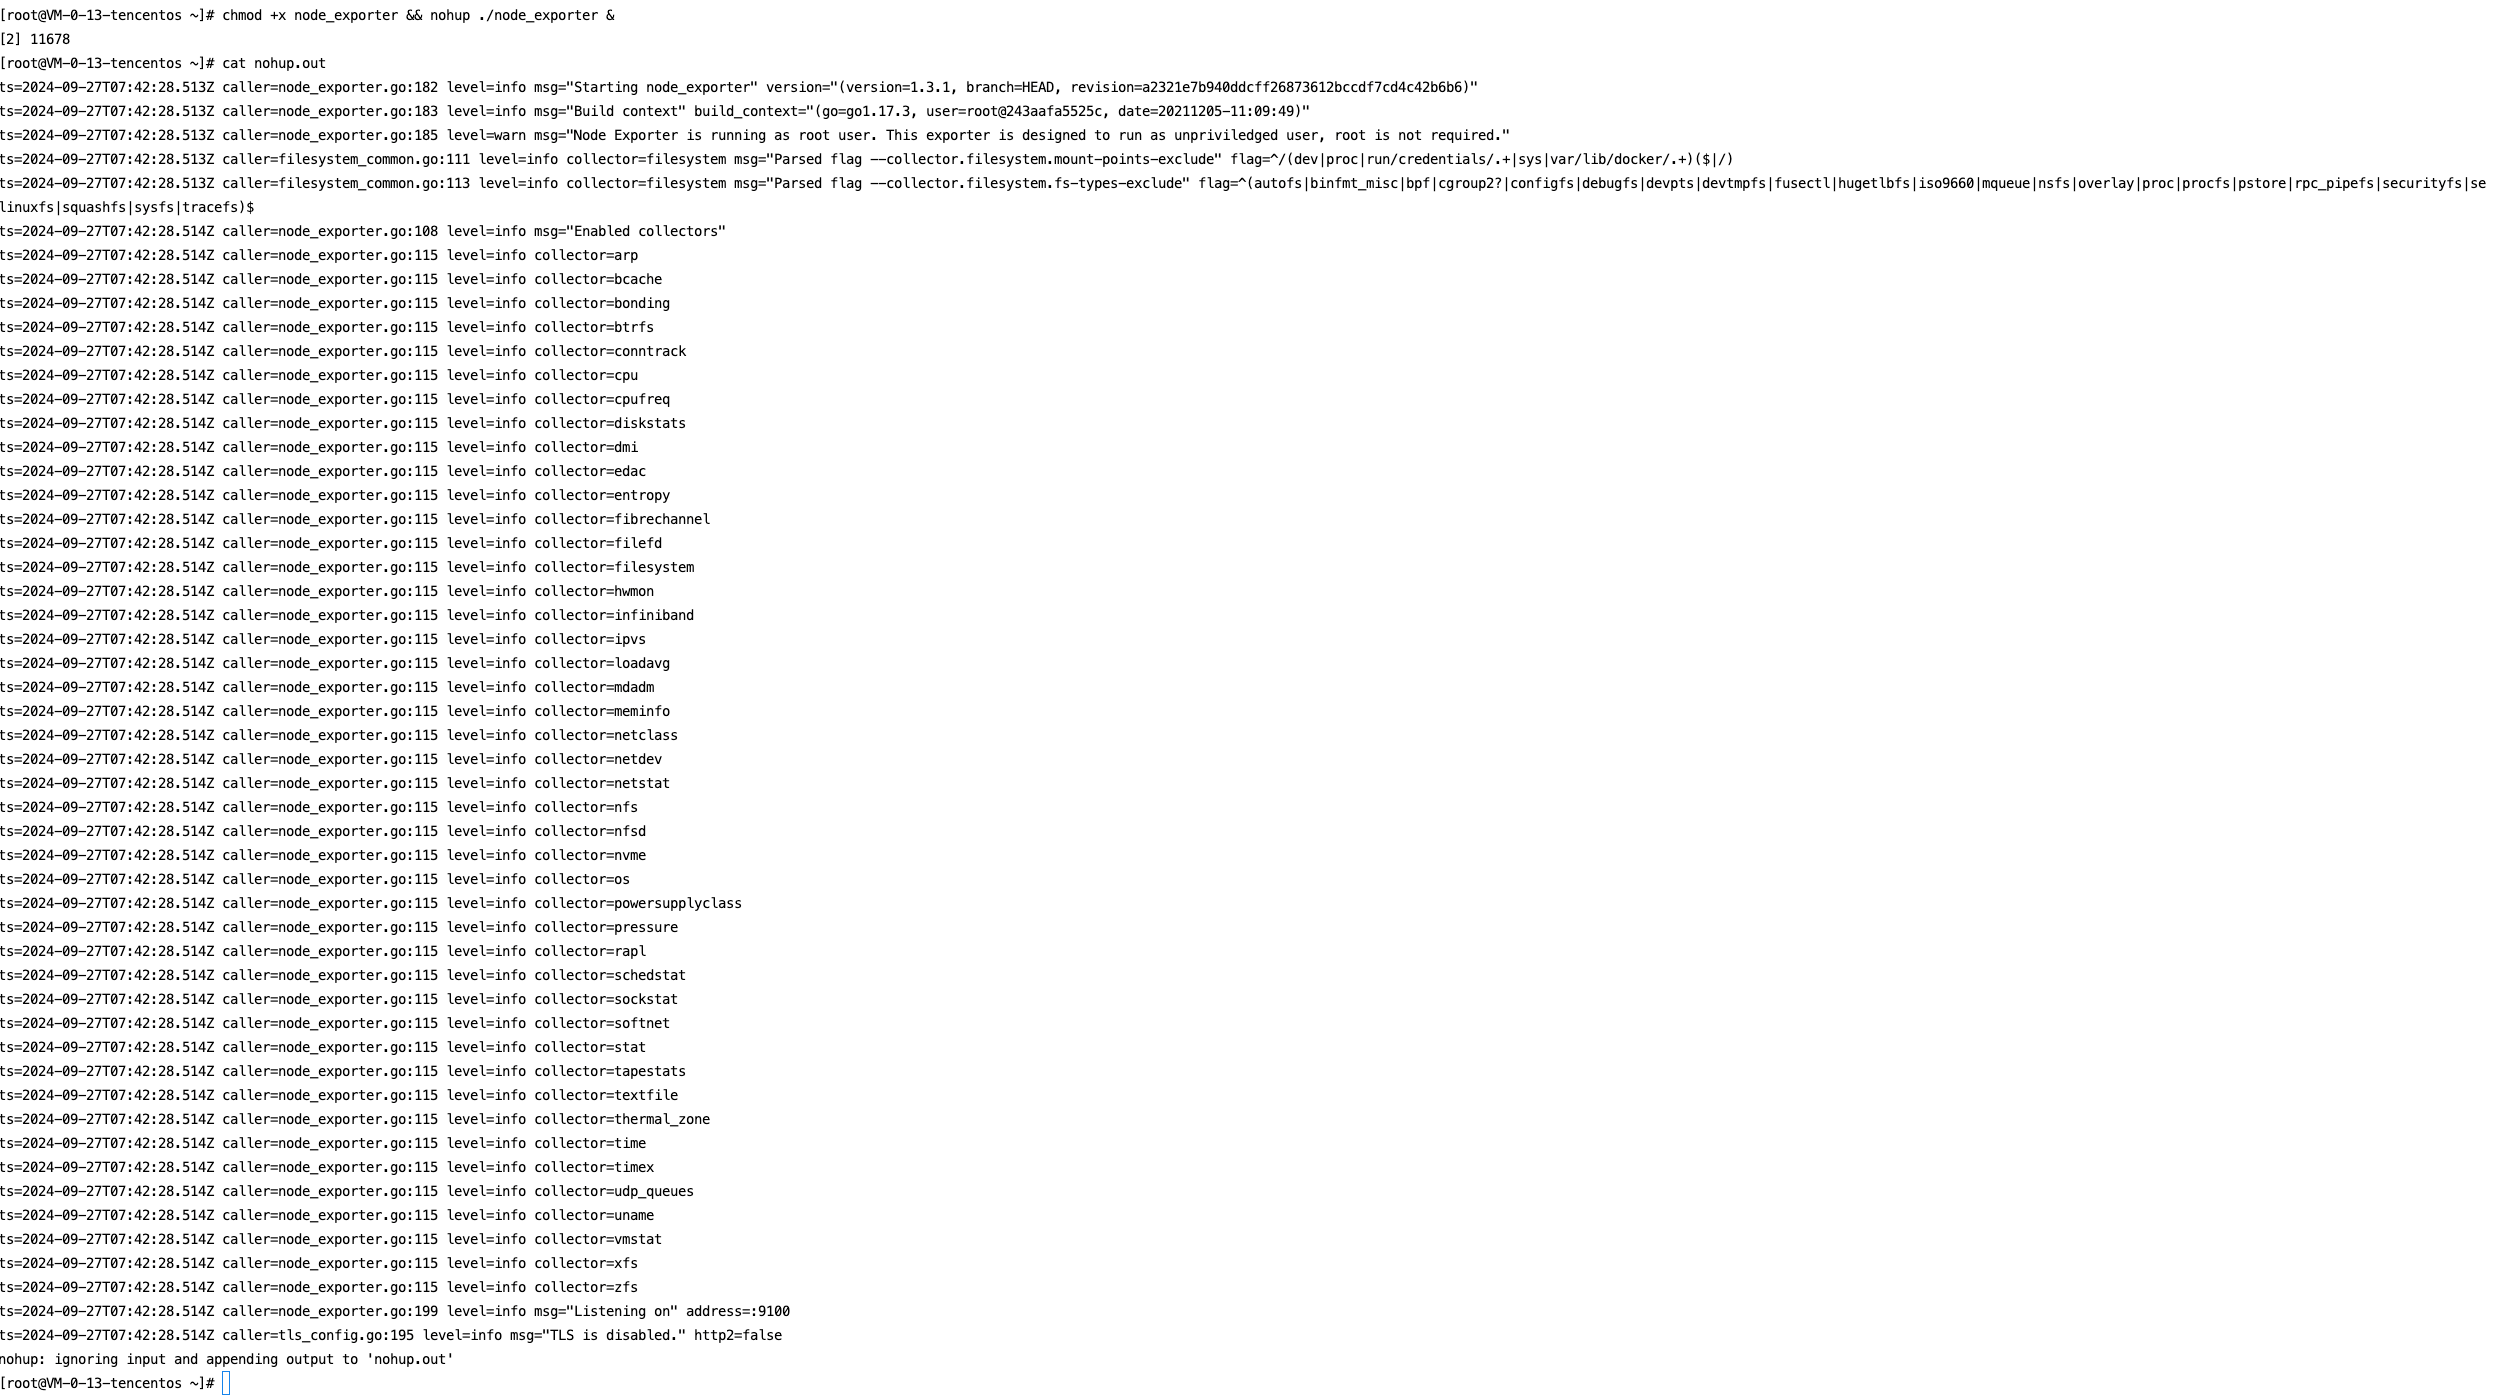
Grant permissions, execute node_exporter, and view the logs.
chmod +x node_exporter && nohup ./node_exporter &
cat nohup.out
The following image shows a successful execution:


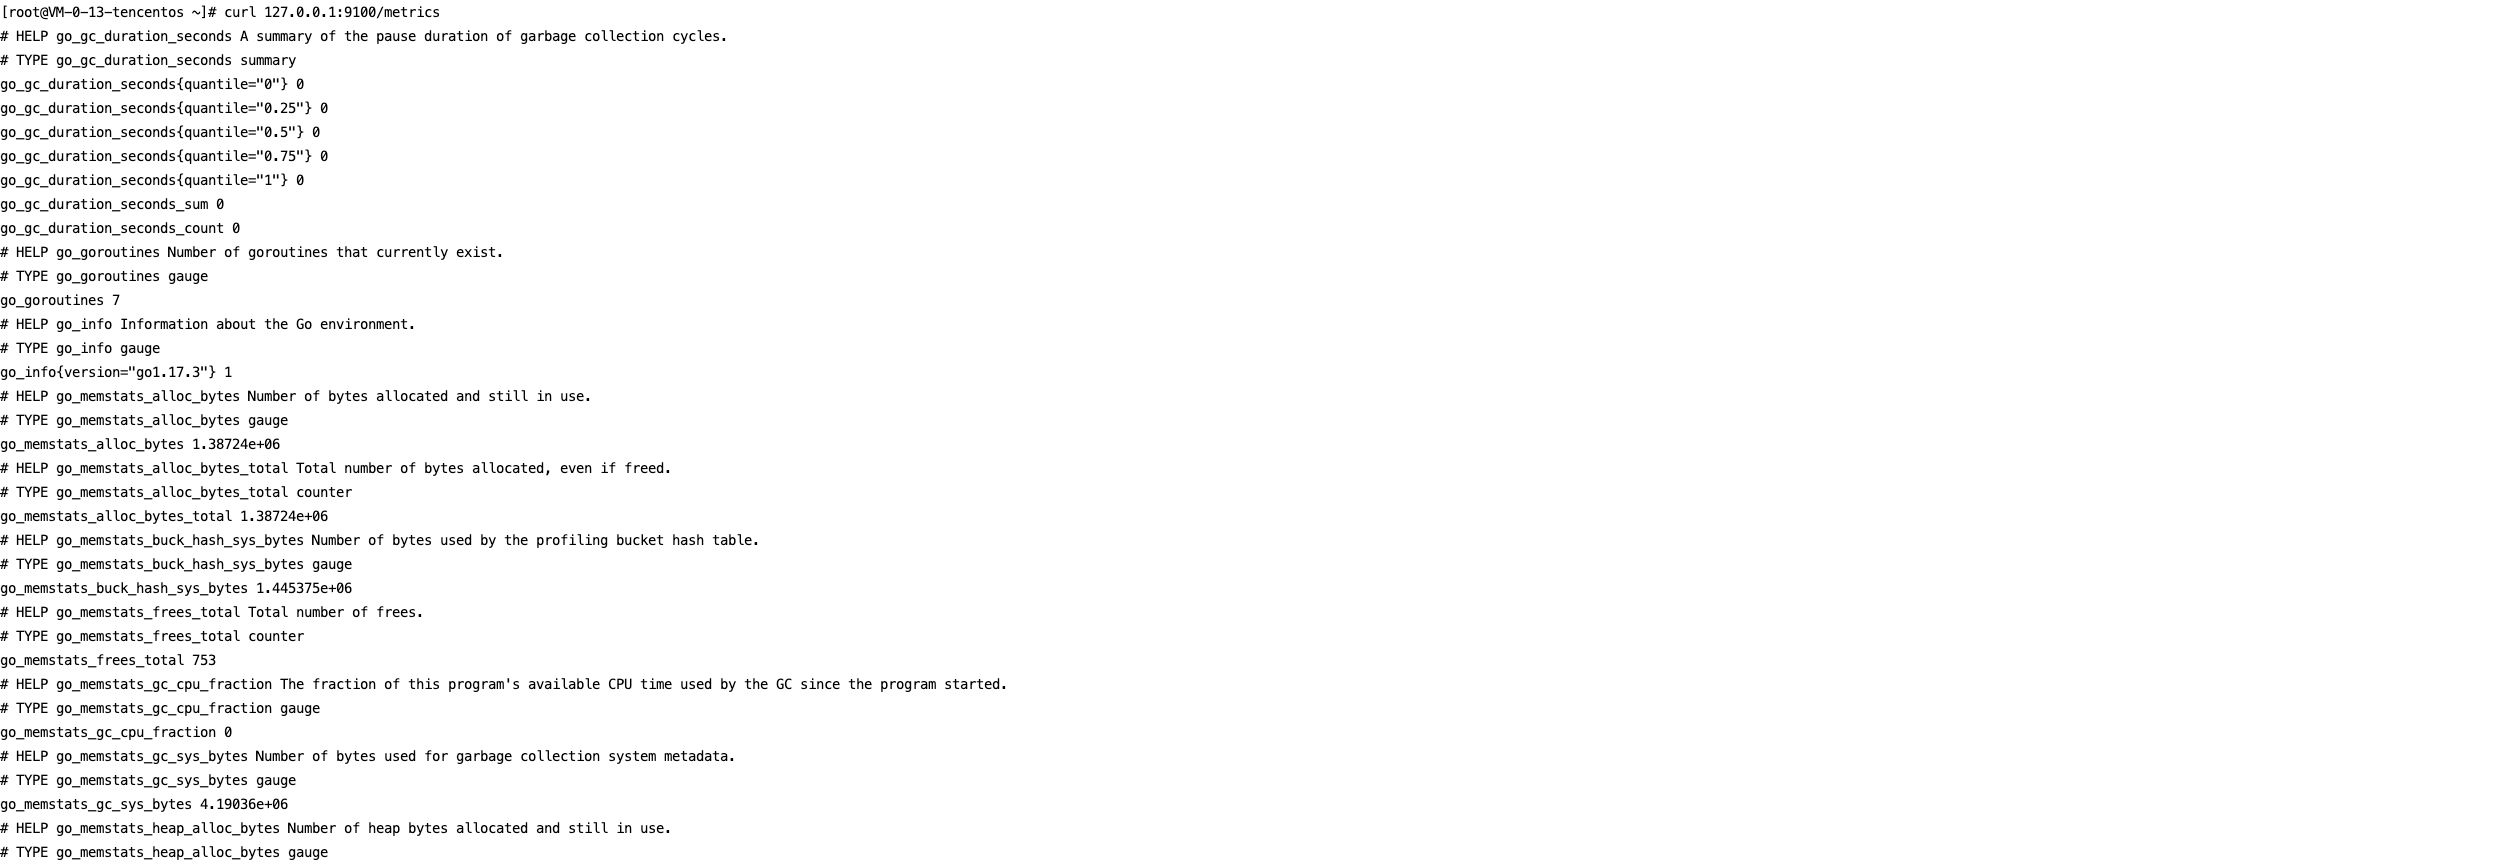
You can use the following command to view the monitoring data exposed on port 9100:
curl 127.0.0.1:9100/metrics
The following image shows the exposed metric monitoring data after executing the command:


After completing the above operations, you need to configure the scraping task on the page. See Configuration Description in Method 1 for guidance.

Viewing Monitoring Information

Prerequisites

The Prometheus instance has been bound to a Grafana instance.

Operation Steps

1. Log in to the TMP console and select the corresponding Prometheus instance to enter its management page.
2. In Data Collection > Integration Center, find the Non-Tencent Cloud Host Monitoring card on the Integration Center page, and click to open the integration page. Then, select Dashboard > Dashboard Install/Upgrade to install the corresponding Grafana Dashboard.
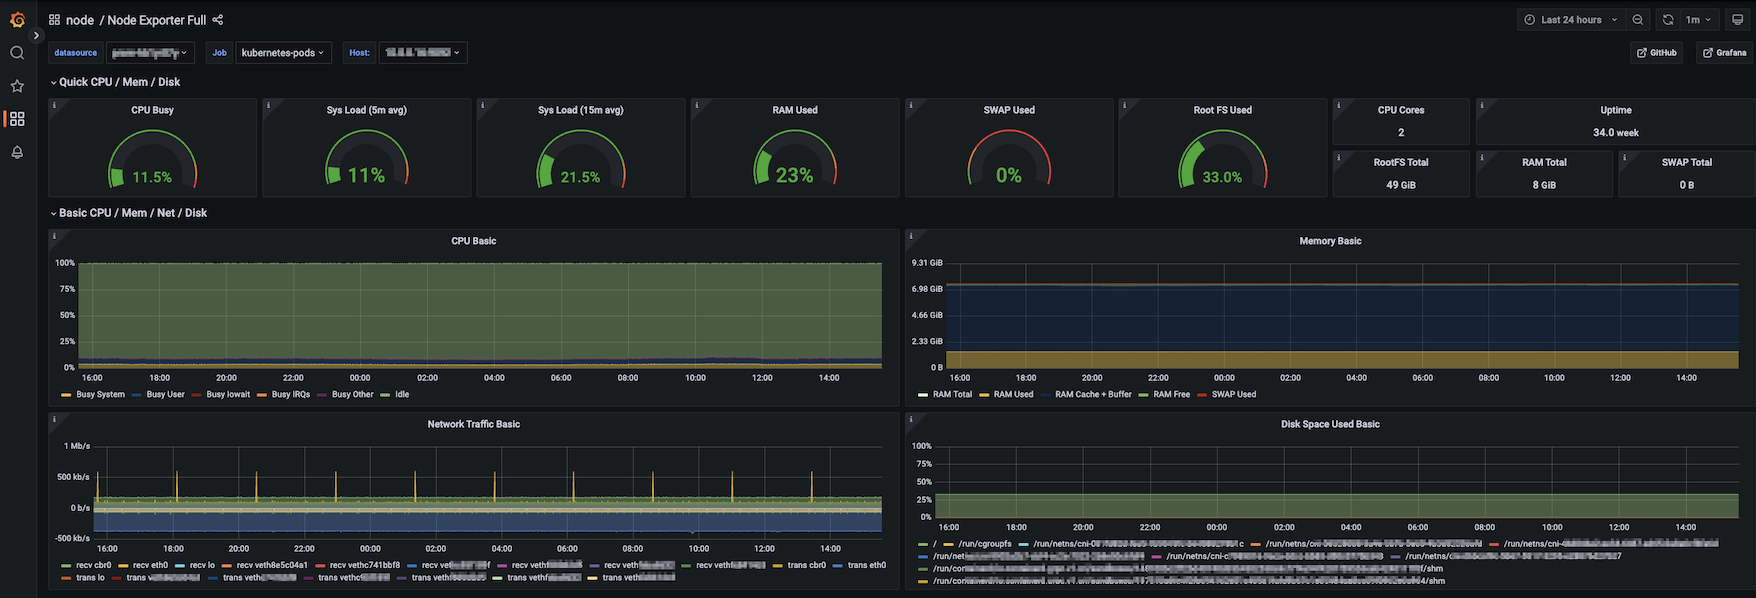
3. Open the Grafana instance address associated with the Prometheus instance, and navigate to the Dashboards page to view the relevant monitoring dashboards.


Configuring Alarm

1. Log in to the TMP console and select the corresponding Prometheus instance to enter its management page.
2. Select Alarm Management to add the corresponding alarm policies. For details, see Creating Alarm Rules.

도움말 및 지원

문제 해결에 도움이 되었나요?

피드백