Scenarios
The TDMQ for CKafka (CKafka) connector supports daily monitoring of data synchronization tasks under your account. You can view detailed monitoring data in real time in the console to understand the health status of the tasks. You can also configure alarm rules for key metrics. When monitoring metrics reach the set alarm threshold, Tencent Cloud Observability Platform (TCOP) will notify you via email, Short Message Service (SMS), WeChat, or phone, helping you promptly detect cluster issues and handle them while ensuring the stable running of the tasks.
Monitoring Metrics and Meanings
|
Read side | SetSourceRecordPollRate | Number of messages read per second from a Kafka topic at the data source. | Count/s |
| SetUpstreamBytesPollRate | Number of messages read per second from a Kafka topic at the data source. | MB/s |
| SetTotalRecordErrors | Number of messages that failed to be read from a Kafka topic at the data source. | Count/s |
Write side | SetSourceRecordWriteRate | Number of messages written per second to the data target. | Count/s |
| SetDownstreamBytesSendRate | Total traffic of messages written per second to the data target. | MB/s |
| SetPollBatchMaxTimeMs | Maximum time difference from message reading to completion of writing | ms |
Task performance metric | SetConnectorTasksMax | Number of active concurrent tasks. | Count |
| SetTaskHealthy | 1 indicates healthy; 0 indicates unhealthy (such as exception or failure). | None |
Viewing Monitoring Data
2. Choose Connector > Task List and click the ID of the target task to go to the basic information page.
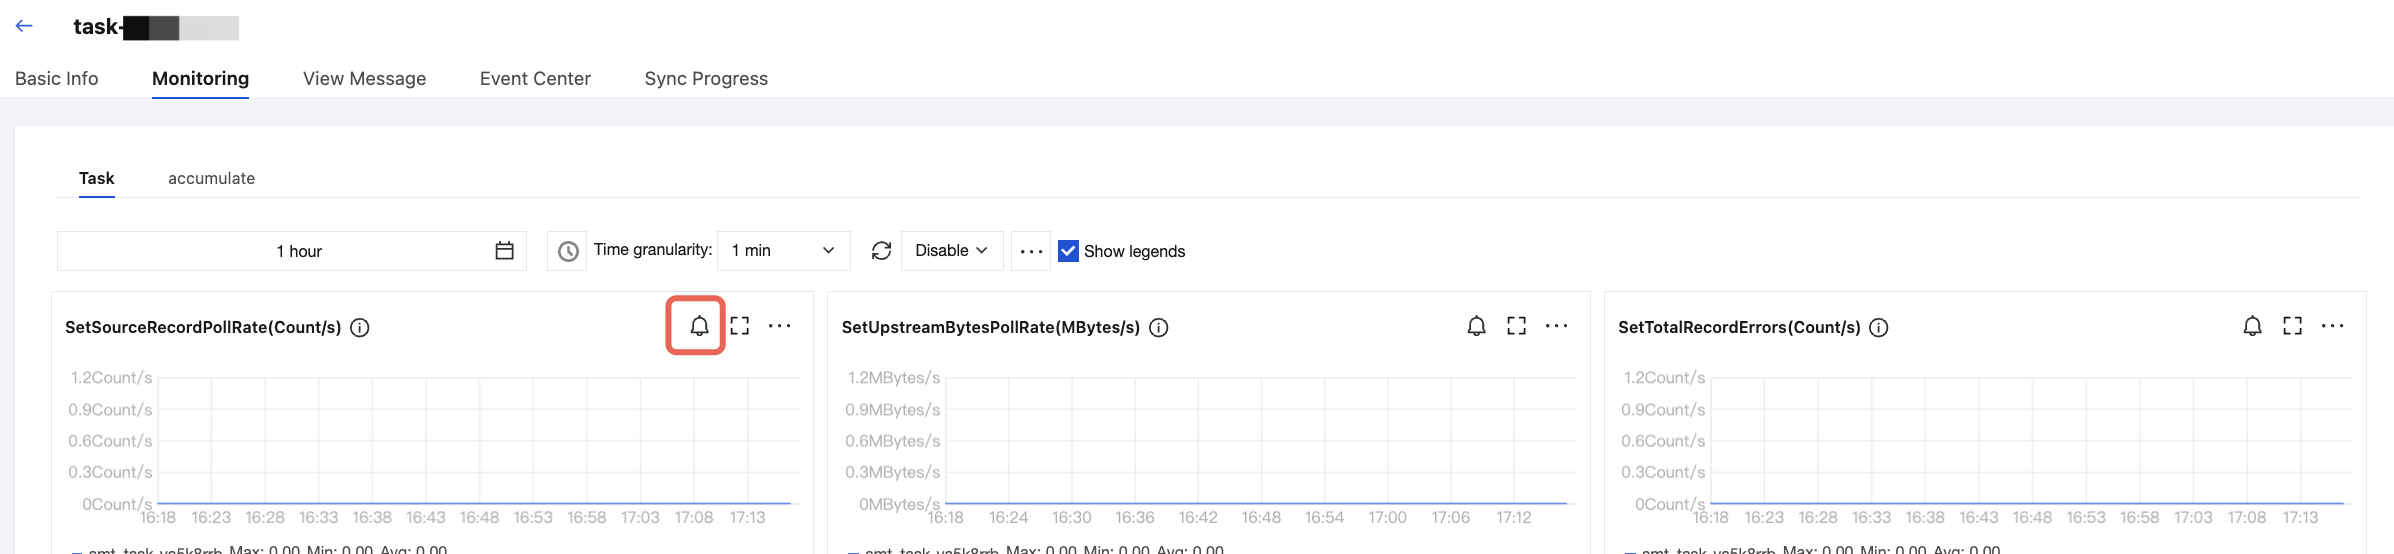
3. On the basic information page, select the Monitoring tab at the top and set the time range to view the corresponding monitoring metrics.
On the monitoring page, you can perform the following operations:
|
Comparing time | | You can click the week-on-week and day-on-day comparison icon to select week-on-week (same period last week), day-on-day (same period yesterday), or a custom date range to compare changes in the cluster status across different time periods. |
Setting the refresh interval | | You can click the refresh icon on the left side to update the chart. Click the drop-down menu on the right side to select the automatic refresh interval for the entire chart. You can set the interval to 1 minute or 5 minutes. |
Replicating a chart to the dashboard | | You can click the icon to replicate a chart to the dashboard. For more information about the dashboard, see What Is a Dashboard. |
Displaying the legend | | You can check this box to display legend information in the chart. |
Alarm Configuration Recommendations
This section describes key metrics that require special attention and recommended alarm configurations during the use of the CKafka connector:
|
set_total_record_errors | Set the statistical granularity to 1 minute. If the value of Data Read Failures is greater than 100 counts/s for 3 consecutive data points, trigger an alarm every 15 minutes. | 1. Check whether the upstream systems are running properly and whether data can be read normally. 2. Check whether the upstream systems have network issues, as network failures may cause data to be unreadable. 3. Check whether the data format of upstream systems has been adjusted. If the exception persists after you exclude the above reasons, contact us. |
set_task_healthy | Set the statistical granularity to 1 minute. If the value of Task Health Status is 0 for 3 consecutive data points, trigger an alarm every 15 minutes. | Check whether the upstream and downstream systems are running properly. If they are running properly and data can be read and written normally, but the task status is abnormal, contact us. |
set_source_resource_health | Set the statistical granularity to 1 minute. If the value of Source Connection Health Status is 0 for 3 consecutive data points, trigger an alarm every 15 minutes. | Check whether the upstream (source) systems provide services properly. If they provide services normally and the network status is normal, but the connection status is abnormal, contact us. |
Target connection health status | Set the statistical granularity to 1 minute. If the value of Target Connections is 0 for 3 consecutive data points, trigger an alarm every 15 minutes. | Check whether the downstream (target) systems provide services normally. If they provide services normally and the network status is normal, but the connection status is abnormal, contact us. |
Configuring an Alarm Policy
1. You can select either of the following two entries on the alarm page:
Entry 1: Log in to the CKafka console. Choose Connector > Task List and click the ID of the target task to go to the basic information page. Select the Monitoring tab at the top. Click the alarm configuration icon in the upper-right corner of the monitoring chart, and you will be redirected to the Alarm Configuration page. The alarm recipient is the task type before redirection by default. Entry 2: Log in to the TCOP console. On the Alarm Configuration page, click Create Policy. Set the monitoring type to Cloud Product Monitoring and set the policy type to ckafka_connector_set. 2. Select the task object for which you want to set an alarm in Alarm Object.
3. Set alarm trigger conditions. Select Template and Configure Manually are supported. By default, Configure Manually is selected.
Metric: Taking the set_task_healthy for example, set the statistical granularity to 1 minute. If the value of Task Health Status exceeds the threshold for N consecutive data points within 1 minute, an alarm will be triggered.
Alarm Frequency: For example, "Alarm every 30 minutes" indicates that an alarm is triggered once every 30 minutes if a metric exceeds the threshold in multiple consecutive statistical periods. Another alarm will be triggered only if the metric exceeds the threshold again in the next 30 minutes.
1. Select Select Template. Then, click Create Trigger Condition Template to redirect to the trigger condition template setup page.
2. In the upper-left corner, click New Trigger Condition Template. On the template creation page, configure the alarm policy.
Policy Type: Select a policy type under ckafka_connector_task.
Trigger Condition: Set the alarm policy based on the recommendations we provide or your actual business requirements.
3. After confirming that everything is correct, click Save and return to the alarm policy creation page. Click Refresh, and the configured alarm policy template will then appear.
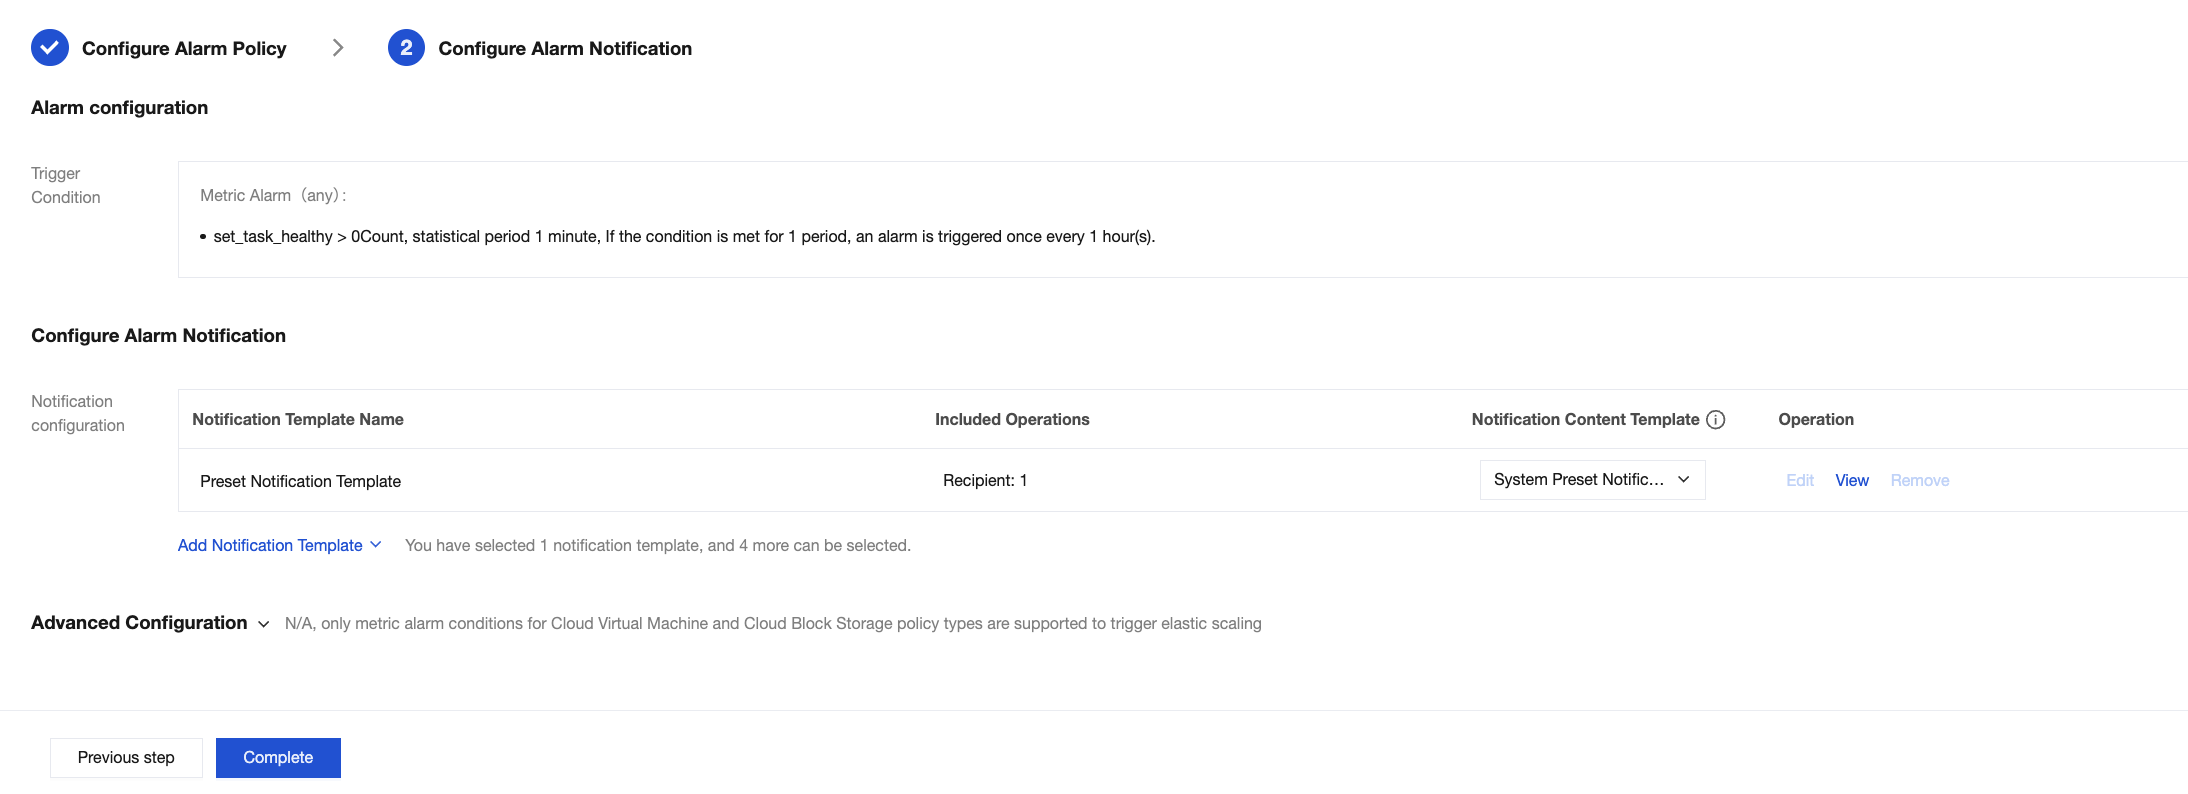
4. Click Next step: Configure Alarm Notification to configure alarm recipients.
You can select a notification template preset by the system. The alarm recipient of a preset template is typically the person in charge of the root account. To notify the person in charge of the instance or other personnel, you can also click Add Notification Template to create a notification template and set alarm recipients and notification channels.
5. After confirming that the information is correct, click Complete to complete the configuration of alarm rules.