Querying Cluster Logs
Download
포커스 모드
폰트 크기
This document describes how to use ES cluster logs. You can use the logs to learn about the running status of the cluster, locate problems, and assist with cluster application development and OPS.
Querying Cluster Logs
1. Log in to the ES Console and click a cluster name to enter the cluster details page.
2. Select the Cluster Logs page to view the logs of the cluster.
ES has four types of logs: master log, slow search log, slow index log, and GC log. The log content includes log time, log level, and specific information.
ES retains cluster logs of the last 7 days by default, which are displayed from newest to oldest and can be queried by time and keyword. In addition, you can also call ES APIs to adjust the log-related configuration. For example, for slow logs, you can set the time threshold that is considered as slow response during data querying or indexing.
3. In the search box on the log page, you can query related logs by time range and keyword. The keyword query syntax is the same as the Lucene query syntax.
Enter a keyword for querying, such as "YELLOW".
Specify a field-specific keyword, such as "message:YELLOW".
Combine multiple criteria for querying, such as
level: INFO and ip: 10.0.1.1.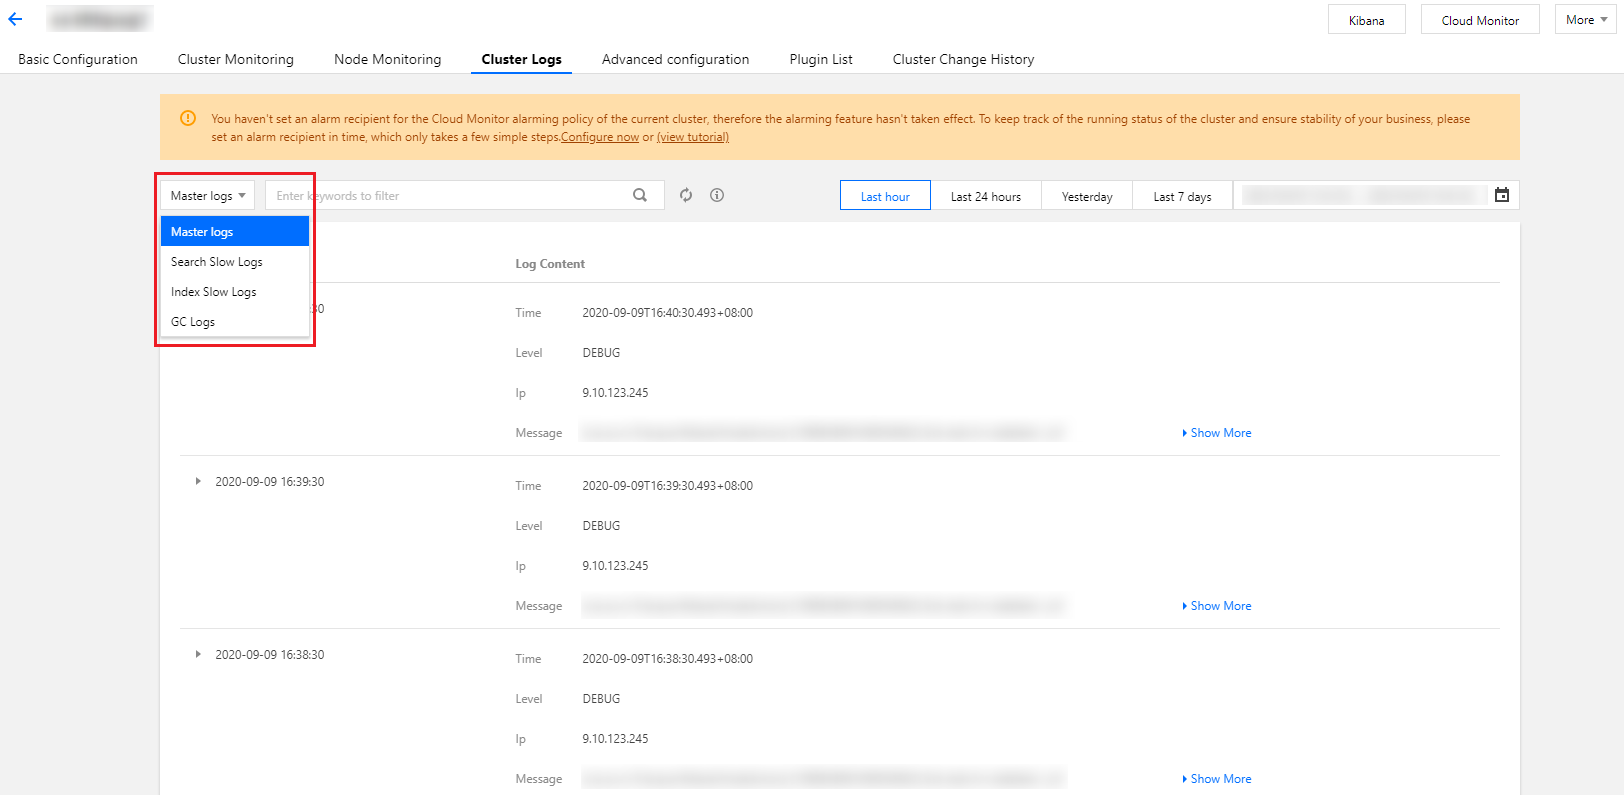
Log Description
Master log
It displays the time, level, and information of the log generated by the cluster and has different levels such as INFO, WARN, and DEBUG.
2019-2-14 08:00:00 10.0****INFO[o.e.c.r.a.AllocationService] [1550199698000783811] Cluster health status changed from [YELLOW] to [GREEN] (reason: [shards started [[filebeat-2019.02.19][2]] ...]).2019-2-14 02:30:02 10.0****DEBUG[o.e.a.a.i.d.TransportDeleteIndexAction] [1550199698000783811] failed to delete indices [[[filebeat-2019.02.09/7VZM6Fa-Twmj8pVaAyyrxg]]]org.elasticsearch.index.IndexNotFoundException: no such indexat org.elasticsearch.cluster.metadata.MetaData.getIndexSafe(MetaData.java:475) ~[elasticsearch-5.6.4.jar:5.6.4]at org.elasticsearch.cluster.metadata.MetaDataDeleteIndexService.lambda$deleteIndices$0(MetaDataDeleteIndexService.jav
Slow log
Slow log is used to capture querying and indexing requests that exceed the specified time threshold for tracking and analyzing very slow requests generated by user.
2018-10-28 12:04:17WARN[index.indexing.slowlog.index] [1540298502000001009] [pmc/wCALr6BfRm-sr3qOQuGXXw] took[18.6ms], took_millis[18], type[articles], id[AWa41-J9c0s1mOPvR6F3], routing[] , source[]
Enable and adjust slow log
Slow log is disabled by default. To enable it, you need to define the specific action (query, fetch, or index), expected event record level (INFO, WARN, or DEBUG), and time threshold. You can enable and adjust related configuration based on your business needs.
To enable slow log, click Kibana in the top-right corner on the cluster details page to enter the Kibana page, call the Elasticsearch-related API via Dev Tools, or call the configuration modifying API through the client.
Configure all indices:
PUT */_settings{"index.indexing.slowlog.threshold.index.debug" : "5ms","index.indexing.slowlog.threshold.index.info" : "50ms","index.indexing.slowlog.threshold.index.warn" : "100ms","index.search.slowlog.threshold.fetch.debug" : "10ms","index.search.slowlog.threshold.fetch.info" : "50ms","index.search.slowlog.threshold.fetch.warn" : "100ms","index.search.slowlog.threshold.query.debug" : "100ms","index.search.slowlog.threshold.query.info" : "200ms","index.search.slowlog.threshold.query.warn" : "1s"}
Configure one single index:
PUT /my_index/_settings{"index.indexing.slowlog.threshold.index.debug" : "5ms","index.indexing.slowlog.threshold.index.info" : "50ms","index.indexing.slowlog.threshold.index.warn" : "100ms","index.search.slowlog.threshold.fetch.debug" : "10ms","index.search.slowlog.threshold.fetch.info" : "50ms","index.search.slowlog.threshold.fetch.warn" : "100ms","index.search.slowlog.threshold.query.debug" : "100ms","index.search.slowlog.threshold.query.info" : "200ms","index.search.slowlog.threshold.query.warn" : "1s"}
GC log
GC log is enabled in ES by default. The following two specific GC logs display the time, node IP, and log level of the log.
2019-2-14 20:48:2210.0.***INFO[o.e.m.j.JvmGcMonitorService] [1550199698000783711] [gc][380573] overhead, spent [307ms] collecting in the last [1s]2019-2-14 10:04:0910.0.***WARN[o.e.m.j.JvmGcMonitorService] [1550199698000784111] [gc][341943] overhead, spent [561ms] collecting in the last [1s]
피드백